Biology 9700/51 — May/June 2013
Cambridge A-Level · Planning, Analysis and Evaluation · worked solutions for every part, with the mark scheme
Topics Planning · Analysis, Conclusions and Evaluation
A group of students was given the task of planning a method to find the effects of the growth regulator gibberellin (GA) on the germination of maize grains.
The students looked up information about investigations into the germination of maize. The information that the students found is listed below.
- Maize needs to be soaked in water for 24 hours to stimulate germination.
- Maize starts to germinate 48–72 hours after soaking.
- GA promotes germination by activating a gene that causes the synthesis of the enzyme amylase.
- The range of concentrations at which GA is found in plants is between .
- Amylase is released by the aleurone layer into the endosperm of the maize grain to hydrolyse the starch reserves.
- The activity of amylase can be estimated by cutting the maize grains lengthways into two halves and placing the cut sides onto agar containing starch in Petri dishes.
- After incubation at a constant temperature, iodine solution is used to test the agar for the presence of starch.
The students carried out a preliminary investigation using maize grains that had been soaked in a solution of GA.
Fig. 1.1 shows the arrangement of cut maize grains that the students decided to use for their main investigation and the results of testing the agar for starch using iodine solution after incubation.
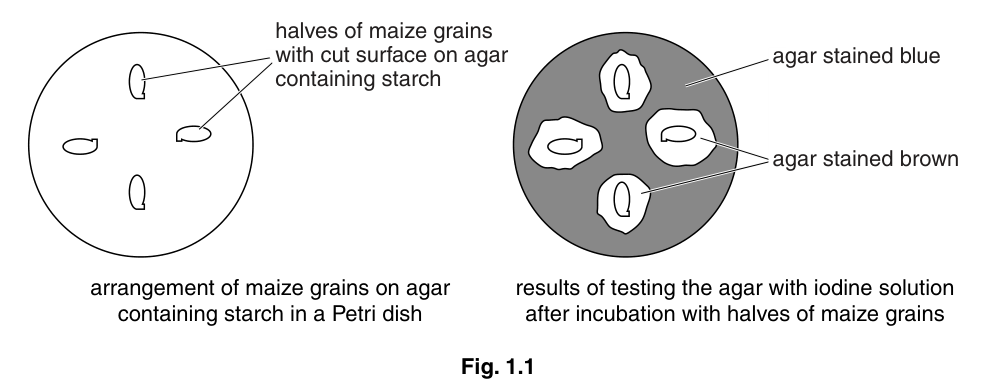
The students thought that the area stained brown was proportional to the activity of the amylase and could be used to test the hypothesis:
The greater the concentration of gibberellin (GA) to which the maize is exposed, the greater the activity of amylase.
Identify the independent and the dependent variables in the students’ preliminary investigation.
independent variable = ______
dependent variable = ______
Answer
independent variable = concentration of GA
dependent variable = (mean) area of the starch-free / clear / brown zone (around the cut grain halves)
IV: concentration of GA; DV: (mean) area of starch-free / clear / brown zone around the cut grain halves
Background Concept
In any scientific investigation, variables are categorised by role:
- Independent variable (IV): the factor that is deliberately changed or manipulated between experimental groups.
- Dependent variable (DV): the factor that is measured to detect any effect of changing the IV.
- Standardised (controlled) variables: all other factors kept constant to ensure a fair test.
In this question, amylase activity is being estimated indirectly. The cut maize grain releases amylase onto starch agar; the enzyme digests the starch around the cut surface, and iodine staining reveals the area of digestion as a brown / clear zone on an otherwise blue-stained agar.
Understanding the Question
The students have completed a preliminary investigation. The question asks the candidate to name the IV and DV. Although the preliminary used only one GA concentration, the IV is identified as the factor the students will vary in the full investigation — the GA concentration. The DV is what they measure to detect an effect — the size of the starch-free zone around the grain halves.
Approach
Read the preliminary method and identify which factor was deliberately different between treatments and which factor was measured. Then write each variable using the precise terminology that the mark scheme accepts.
Step-by-Step Reasoning
- The students deliberately exposed the maize to a specified GA concentration (3 mmol dm⁻³). In a full investigation this is what would be varied → independent variable = concentration of GA.
- They measured the size of the brown / clear zone in the agar after adding iodine → dependent variable = (mean) area of the starch-free / clear / brown zone around the grain halves.
The mark scheme accepts "area" or "zone (around grains)", and also accepts "diameter / radius / size", "clear zone", "brown zone" or "digested starch". It rejects "amount / quantity" alone, and ignores references to "amylase activity" because the zone size is only an indirect proxy for it.
Key Takeaways
- IV = what you vary; DV = what you measure.
- Use precise terminology: "concentration" not "amount"; "area / zone / diameter" not "size".
- The DV must describe the actual measurement, not the inferred biological quantity.
Common Mistakes
- Writing "amount of GA" instead of "concentration of GA" — the mark scheme explicitly rejects "amount / quantity".
- Writing "amylase activity" as the DV — the zone size is only an indirect estimate, not a direct measure of activity.
- Reversing IV and DV.
Things to Be Careful About
- Even though only one GA concentration was used in the preliminary, the IV is still identified as the factor that would be varied in the main investigation.
- Diameter / radius / size of the zone are all acceptable alternatives to area.
The students were provided with a GA solution.
Describe how the students could use the method from their preliminary investigation to test their hypothesis. Your method should be detailed enough for another person to use.
Method
Dilution of GA solutions
Make a serial dilution of the stock GA solution with distilled (or deionised) water to give at least 5 different concentrations between and (e.g. ) and a water control ().
Example: add of stock solution to of distilled water to halve the concentration; take of this and add to a further of water to halve it again; repeat.
Soaking the grains
Place the same stated number of maize grains in the same stated volume (e.g. ) of each GA solution — or distilled water for the control — for between 24 and 72 hours so that GA can activate amylase synthesis.
Cutting and plating
Cut each soaked grain lengthways into two halves. Place the same stated number of halves (e.g. 4) cut-side down onto starch agar in a Petri dish. Cover each dish to prevent evaporation and contamination.
Incubation
Incubate all Petri dishes at the same stated temperature (e.g. ) for the same stated time (e.g. 48 hours) in a thermostatically controlled incubator or water bath so that enzyme activity is comparable between dishes.
Measuring amylase activity
After incubation, add iodine solution to the agar. Trace the outline of each brown / clear zone onto a transparent grid (or photograph each dish and overlay a grid) and count the squares to give the area of the starch-free zone. Alternatively, measure the diameter with a ruler / callipers and calculate the area using . Calculate the mean area for each concentration.
Standardising variables
- Same number of grains / halves per dish
- Same volume of soaking solution per group
- Same incubation temperature (controlled using an incubator) and same incubation time
- Same concentration, volume and depth of starch agar in each Petri dish
Reliability
Repeat each concentration in at least 3 Petri dishes (replicates). Calculate a mean starch-free area per concentration; identify and exclude anomalous results.
Safety
This is a low-risk investigation. Cut grains on a tile, directing the blade away from hands. Wear gloves and / or a mask if there is any risk of allergy or irritation from the maize.
See method (working)
Background Concept
A scientific investigation requires careful planning so that the results are valid (test what you think you are testing) and reliable (reproducible). Key elements are:
- Independent variable (IV): what is varied.
- Dependent variable (DV): what is measured.
- Standardised variables: kept the same so that only the IV can affect the DV.
- Control: a treatment that lacks the IV, giving a baseline for comparison.
- Replicates: repeated measurements that allow a mean to be calculated and anomalies identified.
- Safety and ethical considerations.
Gibberellin (GA) is a plant growth regulator that promotes germination in cereal grains such as maize. GA activates a gene in the aleurone layer that codes for amylase; amylase is secreted into the endosperm, where it hydrolyses starch into maltose and glucose to fuel the embryo. In this experiment, amylase activity is estimated indirectly by placing cut maize grains on starch agar: amylase diffuses out, digests the surrounding starch, and after iodine staining the digested area appears brown / clear on a blue background. The larger the area, the more amylase activity is inferred.
Understanding the Question
The students have done a preliminary test using a single GA concentration () and confirmed that the method produces brown zones (Fig. 1.1). The question now asks them to describe, in enough detail for another person to use, how to extend this method to test the hypothesis:
"The greater the concentration of gibberellin (GA) to which the maize is exposed, the greater the activity of amylase."
To test this, the students must:
- Use a range of GA concentrations, not just one.
- Include a water control (no GA) as a baseline.
- Keep everything else the same between concentrations.
- Replicate each concentration to obtain a mean and detect anomalies.
- State the safety precautions.
Approach
Use the preliminary method as a template (so the apparatus and procedure are familiar), but introduce a concentration series of GA produced by serial dilution. Soak grains in each concentration, then follow the same cutting / plating / incubation / iodine-testing procedure. Identify every variable to standardise, replicate each concentration, and address safety.
The concentration series should include:
- At least 5 different GA concentrations between and (plus the stock if used directly)
- A distilled-water control ()
- Replicates for each concentration
Variables to standardise (anything that could differ between dishes and confound the result):
- Number of grains / halves per dish
- Volume of soaking solution per group
- Incubation temperature and time
- Concentration, volume and depth of starch agar
- Method of measuring the brown zone
Step-by-Step Reasoning
-
Serial dilution gives a set of predictable concentrations efficiently. From a stock, a 1:1 dilution with water halves the concentration, so the sequence is easy to prepare. Each new concentration can be used to make the next, ensuring accuracy.
-
Soaking the grains in their allocated GA solution (or water for the control) for 24–72 hours allows GA time to enter the aleurone layer and stimulate amylase synthesis. The same number of grains in the same volume of solution per group makes this stage a fair test.
-
Cutting and plating: each grain is cut in half so that the cut surface (which releases amylase) faces the agar. Four halves per dish is convenient and matches the preliminary. Covering the dish prevents evaporation (which would change agar concentration) and airborne contamination.
-
Incubation at one constant temperature for one constant time — e.g. for 48 h — is essential because amylase activity is temperature- and time-dependent. A thermostatically controlled incubator / water bath guarantees this.
-
Iodine test and measurement: iodine stains residual starch blue / black; digested areas appear brown / clear. To measure the area accurately, trace each zone onto a grid (or photograph and overlay a grid) and count squares; or measure the diameter with a ruler / callipers and use . Calculate a mean for each concentration.
-
Replicates: at least 3 dishes per concentration allows a mean and the identification of anomalies (results that differ markedly from the others).
-
Standardising variables ensures the only systematic difference between dishes is the GA concentration. Anything that could vary — number of grains, soaking volume, agar composition, temperature, time — must be specified and held constant.
-
Safety: cutting on a tile, blade pointing away from hands, prevents cuts. If a student is allergic to maize, gloves and / or a mask are appropriate.
Key Takeaways
- Test a hypothesis by varying one variable (GA concentration) while keeping all others constant.
- Include a water control to provide a baseline.
- Use serial dilution to obtain a range of concentrations efficiently and accurately.
- Standardise every other variable: number of grains, volume of solution, agar composition, incubation time and temperature.
- Replicate (minimum 3 dishes per concentration) to obtain a mean and identify anomalies.
- Choose safe and ethical procedures.
Common Mistakes
- Forgetting the water control — without it, you cannot tell whether GA has any effect compared with no GA.
- Using only one GA concentration — you cannot test "the greater the concentration, the greater the activity" with a single value.
- Not stating the incubation temperature or time — both must be a specific value within the accepted range (–; 24–72 h).
- Not specifying the number of grains or volume of soaking solution.
- Saying "take more readings" without specifying at least 3 replicates per concentration.
- Confusing safety points (e.g. saying "no risk" is rejected; vague statements about gloves are also rejected).
Things to Be Careful About
- The original GA solution is , much higher than the natural range of – given in the stem. Use the unit that matches the stock () when describing the dilutions.
- The mark scheme accepts any incubation temperature in the range – (including "room temperature"), but explicitly rejects (body temperature).
- The mark scheme ignores "gloves for cutting" but accepts gloves when paired with allergy / irritation. Safety marks require a specific precaution, not a blanket "low risk" or "no risk".
- Replicates must be a minimum of 3 data sets per concentration (the original plus at least 2 more). "Several" or "many" alone is not enough.
- The mark scheme ignores any time stated between soaking and placing the maize on the agar plate, so do not waste words on this.
The students decided to plot a graph of their results.
Suggest labels, including units, for the axes of this graph.
-axis = ______
-axis = ______
Answer
-axis = concentration of GA / (or )
-axis = (mean) area of clear zone / starch digested /
x-axis: concentration of GA (mmol dm⁻³ or μmol dm⁻³); y-axis: (mean) area of clear zone / starch digested (mm²)
Background Concept
When drawing a graph of experimental results, the convention is:
- The independent variable (what was varied) is plotted on the -axis (horizontal).
- The dependent variable (what was measured) is plotted on the -axis (vertical).
- Each axis must be labelled with the quantity and its unit.
In this question, the IV is the concentration of GA, and the DV is the (mean) area of the starch-free / brown zone around the grain halves — an indirect estimate of amylase activity.
Understanding the Question
The students will plot their results from the main investigation. The question asks for appropriate labels, with units, for both axes.
Approach
Identify the IV and DV (already done in (a)(i)) and write the labels with appropriate units:
- For concentration, the stock is in , so this unit is the natural choice; is also accepted because both are valid SI-derived concentration units.
- For area, the brown zones are small, so is the most appropriate unit; is also accepted.
Step-by-Step Reasoning
- -axis = concentration of GA / (or ).
- -axis = (mean) area of clear zone / starch digested / .
The mark scheme awards 2 marks: 1 for correct labels and 1 for correct units. It accepts alternative measurements for the -axis (e.g. diameter in mm, or "activity of amylase" with arbitrary units / au) and alternative area units (cm²). However, units must match the labels — incorrect or missing units reduce the mark to a maximum of 1. Reversed axes that are otherwise correctly labelled and unit-ed still earn a maximum of 1 mark.
Key Takeaways
- IV on -axis, DV on -axis.
- Always include units in axis labels.
- Choose the most appropriate unit for the data being measured.
Common Mistakes
- Reversing the axes (DV on , IV on ) — only 1 mark is awarded even if labels and units are correct.
- Forgetting the units — only 1 mark awarded.
- Using units that don't match the label (e.g. "mm" for area instead of "mm²").
Things to Be Careful About
- Unit formats accepted by the mark scheme include , , , , , .
- The unit must match the quantity — area is measured in square units (mm², cm²), diameter in mm.
The students thought that the area stained brown was proportional to the activity of the amylase.
Suggest three limitations of using this way to estimate amylase activity.
-
______
-
______
-
______
Answer
-
The brown zones are irregular in shape / have different diameters, so the area is difficult to measure accurately.
-
The edges of the brown zones are difficult to see clearly (e.g. blurred between the brown and blue regions of the agar), making the boundary hard to trace.
-
Amylase may also come from contaminating microorganisms (e.g. fungi or bacteria on the grain surface) or from the embryo itself, so the size of the brown zone does not reflect only the GA-induced amylase from the aleurone layer.
- Irregular zone shape / different diameters makes area measurement inaccurate; 2. zone edges difficult to see (blurred); 3. contaminating microorganisms / the embryo may also produce amylase.
Background Concept
A "limitation" of a method is any factor that prevents the method from giving an accurate, precise or valid result. Common categories include:
- Measurement errors: difficulty in obtaining accurate measurements (e.g. irregular shapes, unclear boundaries).
- Biological variables: uncontrolled biological factors that affect the result.
- Confounding factors: other things that could produce a similar effect (e.g. other enzymes, contamination).
- Quantification issues: methods that don't give reliable numerical data.
Understanding the Question
The students are using the area of the brown / starch-digested zone around cut maize grains on starch agar as an indirect estimate of amylase activity. The question asks for three specific limitations of this estimation method.
Approach
Think about all the ways this estimation could be inaccurate or misleading:
- Can the zone area be measured accurately?
- Is the brown zone only due to amylase from the GA-treated aleurone layer?
- Are there other enzymes or contaminants that could hydrolyse starch?
- Does the area tell you how much amylase is present, or just that some is present?
- Does the area tell you about the amount of starch digested, or just whether starch is present?
- Could conditions (e.g. pH) vary between dishes?
Step-by-Step Reasoning
Choose three specific, credible limitations from the mark scheme list:
-
Areas are irregular in shape / have different diameters. This makes it difficult to measure the area accurately with a ruler or simple method, and introduces uncertainty into the result.
(Mark scheme point 1) -
Edges of the brown zones are difficult to see clearly — e.g. blurred between the brown (digested) and blue (stained) regions. This introduces uncertainty in tracing the boundary and therefore in measuring the area.
(Mark scheme point 2) -
Amylase may come from contaminating microorganisms (fungi, bacteria on the grain surface) or from the embryo itself, giving a falsely high estimate of amylase activity that is not due to GA acting on the aleurone layer.
(Mark scheme points 3 / 4 / 6)
Other valid limitations from the mark scheme include:
- The test is qualitative (yes / no starch present) rather than quantitative (how much starch is left).
- pH of the agar may vary between dishes and affect amylase activity.
- Different grains may have different surface areas exposed after cutting, releasing different amounts of amylase.
Key Takeaways
- Limitations should be specific to this method, not generic complaints like "human error" or "not very accurate".
- A good limitation names the specific issue and why it matters for the measurement.
- Limitations can be about measurement, biology, or quantification.
Common Mistakes
- Vague answers like "human error", "not very accurate", "could be improved" — these don't score.
- Stating a limitation without explaining why it matters (e.g. just saying "irregular shapes" without saying it makes measurement difficult).
- Repeating the same limitation in different words.
- Listing a limitation about replicates / reliability — this addresses repeatability, not the validity of the measurement, and the mark scheme ignores it.
Things to Be Careful About
- The mark scheme rewards specific, biology-based limitations, not generic ones.
- Each of the three chosen limitations should be from a different angle (measurement / observation / biology) where possible, to show breadth of critical analysis.
- The mark scheme explicitly rejects "replicates / repeats" as a limitation here — it is a separate issue handled in (a)(ii).
For one of these limitations, suggest how the estimation of amylase activity could be improved.
Answer
Sterilise the surface of the maize grains with a disinfectant (e.g. 1% sodium hypochlorite, or 70% ethanol) for 1–2 minutes before cutting, and prepare the starch agar using aseptic technique (e.g. autoclave the agar and work near a Bunsen flame). This prevents amylase released by contaminating fungi or bacteria on the grain surface from contributing to the brown zone, so the zone size reflects only amylase produced by the GA-treated aleurone layer.
Sterilise grains (e.g. 1% sodium hypochlorite) before cutting and prepare agar aseptically (e.g. autoclave) to remove amylase from contaminating microorganisms.
Background Concept
An improvement to a method should directly address one specific limitation. A good improvement is:
- Specific: it explains exactly what to do.
- Practical: it can be implemented in a school or college laboratory.
- Addressable: it directly tackles the chosen limitation.
The mark scheme awards 2 marks for the improvement: 1 for the general idea and 1 for a specific detail or method.
Understanding the Question
The question asks for one improvement to the method of estimating amylase activity, addressing one of the three limitations named in (c)(i). The improvement can earn up to 2 marks.
Approach
Pick one limitation from (c)(i) and design a specific, practical improvement with two parts:
- The general idea of the improvement.
- A specific detail of how to carry it out.
Step-by-Step Reasoning
Chosen limitation: amylase from contaminating microorganisms (fungi, bacteria on the grain surface) may give a falsely high estimate of amylase activity.
Improvement:
- General idea: sterilise / disinfect the grain surface (and / or the agar) so that contaminating microorganisms cannot contribute amylase.
- Specific detail: soak the grains in 1% sodium hypochlorite (or 70% ethanol) for 1–2 minutes before cutting, and prepare the starch agar using aseptic technique — e.g. autoclave the agar at for 15 minutes and pour plates near a Bunsen flame. Keep the Petri dishes covered throughout to prevent airborne contamination.
This prevents microbial amylase from contributing to the brown zone, so the zone size reflects only amylase produced by the GA-treated aleurone layer.
Alternative valid improvements from the mark scheme:
- Use a transparent grid / graticule to measure the area more accurately — addresses the irregular-shape or unclear-edge limitation. (e.g. trace the zone onto a grid and count squares; or photograph and use image-analysis software.)
- Separate the embryo from the grain before placing on the agar, so only the aleurone-layer amylase is measured — addresses the embryo-producing-amylase limitation.
- Use a buffer to make up the agar plates — addresses the pH-variation limitation.
- Produce a calibration curve using known concentrations of amylase on starch agar, then read off the activity of the unknown — addresses the qualitative-not-quantitative limitation.
Key Takeaways
- Improvements must be specific and detailed (two clear ideas for 2 marks).
- Improvements must directly address the chosen limitation, not a different one.
- For aseptic / sterilisation improvements, the mark scheme requires both the idea (sterilise / disinfect) and a specific detail (named disinfectant or sterile technique).
Common Mistakes
- Vague improvements like "be more careful" or "use better equipment" — these don't score.
- Suggesting an improvement that doesn't actually address the chosen limitation.
- Giving only the general idea without the detail (e.g. "sterilise" without saying what disinfectant or how).
- Repeating the limitation as the answer instead of proposing the improvement.
Things to Be Careful About
- The mark scheme explicitly rejects "gloves for cutting" as an improvement here — gloves are a safety point, not a way of improving the measurement of amylase activity.
- The improvement must be relevant to the limitation chosen in (c)(i), not a different one.
- For blur / unclear-edge limitations, the mark scheme allows "really cannot be improved" for 2 marks if no valid improvement exists — but a grid / graticule is the standard improvement offered.
The rest of this paper
1 more questions- Q2Analysis, Conclusions and Evaluation · Planning12M