Biology 9700/53 — October/November 2012
Cambridge A-Level · Planning, Analysis and Evaluation · worked solutions for every part, with the mark scheme
Topics Planning · Analysis, Conclusions and Evaluation
The single-celled alga Chlorella is common in polluted waters and is used in sewage lagoons to reduce the nitrate content of the water.
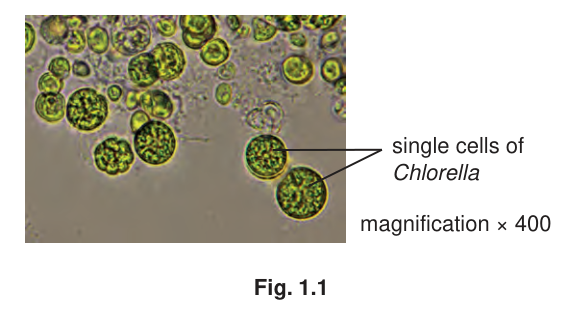
Fig. 1.1 shows cells of Chlorella viewed with a light microscope using high power.
A student investigated the effect of different concentrations of nitrate on the population growth of a species of Chlorella. The student used sodium nitrate in the investigation.
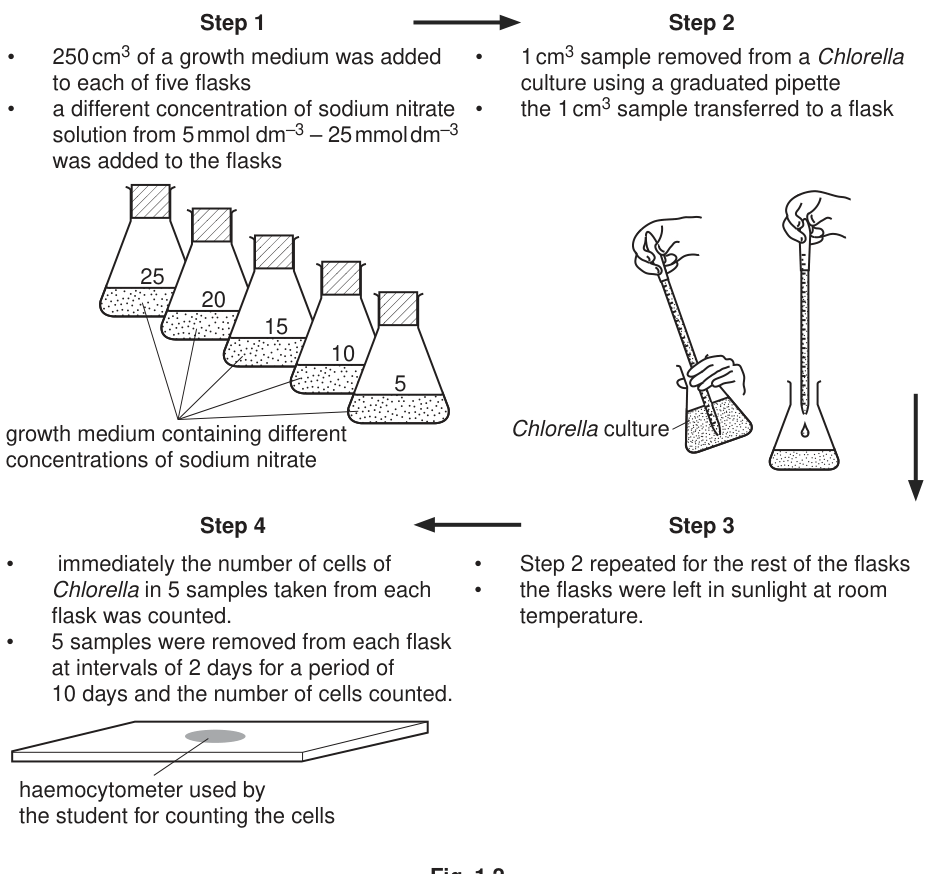
Fig. 1.2 shows the main steps in the procedure.
Identify the independent and dependent variables in this investigation.
independent ______
dependent ______
Answer
Independent: (sodium) nitrate concentration
Dependent: number of (Chlorella) cells
Independent: (sodium) nitrate concentration; Dependent: number of (Chlorella) cells
Background Concept
Every controlled investigation involves three types of variable. The independent variable is the factor the experimenter deliberately changes between treatments (here, between flasks). The dependent variable is the factor that is measured to detect the effect of that change. All other variables must be kept constant (controlled) so that any difference in the dependent variable can be attributed to the independent variable rather than to some other changing factor.
In this investigation the student is interested in how nitrate (a plant nutrient) affects the population growth of Chlorella. The cells need nitrate to make amino acids, proteins and nucleic acids, so a change in nitrate availability is expected to change how fast the population grows.
Understanding the Question
The stem (from the question) describes a student who set up five flasks containing different concentrations of sodium nitrate (5, 10, 15, 20 and 25 ) and then counted the Chlorella cells in each flask every two days for ten days using a haemocytometer. Part (a)(i) simply asks you to name the independent and dependent variables in this investigation.
Approach
Look at the description in Fig. 1.2: identify the factor that was deliberately varied (the independent variable) and the factor that was measured and recorded (the dependent variable).
Step-by-Step Reasoning
- Independent variable — the factor the student deliberately changed between flasks. From Fig. 1.2, this is the concentration of sodium nitrate (5, 10, 15, 20, 25 ).
- Dependent variable — the factor the student measured to see the effect. From Table 1.1 and the haemocytometer step in Fig. 1.2, this is the number of Chlorella cells (per of culture).
Mark scheme note: the words 'amount' and 'frequency' are rejected for the dependent variable, and the words 'growth' and 'population growth' are ignored (because the data table records actual cell counts, not a derived 'growth' figure). The precise, mark-scheme-aligned term is 'number of cells'.
Key Takeaways
- Independent = what is varied by the experimenter.
- Dependent = what is measured to detect the effect of that variation.
- Use the precise term 'number of cells' rather than 'growth', 'amount' or 'population growth'.
Common Mistakes
- Writing 'amount of nitrate' instead of 'concentration of nitrate' — the mark scheme requires the word concentration.
- Writing 'population growth' or 'amount of Chlorella' for the dependent variable — both are rejected; the precise term is 'number of cells'.
- Confusing independent and dependent — the independent variable is on the x-axis of a results graph, and the dependent variable is on the y-axis.
Things to Be Careful About
The mark scheme explicitly REJECTS 'amount' and IGNORES 'growth' / 'population growth' for the dependent variable. Stick to the literal data: 'number of cells'.
Identify two variables that the student has controlled in this investigation as shown in Fig. 1.2.
Answer
Two variables the student has controlled (kept the same for every flask):
- Volume of growth medium in each flask ().
- Volume of Chlorella culture added to each flask ().
(Other acceptable answers from the mark scheme: same source of Chlorella culture; time of investigation / time of sampling — every 2 days for 10 days; size of flask; (room) temperature; (sun)light.)
Any two from: volume of growth medium; volume of Chlorella culture added; source of Chlorella culture; time of sampling; size of flask; temperature; light.
Background Concept
A controlled variable is any factor that is kept the same for every treatment in an investigation. Holding these constant ensures that the only meaningful difference between treatments is the independent variable, so any difference observed in the dependent variable can fairly be attributed to that independent variable.
The procedure in Fig. 1.2 has been deliberately written so that the only factor that changes from flask to flask is the concentration of sodium nitrate. Every other quantity mentioned in the procedure is therefore a controlled variable.
Understanding the Question
Part (a)(ii) asks you to look at Fig. 1.2 and pick out two factors that the student has already kept constant. The phrase 'as shown in Fig. 1.2' is important: you are restricted to factors that are visible in the diagram, not factors you think should have been controlled.
Approach
Read each numbered step in Fig. 1.2 and ask: 'Is this quantity different between flasks, or the same?' Anything the same is a controlled variable. Pick the two that are most clearly stated.
Step-by-Step Reasoning
Going through Fig. 1.2 step by step:
- Step 1: of growth medium in each of five flasks — the volume of growth medium is the same.
- Step 1: different concentrations of sodium nitrate — this is the independent variable, not a control.
- Step 2: of Chlorella culture is added to each flask using a graduated pipette — the volume of Chlorella culture is the same, and the source of culture (one stock culture) is the same.
- Step 3: flasks are left in sunlight at room temperature — light and (room) temperature are kept the same.
- Step 4: cells are counted immediately, then every 2 days for 10 days — the time of sampling is the same for all flasks.
- The diagram shows five identical conical flasks — the size (and type) of flask is the same.
The mark scheme accepts any two of: source of culture, time of investigation/sampling, volume of growth medium, volume of culture, size of flask, temperature, light.
Key Takeaways
- 'Controlled' means 'kept the same in every treatment'.
- The procedure diagram is the place to look for these.
- The most quantitative, easiest-to-credit answers are volumes and times.
Common Mistakes
- Naming the independent variable (nitrate concentration) as a control — it is the variable being changed, so it is the opposite of controlled.
- Naming vague factors like 'the experimenter' or 'the lab' — these are not biological/physical variables.
- Writing 'amount' or 'quantity' instead of a precise quantity with a unit — the mark scheme ignores 'amount/quantity' and accepts only the quantity with a unit (e.g. , , every 2 days).
Things to Be Careful About
The mark scheme only credits the first two suggestions you write. Write your two strongest answers first. Also, give the quantity rather than the vague word 'amount' or 'quantity' — ' of growth medium' is far safer than 'the same amount of medium'.
There are other variables that the student could have controlled in this investigation.
Describe how two other variables could have been controlled.
Answer
Variable 1: light
Use a lamp of fixed wattage at a fixed distance from each flask, switched on for a fixed duration each day (e.g. 12 h).
Variable 2: temperature
Place all the flasks in a thermostatically controlled water bath (or incubator) set to a constant temperature (e.g. ).
(Other acceptable variable–method pairs from the mark scheme: pH — add a buffer; aeration/oxygen — bubble air through each flask using a pump; carbon dioxide — add sodium hydrogen carbonate or bubble from a cylinder; even cell density — swirl the Chlorella culture before removing the sample; maintain nitrate concentration — replace the medium at fixed intervals; method of counting — systematic counting of grid squares on the haemocytometer.)
Two variable–method pairs such as: light – fixed-wattage lamp at fixed distance; temperature – thermostatically controlled water bath.
Background Concept
A fair test requires that every variable other than the independent variable is held constant. For a culture of photosynthetic single-celled algae such as Chlorella, growth is influenced by many factors besides nitrate: light (intensity, wavelength and daily duration), temperature, pH of the medium, dissolved oxygen, dissolved , and the even distribution of cells in the culture when each flask is inoculated.
The mark scheme for this part is in the format '2 × 2': two marking points for each variable, one for naming it and one for describing a valid method of standardising it. The variable and its method must be clearly linked.
Understanding the Question
Part (a)(iii) asks you to describe how two other variables could be controlled — i.e. variables that are not among the ones already credited in (a)(ii). The 'method' part of each answer must be specific enough that someone else could carry it out.
Approach
For each variable you choose, state (1) what the variable is and (2) exactly how the student would keep it the same for every flask. Link the method to the variable explicitly.
Step-by-Step Reasoning
The mark scheme lists nine possible variable–method pairs. Two that are easy to credit well:
- Light — Chlorella photosynthesises, so light intensity, wavelength and daily duration all affect growth. Control by using a lamp of fixed wattage, at a fixed distance from every flask, switched on for a fixed number of hours per day (e.g. 12 h light / 12 h dark). Mark scheme accepts 'filter of known wavelength', 'same wattage bulb', 'lamp at fixed distance' or 'stated fixed duration'.
- Temperature — enzyme-catalysed reactions in the cell (and the rate of diffusion of nutrients) depend on temperature. Control by placing all flasks in a thermostatically controlled water bath or incubator set to a constant temperature (e.g. ). The mark scheme accepts 'temperature-controlled room', 'thermostatically controlled water bath' or 'incubator'.
Other valid pairs (any two would do):
- pH — add a buffer to the growth medium. (Reject 'phosphate buffer', 'add ' or 'add ' from the mark scheme.)
- Aeration / oxygen — bubble air (or ) through each flask using a small pump or air stone, at the same rate. The mark scheme accepts 'pump / oxygen cylinder / bubbler / diffuser / air lift / bubbling of air or oxygen'.
- Carbon dioxide — add sodium hydrogen carbonate () to the medium, or bubble from a cylinder at a fixed rate. The mark scheme accepts 'bicarbonate' but rejects 'carbonate'.
- Even cell density — swirl or stir the Chlorella stock culture immediately before removing the sample, so that each flask receives a representative number of cells.
- Maintaining nitrate concentration — replace the medium at fixed intervals (e.g. every 48 h), so that the cells do not deplete the nitrate and change the independent variable during the experiment.
- Counting method — use a systematic procedure on the haemocytometer (e.g. always count the same five large squares) so that every count is comparable.
A common error is to give a method that could not actually be carried out, or to describe a method without saying which variable it controls. Both variable and method are needed, and they must be linked.
Key Takeaways
- Name the variable and give a workable standardisation method.
- Link the two — 'temperature, controlled by a thermostatically water bath' not 'a water bath' alone.
- Do not repeat factors already credited in (a)(ii).
Common Mistakes
- Naming a variable already credited in (a)(ii) (e.g. light or temperature if you put them in (a)(ii)) — the mark scheme restricts the (a)(iii) credit to factors not already mentioned, except for counting method.
- Giving a vague method — 'control the temperature' is not enough; 'place all flasks in a thermostatically controlled water bath at ' is.
- Suggesting 'phosphate buffer' to control pH — the mark scheme specifically rejects this because phosphate would interfere with the independent variable in part (f).
Things to Be Careful About
The mark scheme says 'Identifying a variable must be free standing, method must be linked to the variable'. A standalone 'use a buffer' with no variable named scores nothing; 'pH — add a buffer to the medium' scores both marks for that variable.
The student used solid sodium nitrate to prepare the highest concentration of sodium nitrate solution shown in Fig. 1.2 (). This concentration was then used to prepare all the other concentrations.
Describe the procedure that the student used to prepare the concentrations shown in Fig. 1.2. Your description should be sufficiently detailed so that another person can easily follow your procedure.
The molar mass of sodium nitrate is .
Working
Answer
- Weigh of solid sodium nitrate using a balance.
- Dissolve the solid in of deionised water; stir to make a stock solution.
- Prepare the other concentrations by mixing measured volumes of this stock with deionised water (stir after each):
- — 1 part stock + 4 parts water
- — 2 parts stock + 3 parts water
- — 3 parts stock + 2 parts water
- — 4 parts stock + 1 part water
- Use a graduated pipette / measuring cylinder for accurate volumes and stir each dilution thoroughly before use.
Weigh 2.125 g of solid sodium nitrate, dissolve in 1 dm³ of deionised water to give a 25 mmol dm⁻³ stock, then dilute proportionally (stock:water = 1:4, 2:3, 3:2, 4:1) to give 5, 10, 15 and 20 mmol dm⁻³.
Background Concept
A solution of a given molarity is prepared by dissolving a known mass of solute in a known volume of solvent. The relationship is:
Once a single concentrated 'stock' solution has been made, lower concentrations are obtained by dilution: mixing a measured volume of the stock with a measured volume of water. For two solutions of the same solute, the dilution equation is:
where and are the concentration and volume taken from the stock, and and are the concentration and total volume of the dilution.
Understanding the Question
The student must (a) make up the highest-concentration solution () from solid sodium nitrate, and (b) use that to make the other four concentrations (5, 10, 15 and ). The description must be detailed enough that another person could follow it.
Approach
Work in two stages: (1) calculate and weigh the mass needed for the stock; (2) describe the proportional dilutions to give the lower concentrations. Show the calculation, then the practical steps.
Step-by-Step Reasoning
Stage 1 — the stock.
.
For of this solution:
So weigh of solid , dissolve it in (and make up to) of deionised water, and stir.
Stage 2 — the lower concentrations (proportional dilutions).
The mark scheme wants the ratios of stock : water (or water : stock) for each of 5, 10, 15 and in the order shown in Fig. 1.2. Because each lower concentration is a simple fraction of 25, the dilution can be done by mixing stock and water in the corresponding ratio (e.g. 1 part stock + 4 parts water gives 1/5 of 25 = ):
| Target concentration | Stock : water ratio | Example volumes (out of 250 cm³) |
|---|---|---|
| 1 : 4 | stock + water | |
| 2 : 3 | stock + water | |
| 3 : 2 | stock + water | |
| 4 : 1 | stock + water |
The mark scheme's notation '4 : 1, 3 : 2, 2 : 3, 1 : 4' refers to the water : stock ratios for the 5, 10, 15 and 20 series. Use a graduated pipette or measuring cylinder for each volume and stir / swirl each dilution thoroughly.
Key Takeaways
- is the workhorse calculation for solution preparation.
- Make one stock, then dilute proportionally to save time and weighing errors.
- Always use deionised / distilled water to avoid contaminating the medium.
Common Mistakes
- Forgetting to convert mmol dm⁻³ into mol dm⁻³ — the calculation gives 0.025, not 25.
- Using tap water — ions in tap water can contaminate the medium and affect the growth of Chlorella.
- Saying 'mix' without saying how — the mark scheme rejects 'mix' unqualified and accepts only 'stir', 'swirl', 'mix thoroughly' or 'mix with a glass rod'.
- Omitting the actual dilution ratios — the mark scheme requires the 1:4, 2:3, 3:2, 4:1 series to be visible in the answer.
Things to Be Careful About
The mark scheme accepts 'rounding of decimal places' (so 2.13 g is fine) and 'volumetric flask' for the make-up. It rejects 'serial dilution' (because that is a different technique involving repeated ten-fold dilutions) and 'mix' on its own. Always quote the type of water (deionised / distilled) and the method of mixing (stir, swirl, glass rod).
The student also prepared another flask to use as a control.
Suggest a suitable solution to use as a control for this investigation.
Answer
A flask containing only growth medium, with deionised water added in place of the (sodium) nitrate solution.
A flask containing growth medium plus water (in place of the sodium nitrate solution).
Background Concept
A control in a controlled investigation is a treatment in which the independent variable is absent (or held at a standard value), so that the 'baseline' level of the dependent variable can be measured. Without a control, it is impossible to tell whether any change seen in the experimental flasks is genuinely due to the independent variable, or would have happened anyway.
In a nutrient experiment there are two common controls:
- A negative control with no nutrient added (here, no nitrate).
- A positive control with a known effective amount of nutrient.
For this investigation the mark scheme requires the negative-control idea: nitrate is replaced by water, so the only difference between this flask and the experimental flasks is the absence of nitrate.
Understanding the Question
Part (b)(ii) asks for a 'suitable solution' to use as a control. This must be a single solution (or flask) that allows the student to compare the nitrate-containing flasks against a nitrate-free baseline. The growth medium itself is still required (because the cells need other nutrients to live), but the sodium nitrate is removed and replaced by water.
Approach
Replace the variable being tested (sodium nitrate) with the solvent (deionised water) while keeping everything else the same.
Step-by-Step Reasoning
- The independent variable is sodium nitrate concentration.
- A control must remove this variable while keeping the growth medium otherwise identical.
- So: take of growth medium and add deionised water in place of the sodium nitrate solution used for the experimental flasks.
- Inoculate with of the same Chlorella culture, leave in the same conditions, and count cells in the same way.
The mark scheme accepts 'a flask containing only growth medium and water' or 'a flask with water added in place of (sodium) nitrate (solution)'. The key idea is that nitrate is being replaced by water.
Key Takeaways
- A control replaces the independent variable with the solvent/standard treatment.
- For a nutrient study, the negative control is a flask with no nutrient but otherwise identical conditions.
- The control allows the student to say whether the growth seen in the experimental flasks is actually due to the nitrate, not to the growth medium or the cells themselves.
Common Mistakes
- Suggesting 'distilled water alone' as the control — this would not support Chlorella growth because the cells need the other nutrients in the growth medium.
- Adding a different amount of water to the control than to the other flasks — this would introduce a new variable.
- Using 'no flask' as the control — a control must still be a treated flask measured in the same way as the experimentals.
Things to Be Careful About
The control must differ from the experimental flasks only in the independent variable. Everything else — the volume of growth medium, the volume of culture, the flask, the light, the temperature — must be identical.
The results of the student’s investigation are shown in Table 1.1.
Table 1.1
| concentration of sodium nitrate / | mean number of cells in at the start | mean percentage increase in number of cells of Chlorella | ||||
|---|---|---|---|---|---|---|
| day 2 | day 4 | day 6 | day 8 | day 10 | ||
| control | 10035 | 1 | 2 | 2 | 2 | 2 |
| 5 | 10630 | 40 | 75 | 140 | 175 | 220 |
| 10 | 10128 | 50 | 105 | 160 | 230 | 285 |
| 15 | 10743 | 75 | 135 | 210 | 292 | 360 |
| 20 | 10108 | 65 | 125 | 195 | 280 | 330 |
| 25 | 10900 | 55 | 110 | 170 | 250 | 300 |
State how the mean percentage increase in number of cells was calculated.
Answer
- For each flask, calculate the mean number of cells in the 5 haemocytometer samples (i.e. the mean of the 5 counts on the same day for the same flask).
- Find the difference between this new mean and the mean number of cells at the start (day 0):
- Divide the increase by the mean original count and multiply by 100:
percentage increase = ((mean new count − mean original count) / mean original count) × 100
Background Concept
A percentage increase expresses a change as a proportion of the starting value, multiplied by 100. It is the standard way of comparing the growth of two populations that started at different sizes: a culture that grew from 100 to 200 cells has increased by 100 %, while a culture that grew from 10 000 to 12 000 cells has increased by only 20 %, even though the absolute increase of 2000 is much larger.
The calculation always has the same three parts:
- A representative value for the final (new) measurement — here, the mean of the 5 haemocytometer samples on a given day.
- A representative value for the starting measurement — here, the mean of the 5 samples on day 0 (the 'mean number of cells in at the start' column in Table 1.1).
- The percentage formula:
The subtraction must be the right way round (new minus original) so that a positive answer represents an increase.
Understanding the Question
Table 1.1 records, for each flask, the 'mean number of cells in at the start' and then the 'mean percentage increase in number of cells of Chlorella' on days 2, 4, 6, 8 and 10. Part (c)(i) asks you to state how that percentage increase was obtained from the raw haemocytometer counts. The mark scheme gives three marks: one for finding the means, one for finding the difference, and one for dividing by the original and multiplying by 100.
Approach
Walk through the procedure in three clear steps, and finish with the formula.
Step-by-Step Reasoning
- Find the mean of the 5 haemocytometer samples for each flask on each day. The student took 5 samples per flask; the mean is the sum of the 5 counts divided by 5. The table already shows this mean (under 'mean number of cells in at the start' and is implied for the later days).
- Find the difference between the new (later) mean and the original (day 0) mean for that flask.
- Divide that difference by the original (day 0) mean and multiply by 100, to express the change as a percentage of the starting value.
The final formula is:
The mark scheme accepts the formula in words or in symbols, and allows 'average' for 'mean'. It applies error carried forward (ecf) if the candidate's earlier work is wrong.
Key Takeaways
- Always average repeated measurements before processing.
- Percentage change is always: (new − original) / original × 100.
- The direction of subtraction matters: new minus original gives a positive number for an increase.
Common Mistakes
- Forgetting to take the mean of the 5 samples first — using a single sample as the 'new' value inflates the uncertainty.
- Dividing by the new value instead of the original — that is percentage decrease relative to the new value, not percentage increase.
- Subtracting the wrong way round (original − new) — this gives a negative number for an increase.
- Multiplying the answer by 1000 instead of 100 (confusing percentage with parts per thousand).
Things to Be Careful About
The mark scheme says 'subtraction must be correct way round if shown' and 'A original described in terms of the control' — so the formula can equivalently use 'control' as the original value, but only if the candidate has set up a control in the same units.
Suggest why the student calculated the mean percentage increase in numbers of Chlorella.
Answer
The starting numbers of cells in each flask were slightly different (e.g. between about 10 000 and 11 000). Converting the increase to a percentage makes it easier to compare the growth of cultures that started with different numbers of cells.
The starting cell numbers in each flask differ, so using a percentage makes the growth of the different cultures easier to compare.
Background Concept
When comparing populations that started at different sizes, raw differences are misleading and percentage change normalises the comparison. For example, an increase of 2000 cells means a great deal in a flask that started with 5000 cells (40 % increase) but very little in a flask that started with 50 000 cells (4 % increase). Percentage removes the effect of the different starting values.
Understanding the Question
Part (c)(ii) asks for the reason the student went to the trouble of computing a percentage increase rather than simply reporting the raw increase in cell number.
Approach
Look at the 'mean number of cells in at the start' column of Table 1.1: the values are 10035, 10630, 10128, 10743, 10108 and 10900. They are not identical. Any comparison of growth has to take that variation into account.
Step-by-Step Reasoning
- Each flask was inoculated with of Chlorella culture, but the number of cells in that was slightly different in every case because the original culture is not perfectly uniform.
- If the student simply reported 'number of cells on day 10', a flask that started with more cells would look like it had grown more, even if its cells had actually grown more slowly in proportion.
- By converting to a percentage increase, the student puts every flask on the same scale: 100 % means the number of cells has doubled, regardless of the starting value.
- This makes a fair comparison possible between flasks that had different starting cell numbers.
The mark scheme accepts 'easier to make comparisons between different samples / different starting numbers', and also 'differences easier to see / cell numbers harder to compare'.
Key Takeaways
- Percentage change is the right tool when starting values differ.
- It normalises the comparison so every flask can be compared on the same scale.
Common Mistakes
- Saying 'to make the numbers smaller' or 'to make the data easier to write down' — these are not the biological reason.
- Saying 'to make the data more accurate' — taking a percentage does not improve accuracy; the means and original counts still have to be accurate.
- Confusing percentage increase with absolute increase — the candidate should make clear why a percentage is used, not just describe what it is.
Things to Be Careful About
The mark scheme is short (1 mark) and rewards the idea of comparison between samples with different starting numbers. The candidate does not need to mention statistics, just the idea that the starting numbers were different and the percentage removes that difference.
State what conclusions can be drawn from the results in Table 1.1 about the effect of different concentrations of nitrate on the growth of Chlorella.
Answer
- All concentrations of sodium nitrate tested (5 to ) gave a much greater percentage increase in Chlorella cell number than the control (no nitrate), so some nitrate is required for growth.
- As nitrate concentration increases from 5 to , the percentage increase in cell number rises (e.g. from 220 % at to 360 % at on day 10).
- Above the rate of increase slows down: at the day-10 value is 330 % and at it is 300 %, both lower than at . The optimum nitrate concentration for the growth of this Chlorella lies between 10 and (and from these data, around ).
Nitrate increases growth compared to the control; growth rises with nitrate up to 15 mmol dm⁻³, then slows between 20 and 25 mmol dm⁻³, giving an optimum between 10 and 20 mmol dm⁻³ (around 15 mmol dm⁻³).
Background Concept
Nitrate is a key plant nutrient: cells use it to make amino groups for amino acids, proteins, nucleic acids and chlorophyll. Without nitrate, Chlorella cannot grow. With too little, growth is limited. As nitrate concentration increases, growth typically rises until some other factor (light, , or the cell's own ability to take up and use nitrate) becomes limiting — at which point the curve plateaus. At very high concentrations, the dissolved nitrate can lower the water potential of the medium enough to cause osmotic loss of water from the cells, which can reduce growth.
Understanding the Question
Table 1.1 shows, for each of six flasks (control plus five nitrate concentrations), the starting cell count and the mean percentage increase on days 2, 4, 6, 8 and 10. Part (d) asks for the conclusions that can be drawn about the effect of nitrate on growth — three marks are available, so the answer should make three distinct, evidence-based points.
Approach
Read across the table looking for (1) the difference between the control and the experimental flasks, (2) the trend as nitrate concentration increases, and (3) any change in the trend (optimum, plateau, or decline).
Step-by-Step Reasoning
- Control vs. experimental. The control flask (no nitrate) shows only 2 % increase on every day, compared with at least 40 % in the lowest-nitrate flask (5 ) and 220 % in the same flask by day 10. Conclusion: nitrate is needed for Chlorella growth.
- Trend at low concentrations. Looking at the day-10 column: 5 → 220 %, 10 → 285 %, 15 → 360 %. The percentage increase rises as nitrate concentration increases. This is the typical 'limiting nutrient' response.
- Change above 15 . At 20 the day-10 value drops to 330 %, and at 25 it drops further to 300 %. The rate of increase is slowing, indicating that 15 is at or near the optimum and additional nitrate is no longer beneficial (or is starting to reduce growth).
- Optimum. Combining the trend at low nitrate with the slowdown at high nitrate, the optimum concentration lies between 10 and 20 (the data suggest around 15 ).
The mark scheme accepts any three of these four points, and also accepts biological explanations such as 'more nitrate allows more protein/DNA to be made' or 'high nitrate reduces the water potential of the solution so the cells lose water'.
Key Takeaways
- A conclusion must be supported by a trend in the data, not a single value.
- Three things to look for in a 'concentration' experiment: effect compared to a control, the trend as concentration increases, and any plateau or decline at high concentration.
- Quantitative support (e.g. quoting the day-10 value at 15 = 360 %) makes a conclusion more convincing.
Common Mistakes
- Citing individual data points without seeing the overall trend.
- Stating that 'more nitrate always means more growth' — the table shows a clear slowdown above 15 .
- Failing to mention the control — without this, the conclusion that nitrate is required is missing.
- Confusing the optimum concentration with the maximum tested concentration. The optimum is where growth is highest; the highest concentration tested is not necessarily the optimum.
Things to Be Careful About
The mark scheme says: 'If no mention of figures for nitrate concentration, allow max 1 for a general statement giving idea that as nitrate increases the cell % increase increases up to a point above which the rate decreases.' So it is best to quote specific concentrations (5, 10, 15, 20, 25 ) and the corresponding day-10 values to back up the conclusion. The wrong unit (e.g. 'mol dm⁻³' instead of 'mmol dm⁻³') is penalised once and then carried forward as ecf.
Suggest how the student’s investigation should be modified to find the optimum nitrate concentration for the growth of this Chlorella.
Answer
Repeat the investigation using more concentrations at smaller intervals within the range 10 to — for example, 11, 12, 13, 14, 15, 16, 17, 18, 19 and (or a smaller subset such as 12, 14, 16 and ) — to pinpoint the optimum concentration more precisely.
Use more concentrations at smaller intervals within the 10–20 mmol dm⁻³ range to localise the optimum.
Background Concept
The optimum in a concentration-response experiment is the concentration that gives the highest value of the dependent variable. To find it precisely you need the concentration steps to be smaller than the width of the optimum peak — otherwise you might miss the true peak or mis-locate it. A common rule of thumb in CIE Biology is to use at least five values of the independent variable around the suspected optimum.
Understanding the Question
Part (d) concluded that the optimum nitrate concentration lies between 10 and 20 , with the data suggesting it is around 15 . But with only one concentration in that range (15) and one on each side (10 and 20), the optimum could be anywhere in the 10–20 band. Part (e) asks how the investigation should be changed to find the optimum more accurately.
Approach
Keep the rest of the procedure identical and add more nitrate concentrations at smaller intervals, all lying within the 10–20 window identified in (d). The original five concentrations are still useful as a wider reference set, but additional flasks in the optimum range will give the resolution needed.
Step-by-Step Reasoning
- The optimum is somewhere in the 10–20 window.
- A step size of 5 is too coarse to locate the optimum precisely.
- Replace that step with several smaller steps — for example 12, 14, 16, 18 — while keeping the original 5 and 25 as the wider range.
- The mark scheme accepts either 'more concentrations' or 'concentrations with smaller intervals within 10–20 ', including a list of values.
Key Takeaways
- Once a wide-range experiment has identified a likely optimum, narrow-range experiments locate it.
- The number of independent-variable values used in the optimum range should be larger than the number outside it.
- The rest of the procedure (volume, light, temperature, source of culture, counting method) should be unchanged so that the comparison is valid.
Common Mistakes
- Suggesting 'use a more accurate balance' or 'use a colorimeter' — these are not how the optimum is found; the issue is the spacing of the independent variable, not the precision of measurement.
- Suggesting a completely new range (e.g. 50–100 ) — the optimum is already known to lie in 10–20 , so widening the range again is wasted effort.
- Using the same wide step (5 ) but adding more repeats — repeats improve reliability, not resolution of the optimum.
Things to Be Careful About
The mark scheme accepts the answer as a written suggestion or in a table of values. The candidate should make clear that the new concentrations fall within the 10–20 window — 'use more concentrations across the whole 0–25 range' is too broad.
Sewage lagoons also contain high concentrations of phosphate. In another investigation, the student used sodium phosphate instead of sodium nitrate to find out the effect of different phosphate concentrations on the growth of Chlorella.
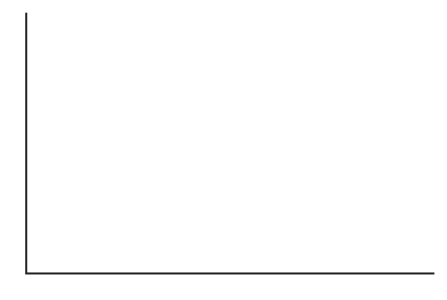
Suggest a prediction that the student could make about the effect of the different concentrations of phosphate on the growth of Chlorella.
Show your answer as a sketch graph on the axes below.
Answer
A sketch graph predicting the effect of phosphate concentration on the growth of Chlorella:
- y-axis: percentage increase in number of cells of Chlorella (or 'number of cells', 'population', 'growth')
- x-axis: phosphate concentration (in )
- shape of line: starts low (at or near the origin on the left), rises steeply, then begins to level off / form a plateau (and may start to fall) as phosphate concentration increases further — i.e. a curve showing that some phosphate is needed, more phosphate increases growth, but there is an optimum above which additional phosphate does not further increase growth.
Sketch graph: % increase in cells of Chlorella (y) against phosphate concentration (x), with a curve that rises and then plateaus / begins to fall.
Background Concept
Phosphate, like nitrate, is an essential plant nutrient: it is required for ATP, NADP, nucleic acids and membrane phospholipids. Sewage lagoons are rich in phosphate as well as nitrate, and Chlorella in the wild takes up both. The biological prediction is therefore the same shape as the nitrate response: at very low phosphate, growth is poor; as phosphate increases, growth rises; at some optimum, growth is maximal; above the optimum, additional phosphate no longer helps (and may even reduce growth, e.g. by lowering the water potential of the medium).
A sketch graph in CIE Biology is a freehand line showing the predicted shape of a relationship, with correctly labelled axes. It is not a precise graph: no scale, no plotted points, no ruler-drawn line. Its job is to communicate the prediction clearly.
Understanding the Question
The student now repeats the investigation using sodium phosphate instead of sodium nitrate. Part (f) asks for a prediction of how Chlorella will respond, expressed as a sketch graph on the blank axes provided in Fig. 1.3. Two marks: one for the axis labels (which quantity on which axis), one for the line shape (positive response that then plateaus or falls).
Approach
- Decide which variable goes on which axis. The independent variable (phosphate concentration) is on the x-axis; the dependent variable (growth of Chlorella) is on the y-axis.
- Choose the correct form of the dependent variable. The mark scheme accepts 'cells', 'population', 'growth', '% increase' or 'Chlorella' on the y-axis.
- Draw a freehand curve that conveys the prediction: a positive response that then plateaus or decreases.
Step-by-Step Reasoning
- y-axis label: percentage increase in number of cells of Chlorella (or number of cells, population, growth). The mark scheme allows any of these; units are not required because the y-axis is a sketch.
- x-axis label: phosphate concentration (in , although units are not required in a sketch). An alternative is to put time on the x-axis and draw at least two labelled lines, one for each phosphate concentration, but the simpler option is phosphate on the x-axis with one curve.
- Shape of the line: start near the origin on the left, rise with a positive slope, then either level off into a plateau or begin to fall slightly. This communicates the prediction that some phosphate is needed, that increasing phosphate up to a point increases growth, and that beyond an optimum additional phosphate does not help (or reduces growth).
- The line should be a single freehand curve; do not start it at 0 unless the y-axis label refers to raw cell numbers rather than a percentage.
The mark scheme credits:
- axis labels (1 mark), and
- a line that shows either a positive correlation or a rise-then-plateau/fall (1 mark).
Key Takeaways
- In a sketch graph the independent variable is on the x-axis and the dependent variable is on the y-axis.
- A 'limiting nutrient' prediction is shown by a curve that rises and then plateaus (or falls) at high concentrations.
- Sketch graphs need no scale, no points, no ruler — just a labelled shape.
Common Mistakes
- Swapping the axes (phosphate on the y-axis, Chlorella on the x-axis) — this is biologically wrong and scores 0.
- Drawing a straight line that keeps rising — Chlorella growth cannot keep rising indefinitely; the data for nitrate (and the equivalent biology) suggest an optimum.
- Drawing no line at all, or only a single point — the question asks for a sketch graph.
- Starting the line at the top-left and falling — that would predict phosphate inhibits growth, which is the opposite of the biological expectation.
Things to Be Careful About
The mark scheme says 'do not allow lines that start at 0 if raw numbers given on y-axis' — so if the y-axis is labelled 'number of cells', do not draw the line beginning at the origin. If the y-axis is a percentage or a relative measure, starting at the origin is acceptable. If more than one line is drawn, the lines should be labelled.
The rest of this paper
1 more questions- Q2Planning · Analysis, Conclusions and Evaluation9M