Biology 9700/52 — October/November 2012
Cambridge A-Level · Planning, Analysis and Evaluation · worked solutions for every part, with the mark scheme
Topics Analysis, Conclusions and Evaluation · Planning
A fresh water flowering plant grows on the surface of pond water. It occurs in large numbers on the surface of water polluted by sewage and fertilisers from agricultural land. Both of these pollutants contain high concentrations of nitrate and phosphate ions.
The leaf-like photosynthetic tissue of the plant is called a thallus. Each plant has a single underwater root and a thallus which floats on the water. The plant reproduces asexually by buds that grow and split off to form separate plants.
Fig. 1.1 shows the appearance of three of these plants.
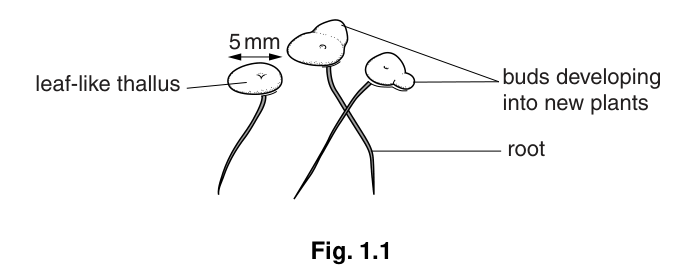
Fig. 1.1
A student investigated the effect of different concentrations of nitrate on the growth of the plant by counting the total number of the leaf-like thalli produced during a ten day period.
Fig. 1.2 shows seven thalli of different sizes and stages of development as seen from above.
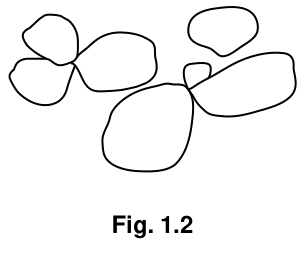
Fig. 1.2
The main stages in the procedure used by the student were:
- Pond water was sterilised and used to make dilutions of sodium nitrate. A concentration of was prepared and this was diluted to make the following concentrations:
, , and . - Plants were collected from a pond and those with a thallus without buds were selected.
- The selected plants were surface sterilised with dilute bleach.
- Each dilution of sodium nitrate was poured into a sterile glass dish and the dish covered with a lid.
- Three surface-sterilised plants were placed in each of the dilutions of sodium nitrate and the lid replaced.
- Four replicates of each sodium nitrate solution were set up in the same way.
- All of the dishes were placed in a room at a constant temperature for 10 days.
- The total number of leaf-like thalli in each dish was counted every day for 10 days.
Identify the independent and dependent variables in this investigation.
independent ______
dependent ______
Answer
Independent: concentration of sodium nitrate.
Dependent: number of (leaf-like) thalli (per dish) over the 10-day period.
Independent: sodium nitrate concentration. Dependent: number of leaf-like thalli.
Background Concept
In any experiment two variables are fundamental. The independent variable is the one the experimenter deliberately varies (the cause being tested). The dependent variable is the one that is measured to see how it responds to changes in the independent variable (the effect). Everything else should be held constant — these are the controlled variables. Recognising these three categories is the starting point of any scientific investigation.
Understanding the Question
The student set up a series of dishes containing different concentrations of sodium nitrate, added the same number of plants, and counted the number of leaf-like thalli over 10 days. The question asks you to pick out (a) what was deliberately varied and (b) what was measured as the response.
Approach
Read the procedure steps and isolate:
- the factor that changes between dishes (the IV),
- the quantity that is recorded/counted (the DV).
Step-by-Step Reasoning
- Step 1 — IV. Step 1 explicitly states that pond water was used to prepare several concentrations of sodium nitrate: 4000, 2000, 1000, 500 and 250 mg dm. So the IV is the concentration of sodium nitrate (a chemical/nutrient variable).
- Step 2 — DV. Step 8 states that the number of leaf-like thalli in each dish was counted every day. So the DV is the number of thalli.
Key Takeaways
- IV = what is varied; DV = what is measured.
- The mark scheme specifically requires the term 'thalli' (or 'leaves' allowed); 'growth' on its own is too vague and is rejected.
Common Mistakes
- Stating 'growth' as the dependent variable (the mark scheme rejects 'growth' unqualified because it is too vague).
- Reversing IV and DV.
- Naming a controlled variable (e.g. temperature) as the IV.
Things to Be Careful About
The mark scheme accepts 'leaves' as an alternative to 'thalli'; growth, plant number or reproduction rate are not accepted as DV wording here.
Identify two variables that the student controlled in this investigation.
Answer
Any two of (1 mark for two correct):
- (Initial) number / three plants or thalli per dish.
- Duration of the investigation / 10 days.
- Source of the plants (same pond / same environment).
- Temperature (constant temperature room).
- Microbial contamination (sterile water, sterile glassware, surface-sterilised plants).
Two of: three plants per dish; ten day duration; same source pond; constant temperature; sterile conditions (microbial activity).
Background Concept
A controlled variable is anything the experimenter holds constant so it cannot be a confounding influence on the result. The mark scheme accepts only variables that the procedure actually fixes — what was deliberately kept the same, not just what could have been controlled.
Understanding the Question
You are asked to pick two variables that the procedure explicitly controls. Read the eight procedural steps and look for items that are kept constant from one dish to the next.
Approach
Scan each step and note what is fixed across all replicates:
- Step 3: only plants without buds selected.
- Step 5: three plants added to each dish (number is fixed).
- Step 6: four replicates per concentration.
- Step 7: all dishes placed at constant temperature for ten days.
- Steps 1, 2, 4: water and glassware sterilised (controls microbial activity).
- Plants came from one pond (source).
Step-by-Step Reasoning
Mark any of the following (max 2 from the list; mark the first two named):
- Initial number of plants/thalli (three per dish).
- Time of investigation (10 days).
- Source of plants (same pond / same environment).
- Temperature (constant room temperature).
- Activity of microorganisms (sterile conditions control contamination).
Key Takeaways
- A controlled variable must be kept the same across all treatments, not just mentioned in the procedure.
- The mark scheme limits to two named variables; extra answers are ignored.
Common Mistakes
- Naming variables the student did NOT control (e.g. light intensity, pH, CO — these appear in (a)(iii) because they were not controlled).
- Stating 'sterile' alone — the mark scheme credits 'microbial activity / interference by microorganisms' rather than the adjective 'sterile'.
- Naming species of plant (the mark scheme explicitly ignores this).
Things to Be Careful About
This is a 'pick from a list' style question — only the first two named ideas are credited, so do not write a long list.
There are other variables that the student could have controlled in this investigation.
Describe how two other variables could have been controlled.
Answer
-
Volume of sodium nitrate solution — measure the same volume of solution into each dish using a measuring cylinder (or graduated pipette / burette).
-
Light (intensity / wavelength / duration) — provide the same illumination with a lamp of fixed wattage at a fixed distance from the dishes, for the same duration each day (e.g. 12 h light / 12 h dark).
Two linked pairs (variable + method), e.g. volume measured with a measuring cylinder/pipette; light controlled with a fixed-distance lamp on a set photoperiod.
Background Concept
A well-designed experiment controls every variable that could influence the dependent variable. The mark scheme identifies several such variables for this aquatic plant system: solution volume, light, aeration, fresh-nutrient replacement, pH, CO, and starting thallus size. For each, the candidate must give both the variable and a method of controlling it.
Understanding the Question
Having identified which variables the student did control in (a)(ii), you now name variables the student could have controlled but did not, and describe a workable practical method for each. Mark allocation: variable (1 mark) + linked method (1 mark), for two variables (max 4).
Approach
Choose two variables from the mark scheme list and pair each with a sensible method. Strong answers specify the apparatus and (where relevant) a time or intensity.
Step-by-Step Reasoning
Common credit-worthy pairs:
Volume of solution — variable named (1 mark); use of a measuring cylinder, pipette, burette or graduated beaker to measure equal volumes (1 mark).
Light — variable named (1 mark); lamp of fixed wattage at fixed distance, OR a filter of known wavelength, AND a stated daily duration of e.g. 12 h (1 mark).
Aeration / O — variable named (1 mark); supply of sterile air / O via pump, cylinder, bubbler or diffuser (1 mark).
Refreshing nitrate — variable named (1 mark); replace with fresh nitrate solution at a stated interval up to 48 h (1 mark).
pH — variable named (1 mark); use a (non-phosphate) buffer (1 mark).
CO — variable named (1 mark); add sodium hydrogen carbonate or supply CO from a cylinder (1 mark).
Starting size of thalli — variable named (1 mark); measure with a ruler, grid or callipers (1 mark).
Key Takeaways
- Each mark is for a linked variable + method pair. Naming a variable without a method scores only 1 mark.
- Methods must be practically realisable — vague 'control the light' does not score.
Common Mistakes
- Naming a variable the student already controlled (e.g. temperature).
- Stating 'phosphate buffer' — the mark scheme rejects phosphate buffers because phosphate is itself a variable here.
- Naming 'mass' of starting plants — the mark scheme ignores mass.
- Using a pH buffer without specifying which buffer.
Things to Be Careful About
- The mark scheme tells you that identifying the variable is free-standing (so you score 1 mark even if the method is wrong), but the method must be linked to the named variable.
- Two pairs maximum — additional pairs are ignored.
The student used the highest concentration () to prepare the other concentrations of sodium nitrate.
Describe a procedure that the student used to prepare the other concentrations stated in stage 1. Your description should be sufficiently detailed so that another person can easily follow your procedure.
Answer
- Sterilise all glassware (measuring cylinders, beakers) and use sterilised pond water as the diluent.
- Measure 50 cm of the 4000 mg dm sodium nitrate solution into a sterile beaker and add 50 cm of sterilised pond water. Stir/swirl to mix thoroughly → 100 cm of 2000 mg dm.
- Take 50 cm of this 2000 mg dm solution into a clean sterile beaker, add 50 cm of sterilised pond water, stir → 100 cm of 1000 mg dm.
- Repeat: 50 cm of 1000 mg dm + 50 cm sterilised pond water → 100 cm of 500 mg dm.
- Repeat: 50 cm of 500 mg dm + 50 cm sterilised pond water → 100 cm of 250 mg dm.
(Each step halves the concentration — a 1:1 serial dilution using sterile pond water throughout.)
Serial dilution: 50 cm of 4000 mg dm + 50 cm sterile pond water = 2000; halve each subsequent dilution, mixing between steps.
Background Concept
A serial dilution halves (or otherwise fractions) the concentration each step by transferring a fixed volume of solution into a fixed volume of diluent, mixing, then transferring the same volume of the diluted solution into the next volume of diluent. Because the required concentrations (4000 → 2000 → 1000 → 500 → 250 mg dm) form a geometric halving sequence, a 1:1 dilution at each step is appropriate.
Understanding the Question
You are told the result (the four concentrations produced) and must write the procedure that produces them. The procedure must be detailed enough that another person could follow it without further explanation. Marks are awarded for sterile technique, serial-dilution logic, correct proportions and a mixing step.
Approach
Lay out the steps in the order someone would actually do them: sterilise → take an aliquot of stock → add equal volume of diluent → mix → repeat.
Step-by-Step Reasoning
- Sterile pond water as diluent (mark 1) maintains the plant's normal ionic background; sterilising glassware / working aseptically (mark 2) prevents microbial contamination that would compete with the plant for nitrate.
- Serial dilution (mark 3) — each new concentration is made from the previous one, not from the original stock.
- 1:1 dilution each time (mark 4) — equal volumes of solution and pond water. For example, 50 cm + 50 cm.
- Correct proportions (mark 5) — give actual volumes and units. The pattern 1:1 repeated four times produces 2000, 1000, 500 and 250 mg dm from a 4000 mg dm stock.
- Stirring / swirling (mark 6) — mix between each step so the solution is homogeneous before the next transfer.
Key Takeaways
- Each dilution halves the concentration because equal volumes of solution and water are mixed.
- Volumes must be quoted with units for the 'correct proportions' mark.
- Sterile technique matters because microbial growth would alter the nitrate concentration over the 10-day experiment.
Common Mistakes
- Stating the dilution without giving volumes (e.g. 'add water') — does not score the 'correct proportions' mark.
- Forgetting to stir / swirl.
- Preparing all four concentrations independently from the 4000 stock (e.g. 1:3, 1:7 etc.) — this can produce the right numbers but is not a serial dilution and loses the 'serial dilution' mark.
- Using tap water instead of sterile pond water.
Things to Be Careful About
The mark scheme allows the alternative formula — either form is acceptable, but giving both volumes and units is essential.
The student also prepared another sterile glass dish to use as a control.
Suggest a suitable solution to use as a control for this investigation.
Answer
Sterilised pond water only, added in the same volume as the sodium nitrate solution used in the experimental dishes.
Sterilised pond water (same volume as the nitrate solutions).
Background Concept
A control in this context tests the effect of pond water alone — without added nitrate — so the effect of nitrate can be compared to a baseline. The control should differ from the experimental dishes only in the absence of the independent variable (nitrate).
Understanding the Question
The student set up an extra dish alongside the nitrate treatments. You must say what should be in this dish for it to be a valid control.
Approach
Identify the IV (nitrate) and remove it; keep everything else (the pond water, the volume, the sterility, the dish and lid) the same.
Step-by-Step Reasoning
- The diluent in every dish is sterilised pond water, so a control should also use sterilised pond water.
- It must contain no added sodium nitrate so that any growth seen is due to the natural nitrate content (or absence) of pond water.
- The volume must equal that of the nitrate dishes so that depth / volume is not a confounding variable.
Key Takeaways
A good control is identical to the experimental setup except for the absence of the IV.
Common Mistakes
- Suggesting distilled / deionised water — this loses the pond water's other dissolved ions that the plant needs.
- Omitting 'sterilised' — the control must be sterile to match the experimental dishes.
Things to Be Careful About
The mark scheme requires both 'sterilised pond water' and a matching volume.
The results of the student’s investigation are shown in Table 1.1.
Table 1.1
| concentration of sodium nitrate / | mean number of thalli 1s at daily intervals | |||||||||
|---|---|---|---|---|---|---|---|---|---|---|
| 1 | 2 | 3 | 4 | 5 | 6 | 7 | 8 | 9 | 10 | |
| control | 3 | |||||||||
| 250 | 3 | |||||||||
| 500 | 3 | |||||||||
| 1000 | 3 | |||||||||
| 2000 | 3 | |||||||||
| 4000 | 3 |
State what standard deviation (s) shows about the data.
Answer
Standard deviation () shows the spread of the data around the mean — i.e. how far individual replicate values typically lie from the mean. It therefore indicates (measures) the reliability of the data: a small means the replicates cluster close to the mean (reliable), while a large means they are widely scattered (less reliable).
Standard deviation shows the spread of the data around the mean and indicates the reliability of the data.
Background Concept
The mean is the arithmetic average of the replicates. The standard deviation () quantifies how much the individual replicate values differ, on average, from that mean. Approximately 68 % of values lie within of the mean for a normally distributed set. When is large, the replicates disagree substantially; when is small, they agree closely.
Understanding the Question
The table shows mean for each concentration at each day. The candidate must say, in two linked ideas, what shows about the data.
Approach
Two ideas: (1) measures spread around the mean; (2) is therefore an indicator of reliability.
Step-by-Step Reasoning
- Spread: values further from the mean increase . So tells you how tightly packed or scattered the replicate values are around the mean.
- Reliability: the tighter the cluster (small ), the more confidence you have that the mean is a good representation of the true value. A large indicates that the replicates disagree and the result is less reliable.
Key Takeaways
- = spread / variability / dispersion around the mean.
- inversely related to reliability.
Common Mistakes
- Stating that shows the 'accuracy' of the data (accuracy is closeness to the true value; spread / reliability is not the same).
- Saying is the range or the difference between replicates.
Things to Be Careful About
If you qualify the reliability idea (e.g. 'small = reliable'), you must give both halves: small AND reliable, or large AND not very reliable. A one-sided statement does not score.
The results show that the standard deviation increased with time.
Suggest a reason for this increase.
Answer
- Over time there are more thalli in each dish, so the absolute differences between replicates become larger.
- The longer the plants grow, the greater the difference between individual replicates because small initial differences in growth rate are amplified with time.
- Different replicates have slightly different growth rates, so the variation between them grows as the experiment progresses.
More thalli accumulate with time; small initial differences in growth rate between replicates are amplified over time, so the spread of replicate values (and hence ) increases.
Background Concept
Standard deviation is in the same units as the mean, so as the mean (number of thalli) grows, the absolute spread between replicates tends to grow too — there are simply more plants whose counts can differ. This is not the same as the relative variation (CV) getting bigger; absolute growing is normal in an accumulating count.
Understanding the Question
The table shows values rising from 1 to 12 (for example, in the 1000 mg dm row) as days go by. Explain why.
Approach
Connect three ideas: (1) more thalli per dish → larger absolute numbers → larger absolute differences possible; (2) longer growth time → more opportunity for differences to develop; (3) each replicate grows at a slightly different rate → differences amplified.
Step-by-Step Reasoning
- Idea 1 — bigger pool of counts. By day 10 the mean is 180 in the 1000 mg dm treatment. There are far more individuals that can vary between replicates than at day 1 (mean 3).
- Idea 2 — time amplifies small differences. Even if two replicates start with similar growth rates, slight differences in microenvironment (e.g. light gradient across the dish) compound over 10 days. By day 10, replicate 1 might have many more buds than replicate 2.
- Idea 3 — biological variation. Different individual plants have slightly different growth potentials; with asexual budding, the small differences in initial plant vigour are inherited by their buds and become more obvious over time.
Key Takeaways
- Standard deviation typically grows with the mean of a count variable because absolute variation scales with population size.
- Longer experiments magnify initial variation.
Common Mistakes
- Stating that the mean increases (the mark scheme explicitly rejects 'mean number of thalli' as an answer here).
- Attributing the rise to difficulty of counting (the mark scheme explicitly ignores this).
- Claiming 'the data become less accurate' — accuracy and reliability are different things; the issue here is reliability / spread, not accuracy.
Things to Be Careful About
The mark scheme allows up to 3 marks, distributed across the three ideas above. Award yourself one mark for each linked idea.
State the conclusions that can be drawn from the results in Table 1.1 about the effect of different concentrations of nitrate on the growth of this plant.
Answer
- Increasing nitrate concentration up to 1000 mg dm increases the number of thalli produced compared with the control (e.g. day-10 means: control 40, 250 → 48, 500 → 90, 1000 → 180).
- Above 1000 mg dm the rate of increase in thalli slows and is reversed: 2000 mg dm gives only 157 thalli and 4000 mg dm gives 135 thalli by day 10, both lower than at 1000 mg dm.
- The optimum nitrate concentration lies between 500 and 2000 mg dm, with the highest mean number of thalli (180) at 1000 mg dm.
(Additionally, the standard deviations for the control, 250 and 500 mg dm treatments overlap, so the apparent differences between these low-concentration treatments are not reliable.)
Up to 1000 mg dm, more nitrate gives more thalli (vs the control); above this, growth is inhibited; the optimum lies between 500 and 2000 mg dm (peak mean at 1000 mg dm).
Background Concept
Nitrate is a key nutrient for plant growth — a nitrogen source for amino acids, proteins, nucleic acids and chlorophyll. Up to a point, more nitrate fuels more growth, but very high concentrations can reduce water potential (osmotic stress) or become directly toxic, slowing or inhibiting growth. The optimum is the concentration giving the greatest growth response.
Understanding the Question
You must read Table 1.1 and write a short set of conclusions about how nitrate concentration affects the number of thalli produced over 10 days. The question awards 3 marks — pick the three most defensible conclusions and support each with figures.
Approach
Compare each row to the control and to its neighbours. Look at the day-10 means, then check whether the trend is monotonic or whether it bends over.
Step-by-Step Reasoning
- Comparison to control. Day-10 means: control = 40, 250 mg dm = 48, 500 = 90, 1000 = 180, 2000 = 157, 4000 = 135. All nitrate treatments exceed the control, so nitrate does increase growth above the baseline.
- Monotonic rise, then bend. Numbers rise with concentration up to 1000 mg dm, then fall at 2000 and 4000. The increase is therefore not linear across the whole range — it slows and reverses above 1000.
- Optimum. The maximum mean (180 thalli at day 10) is at 1000 mg dm, so the optimum lies between the concentrations that flank it (500 and 2000 mg dm).
- Reliability caveat. Look at the standard deviations for the control, 250 and 500 rows at day 10: , , . These intervals overlap, so the differences between these three treatments are not statistically distinct.
Key Takeaways
- A 'conclusion' must be a claim (more growth / optimum / inhibition) supported by figures from the table.
- The optimum is a range between the concentrations that bracket the maximum, not the maximum itself.
- Standard-deviation overlap tells you whether a difference is real or just within noise.
Common Mistakes
- Stating that 'growth increases with nitrate concentration' without mentioning that this only applies up to 1000 mg dm.
- Claiming the optimum is exactly 1000 mg dm — the data only show it is between 500 and 2000 mg dm.
- Ignoring the standard-deviation overlap between the low-concentration treatments.
Things to Be Careful About
The mark scheme explicitly limits to 3 marks and demands that you reference nitrate concentration figures. A vague 'growth increases and then decreases' answer with no figures is capped at 1 mark.
Suggest how the student’s investigation could be modified to find the optimum nitrate concentration for the growth of this plant.
Answer
Repeat the experiment using smaller concentration intervals within the 500–2000 mg dm range — e.g. test 600, 700, 800, 900, 1000, 1100, 1200, ..., 1900, 2000 mg dm — so the exact concentration giving the maximum number of thalli can be identified.
Use smaller concentration intervals within the 500–2000 mg dm range to identify the precise optimum.
Background Concept
The current data identify that the optimum is somewhere between 500 and 2000 mg dm, but the spacing (500, 1000, 2000 mg dm) is too coarse to determine which concentration is best. To locate the optimum, the independent variable must be sampled more finely in the region of the suspected maximum.
Understanding the Question
You are asked for a modification to the procedure that would allow the optimum concentration to be identified. The mark scheme awards the mark simply for the idea of using smaller intervals in the right range.
Approach
State the range (500–2000 mg dm) and the idea of testing more concentrations within it.
Step-by-Step Reasoning
- The current data show the maximum mean at 1000 mg dm with lower values at 500 and 2000, so the optimum lies within that range.
- The four concentrations tested (250, 500, 1000, 2000, 4000) double (or halve) each step — they are spaced too widely to pinpoint a single optimum.
- Adding more concentrations between 500 and 2000 (e.g. every 100 mg dm) lets you plot a finer curve and read off the peak.
Key Takeaways
- An optimum is located by narrowing the search around the suspected peak.
- The mark scheme accepts the idea even without quoting specific extra concentrations.
Common Mistakes
- Suggesting to repeat the whole range (250–4000) with the same spacing — this would not refine the optimum.
- Suggesting to test one extra concentration (e.g. just 1500 mg dm) — you cannot pinpoint an optimum from a single extra point.
Things to Be Careful About
The mark scheme allows a 'repeat the whole range with smaller intervals' as an alternative credit — both are acceptable.
Sewage and agricultural fertilisers contain phosphate as well as nitrate. In another investigation the student used sodium phosphate instead of sodium nitrate to test the effect of different concentrations of phosphate on the growth of the same plant.
Suggest a prediction that the student could make about the effect of different concentrations of phosphate on the growth of the plant.
Show your answer as a sketch graph on the axes below.
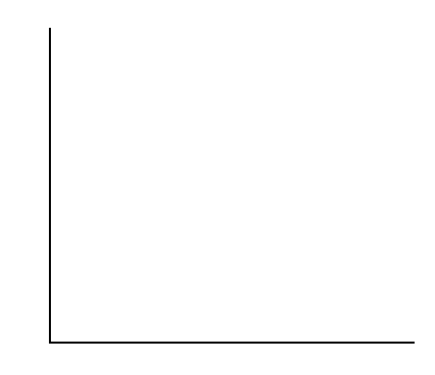
Answer
The sketch graph has:
- x-axis: phosphate concentration (units not required).
- y-axis: number of thalli (or growth).
- A single smooth curve that starts low at low phosphate, rises as phosphate concentration increases, reaches a peak (the optimum) at an intermediate phosphate concentration, then falls at higher phosphate concentrations.
This predicts the same general shape as for nitrate — phosphate is also a plant nutrient (needed for ATP, nucleic acids and phospholipids), so a similar optimum response is expected.
Sketch graph: phosphate concentration on x-axis, number of thalli on y-axis; a curve that rises, peaks and falls.
Background Concept
Phosphate is a macronutrient needed for ATP, nucleic acids and membrane phospholipids. As with nitrate, a moderate supply promotes growth, but very high concentrations can lower water potential (osmotic stress) or become inhibitory. A dose–response curve with an optimum is the expected pattern.
Understanding the Question
The student is repeating the design with sodium phosphate instead of sodium nitrate. The question asks for a prediction in the form of a sketch graph on the blank axes provided. Marks are for correct axis labels (1) and a correctly-shaped curve (1).
Approach
Use the same axes structure as a standard biological sketch graph:
- label the x-axis with the independent variable (phosphate concentration);
- label the y-axis with the dependent variable (number of thalli / growth);
- draw a smooth curve that rises to a peak and then falls.
Step-by-Step Reasoning
- Axes (1 mark). x = phosphate (concentration) (units not required); y = number of thalli / growth.
- Curve (1 mark). The line must show a positive relationship at low phosphate and a negative (or inhibitory) relationship at high phosphate. Acceptable shapes include:
- a continuous rise, level off, then fall (saturating curve with inhibition);
- a line that starts high and falls (if you predict inhibition from the start, which is less likely given the biology, but the mark scheme allows this shape).
- The line should not start at the origin on the y-axis (the mark scheme rejects a line starting at 0 if the y-axis is a number of thalli).
Key Takeaways
- The prediction is a hypothesis — it must be biologically plausible and consistent with the pattern seen for nitrate.
- A sketch graph only needs the general shape and the labels; precise points and units are not required.
Common Mistakes
- Drawing a straight line upward (no optimum) — fails to capture the inhibition seen with very high concentrations.
- Failing to label either axis.
- Starting the curve at the origin of the y-axis when the y-axis is a count of thalli.
Things to Be Careful About
- If more than one line is drawn (e.g. for different times), each must be labelled.
- The mark scheme specifies 'units not needed' on the axes, so do not waste time adding mg dm.
The rest of this paper
1 more questions- Q2Analysis, Conclusions and Evaluation10M