Biology 9700/51 — October/November 2012
Cambridge A-Level · Planning, Analysis and Evaluation · worked solutions for every part, with the mark scheme
Topics Planning · Analysis, Conclusions and Evaluation
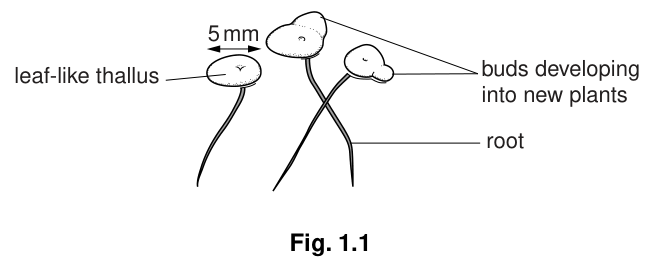
A fresh water flowering plant grows on the surface of pond water. It occurs in large numbers on the surface of water polluted by sewage and fertilisers from agricultural land. Both of these pollutants contain high concentrations of nitrate and phosphate ions.
The leaf-like photosynthetic tissue of the plant is called a thallus. Each plant has a single underwater root and a thallus which floats on the water. The plant reproduces asexually by buds that grow and split off to form separate plants.
Fig. 1.1 shows the appearance of three of these plants.
A student investigated the effect of different concentrations of nitrate on the growth of the plant by counting the total number of the leaf-like thalli produced during a ten day period.
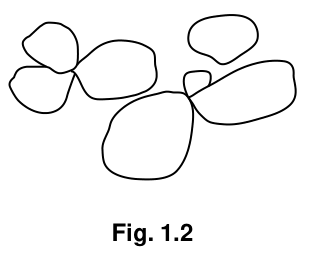
Fig. 1.2 shows seven thalli of different sizes and stages of development as seen from above.
The main stages in the procedure used by the student were:
- Pond water was sterilised and used to make dilutions of sodium nitrate. A concentration of was prepared and this was diluted to make the following concentrations:
, , and . - Plants were collected from a pond and those with a thallus without buds were selected.
- The selected plants were surface sterilised with dilute bleach.
- Each dilution of sodium nitrate was poured into a sterile glass dish and the dish covered with a lid.
- Three surface-sterilised plants were placed in each of the dilutions of sodium nitrate and the lid replaced.
- Four replicates of each sodium nitrate solution were set up in the same way.
- All of the dishes were placed in a room at a constant temperature for 10 days.
- The total number of leaf-like thalli in each dish was counted every day for 10 days.
Identify the independent and dependent variables in this investigation.
independent ______
dependent ______
Identify two variables that the student controlled in this investigation.
There are other variables that the student could have controlled in this investigation.
Describe how two other variables could have been controlled.
The student used the highest concentration () to prepare the other concentrations of sodium nitrate.
Describe a procedure that the student used to prepare the other concentrations stated in stage 1. Your description should be sufficiently detailed so that another person can easily follow your procedure.
The student also prepared another sterile glass dish to use as a control.
Suggest a suitable solution to use as a control for this investigation.
The results of the student’s investigation are shown in Table 1.1.
Table 1.1
| concentration of sodium nitrate / | mean number of thalli 1s at daily intervals | |||||||||
|---|---|---|---|---|---|---|---|---|---|---|
| 1 | 2 | 3 | 4 | 5 | 6 | 7 | 8 | 9 | 10 | |
| control | 3 | |||||||||
| 250 | 3 | |||||||||
| 500 | 3 | |||||||||
| 1000 | 3 | |||||||||
| 2000 | 3 | |||||||||
| 4000 | 3 |
State what standard deviation (s) shows about the data.
The results show that the standard deviation increased with time.
Suggest a reason for this increase.
State the conclusions that can be drawn from the results in Table 1.1 about the effect of different concentrations of nitrate on the growth of this plant.
Suggest how the student’s investigation could be modified to find the optimum nitrate concentration for the growth of this plant.
Sewage and agricultural fertilisers contain phosphate as well as nitrate. In another investigation the student used sodium phosphate instead of sodium nitrate to test the effect of different concentrations of phosphate on the growth of the same plant.
Suggest a prediction that the student could make about the effect of different concentrations of phosphate on the growth of the plant.
Show your answer as a sketch graph on the axes below.

The rest of this paper
1 more questions- Q2Planning · Analysis, Conclusions and Evaluation10M