Biology 9700/53 — October/November 2011
Cambridge A-Level · Planning, Analysis and Evaluation · worked solutions for every part, with the mark scheme
Topics Analysis, Conclusions and Evaluation · Planning
A student collected leaves from three varieties of the same species of a garden plant that has different coloured leaves.
Variety A: dark red leaves
Variety B: yellow leaves
Variety C: green and white striped leaves
The student made a chloroplast extract from the leaves of each variety and measured the rate of photosynthesis for each extract in different wavelengths of light.
The following procedure was used:
Extracting the chloroplasts
- place of leaves in a mortar with an ice cold phosphate buffer solution
- place the mortar in an ice bath and crush the leaves using a pestle
- filter the extract through a fine mesh into a small beaker as quickly as possible
- completely cover the beaker with metal foil and place in an ice bath.
Measuring the rate of photosynthesis
5. add of methylene blue to each chloroplast extract
6. re-cover the extracts and keep in an ice bath
7. collect samples of each extract in capillary tubes and keep covered with metal foil
8. for each extract, remove the metal foil and measure the time taken for the blue colour to disappear in different wavelengths of light.
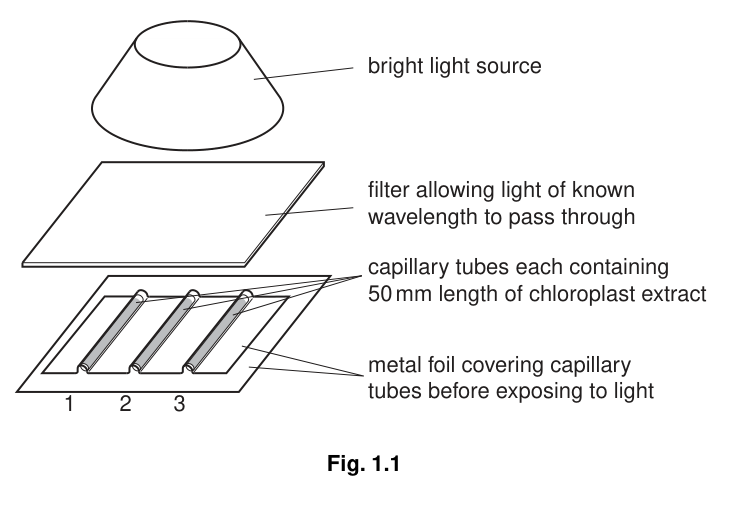
Fig. 1.1 shows how the apparatus was used to measure the rate of photosynthesis for each extract.
State two independent variables in this investigation.
- ______
- ______
State the dependent variable in this investigation.
Identify one variable that has been standardised in this investigation.
State a reason for each of the following procedures:
using a phosphate buffer solution
keeping the extract ice cold
using a fine mesh to filter the extract.
Table 1.1 shows the student’s results.
Table 1.1
| time taken for blue colour to disappear / seconds (s) | |||
|---|---|---|---|
| source of chloroplasts | |||
| wavelength of light / nm | dark red leaf | yellow leaf | green and white striped leaf |
| 440 | 9, 10, 12 | 28, 26, 26 | 13, 12, 12 |
| 500 | 14, 15, 13 | 29, 31, 33 | 16, 17, 15 |
| 530 | 45, 44, 43 | 52, 45, 44 | 45, 43, 52 |
| 570 | 32, 34, 33 | 34, 34, 44 | 34, 33, 33 |
| 650 | 25, 18, 17 | 25, 18, 16 | 17, 17, 18 |
| 750 | stayed blue after 100 seconds |
Table 1.2 shows the rates of photosynthesis calculated by the student.
Table 1.2
| rate of photosynthesis / | |||
|---|---|---|---|
| source of chloroplasts | |||
| wavelength of light / nm | dark red leaf | yellow leaf | green and white striped leaf |
| 440 | 0.097 | 0.038 | 0.081 |
| 500 | 0.071 | 0.032 | 0.063 |
| 530 | 0.023 | 0.023 | |
| 570 | 0.030 | 0.029 | 0.039 |
| 650 | 0.057 | 0.049 | 0.058 |
| 750 | 0.000 | 0.000 | 0.000 |
On Table 1.1 indicate, by placing a circle around each value, two results that may be anomalous.
Complete Table 1.2 by calculating the rate of photosynthesis for the green and white striped leaf at a wavelength of . Show your working.
The student analysed these results and proposed two hypotheses:
- There is a pigment in red leaves which is not present in the other leaves.
- Yellow leaves do not have a pigment that is found in the other leaves.
To test these hypotheses the student used chromatography to separate the pigments in the leaves.
Outline a procedure the student could use to extract the leaf pigments and separate them by chromatography.
Fig. 1.2 shows the chromatograms obtained by the student.
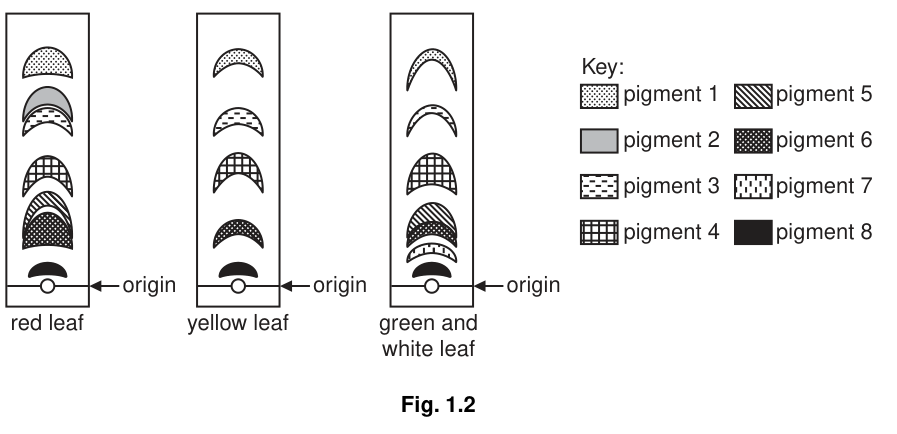
Use Fig. 1.2 to describe the evidence that supports the student’s hypotheses.
The rest of this paper
1 more questions- Q2Analysis, Conclusions and Evaluation10M