Biology 9700/51 — May/June 2011
Cambridge A-Level · Planning, Analysis and Evaluation · worked solutions for every part, with the mark scheme
Topics Planning · Analysis, Conclusions and Evaluation
A student investigated the storage tissue in potato tubers of different ages
- a newly formed tuber
- an old tuber that was just beginning to form new shoots.
In one investigation, the water potential of different parts of the tubers was estimated using discs of potato tissue and sucrose solutions of different concentrations.
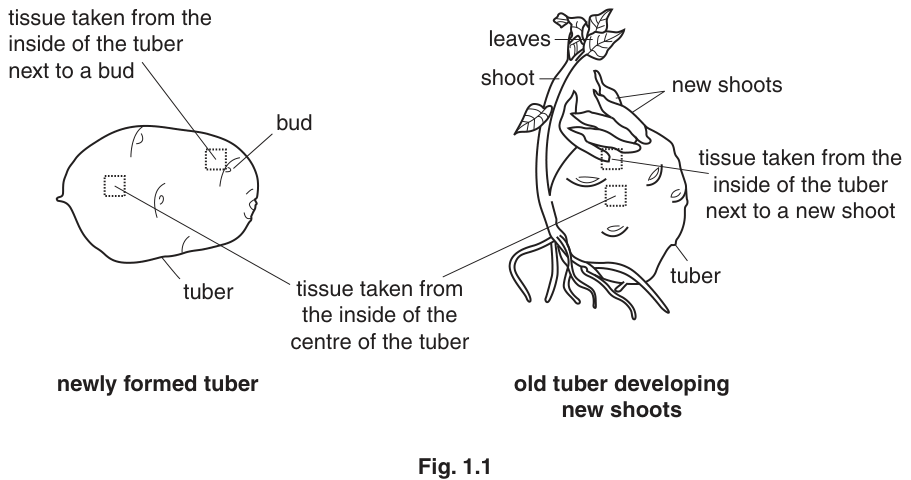
Fig. 1.1 shows
- the appearance of the tubers
- the places from where the tissues were removed.
The results of the investigation are shown in Fig. 1.2.
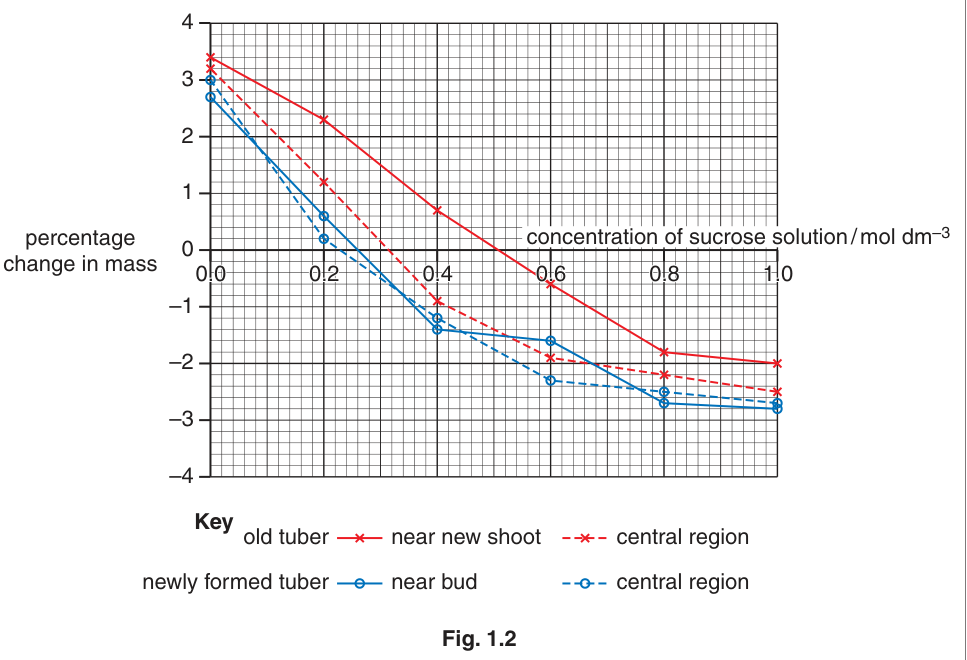
Describe a procedure by which the student could have obtained the results in Fig. 1.2.
Answer
- Prepare a range of sucrose solutions of 0.2, 0.4, 0.6, 0.8 and 1.0 mol dm⁻³ (and a 0.0 mol dm⁻³ water control) using distilled or deionised water.
- Cut potato discs of the same mass (or same number / volume / size) from each of the four sampling regions: newly formed tuber near bud; newly formed tuber central; old tuber near new shoot; old tuber central.
- Place each disc in a separate, labelled container with a known, equal volume of each sucrose solution, ensuring the tissue is fully immersed.
- Weigh each disc before immersion; record the initial mass.
- Leave all discs in the solutions for the same time (at least 20 minutes) at the same temperature (e.g. room temperature, or in a water bath).
- Remove each disc, blot it dry with a paper towel, and reweigh.
- Calculate the percentage change in mass for each disc:
- Repeat each combination of region and concentration at least three times and calculate a mean.
- Use the same species/variety of potato, and from a single tuber where possible, to standardise the source of material.
- Take a suitable safety precaution, e.g. cut away from the hands on a tile (low-risk investigation overall).
See working
Background Concept
Water potential () is the tendency of water to move between regions by osmosis. When potato tissue is placed in a sucrose solution:
- in a hypotonic solution (lower sucrose concentration than the cell sap), water enters the cells and the mass increases;
- in a hypertonic solution, water leaves the cells and the mass decreases;
- at the point of no change in mass, the water potential of the tissue equals the water potential of the external solution.
The sucrose concentration at which the curve crosses zero therefore gives the water potential of the tissue. By exposing tissue from each region to a series of concentrations, the water potentials of the four regions can be compared.
Understanding the Question
The question asks for a procedure that would produce the four curves in Fig. 1.2. Fig. 1.2 plots percentage change in mass against sucrose concentration for four different sampling locations on the tubers. To obtain such a graph, the independent variable (sucrose concentration) must be varied, the dependent variable (mass change) measured, and all other variables controlled. The mark scheme gives credit for: setting up the concentration range, the weighing procedure, standardised variables, safety, and replication.
Approach
Lay out the procedure in the order it would be carried out: making the solutions, preparing the tissue, immersing the tissue, measuring the mass change, and recording the data. Cover the independent variable, the dependent variable, the standardising variables (mass, volume, time, temperature, source), the safety precaution, and replication. Aim for at least 8 of the 13 marking points the scheme lists.
Step-by-Step Reasoning
Independent variable — sucrose concentration:
Make up a series of sucrose solutions from 0.0 to 1.0 mol dm⁻³ (typically 0.2, 0.4, 0.6, 0.8 and 1.0 mol dm⁻³) using distilled or deionised water. The mark scheme explicitly credits these specific concentrations. Each concentration corresponds to a different water potential against which the tissue can be compared.
Dependent variable — mass change:
Weigh each piece of tissue before immersion, leave it in the solution for at least 20 minutes (long enough for osmotic equilibration), remove it, blot it dry on a paper towel (to remove surface solution, which would otherwise distort the mass reading), and reweigh.
Standardising variables:
- Use discs of the same mass (or number / volume / size) — so any mass change is due to osmosis, not to differences in starting amount.
- Use the same volume of each sucrose solution and ensure the tissue is fully immersed.
- Use the same immersion time for every sample.
- Keep the temperature constant (room temperature is acceptable; a water bath is more rigorous).
- Use the same species and variety of potato, and ideally the same tuber, to control for biological variation.
Replication and reliability:
Repeat each combination of region and concentration at least three times and calculate a mean. This allows anomalies to be identified and the precision of the estimate to be improved.
Safety:
This is a low-risk investigation. Standard precautions include cutting on a tile away from the hands; a mask or gloves are only relevant if there is a risk of plant allergy (the mark scheme does not credit gloves for cutting).
Why percentage change in mass rather than actual mass?
Because the starting masses of the discs are unlikely to be identical, the change is expressed as a percentage of the original mass, so samples can be compared fairly on the same axes.
Key Takeaways
- The independent variable is sucrose concentration; the dependent variable is percentage change in mass.
- The water potential of the tissue is read off where each curve crosses zero.
- Standardising mass, volume, time, temperature and source of tissue is essential for a valid comparison between regions.
- Replication (at least three) and a mean improve reliability.
- Blotting before reweighing is essential.
Common Mistakes
- Vague "use different concentrations" — the mark scheme requires specific concentrations (typically 0.2, 0.4, 0.6, 0.8, 1.0 mol dm⁻³).
- Forgetting to blot before reweighing — surface solution falsely raises the mass.
- Omitting replication — credit is given for at least three repeats and a mean.
- Vague variable standardisation ("use the same amount") — must specify mass / number / volume / size.
- Stating a serial dilution that would not produce the named concentrations — only serial dilutions that yield the named concentrations are credited.
- Mentioning gloves for cutting — not credited by the mark scheme.
Things to Be Careful About
- "Same amount" alone is not enough: state mass / number / volume / size.
- The minimum immersion time is 20 minutes; shorter times would not allow osmotic equilibration.
- Room temperature is acceptable as a temperature control; do not write vague "control temperature" without a method.
- Use distilled / deionised water for the dilutions; tap water is not credited.
State how the percentage change in mass is calculated.
Answer
(final mass − original mass) / original mass × 100
Background Concept
Percentage change expresses a difference relative to the starting value. The denominator is the original mass, the numerator is the change in mass, and the proportion is multiplied by 100 to convert it to a percentage. The result can be positive (mass gain, in a hypotonic solution) or negative (mass loss, in a hypertonic solution).
Understanding the Question
A one-mark question asking for the formula for percentage change in mass. The mark scheme accepts a formula, a description, or a difference-of-masses expression; any of these forms is acceptable.
Approach
State the change in mass (final − original), divide by the original mass, multiply by 100.
Step-by-Step Reasoning
- Subtract the original mass from the final mass: this gives the change in mass (positive for a gain, negative for a loss).
- Divide this change by the original mass: this turns the change into a proportion of the starting mass.
- Multiply by 100 to express the proportion as a percentage.
The original (not the final) mass is used as the denominator because we are asking "by what fraction of the starting mass has the mass changed?".
Key Takeaways
- Percentage change = change ÷ original × 100.
- The denominator is always the original (starting) mass.
- A negative result indicates a loss of mass.
Common Mistakes
- Dividing by the final mass instead of the original.
- Omitting the ×100.
- Confusing percentage change with percentage of original mass.
Things to Be Careful About
- A clear formula is preferred; a written-out description ("difference in mass divided by the original mass") is accepted as an alternative.
Explain why the student used percentage change in mass rather than actual mass.
Answer
Percentage change in mass expresses the change as a proportion of the original mass, so it allows a fair comparison between samples that did not start with exactly the same mass.
Allows fair comparison when starting masses differ / it takes the original mass into account.
Background Concept
Two samples of different initial mass can show the same absolute change in mass, but that change represents a different proportion of each sample. Percentage change normalises the result so the comparison is independent of starting size.
Understanding the Question
The student used percentage change in mass rather than the actual (raw) mass. The question asks for the reason.
Approach
Identify the problem with raw mass: the discs are unlikely to all start at the same mass, so direct comparison is unfair. Percentage change removes the effect of starting mass.
Step-by-Step Reasoning
- The investigation uses many small pieces of potato tissue from different parts of the tuber; it is unrealistic to guarantee they all have the same starting mass.
- If one disc started at 1.0 g and another at 2.0 g, the same absolute loss of 0.1 g represents 10% of the first but only 5% of the second.
- Dividing by the original mass expresses the result as a fraction of what the sample started as, so samples of different initial mass can be compared directly on the same graph.
Key Takeaways
- Percentage change controls for differences in starting mass.
- It allows direct comparison on a single graph.
Common Mistakes
- Vague answers such as "it is more accurate" or "it is easier" — credit requires the idea of proportional change from the original mass, or that it allows comparison when starting masses differ.
Things to Be Careful About
- The mark scheme credits either the idea of proportional change OR the comparison being made easier; either is sufficient.
Fig. 1.3 shows the same data as Fig. 1.2.
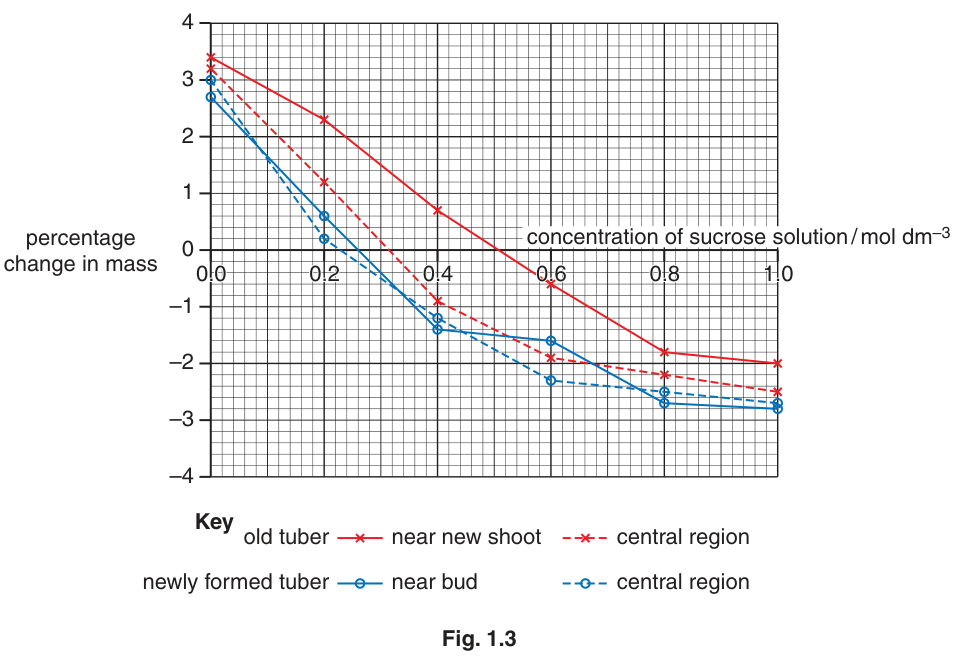
The student looked at the graphs in Fig. 1.3 and estimated the water potential from where there was no change in mass.
The student decided to find out if the difference in the water potential between the central region of the old tuber and the central region of the newly formed tuber was significant.
- 20 samples of tissue were taken from the central region of each tuber.
- The change in mass was measured separately for each sample using the same procedure as in the original investigation.
Give one reason why the -test is a suitable statistical test for this investigation.
Answer
The t-test compares the means of two sets of data, and the data in this investigation (water potential / change in mass) are continuous, with a sample size of 20 + 20 that is appropriate for the test.
Compares two means; data is continuous; sample size is appropriate for a t-test.
Background Concept
The t-test is a statistical test that compares the means of two samples to decide whether the difference between them is likely to have arisen by chance or whether it is statistically significant. It requires continuous, approximately normally distributed data, and the two samples should be independent. The standard version is Student's t-test for unpaired data.
Understanding the Question
The student has two sets of 20 measurements (central region of the old tuber; central region of the new tuber) and wants to know whether the difference in their water potentials is significant. A one-mark question requires one reason the t-test is appropriate.
Approach
Identify what kind of comparison the t-test is designed for, and check that the data in the question match.
Step-by-Step Reasoning
- The t-test is used to compare the means of two data sets.
- The data in this investigation (water potential, percentage change in mass) are continuous rather than categorical, meeting the t-test's data-type requirement.
- The two sets are independent (different samples from different tubers) and the sample size (20 per group) is appropriate for the test.
The mark scheme credits any of: comparing two means; data is continuous; sample size is appropriate. One such reason is sufficient.
Key Takeaways
- The t-test compares the means of two independent samples.
- It requires continuous data and an adequate sample size.
- It is not suitable for proportions, percentages, or categorical data.
Common Mistakes
- Writing "it is a continuous variable" alone — the mark scheme explicitly rejects this wording. The correct framing is that the data is continuous, or that the t-test compares two means, or that the sample size is appropriate.
- Naming a different test (chi-squared, correlation) — those are used for different data structures.
Things to Be Careful About
- "Continuous" is a property of the data, not of a single variable standing alone.
- A single t-test compares two means; comparing more than two means requires ANOVA.
Explain how the student should use the value for to find out if the difference in water potential between the tubers is significant.
Answer
- Calculate the degrees of freedom: .
- Find the critical value of at for 38 degrees of freedom from a probability table.
- Compare the calculated value with the critical value:
- if the calculated is greater than the critical value, the difference between the two means is statistically significant;
- if the calculated is less than (or equal to) the critical value, the difference is not statistically significant.
Compare the calculated t with the critical value at p = 0.05 with 38 degrees of freedom; greater t → significant, lower/equal t → not significant.
Background Concept
The t-test produces a value of that summarises the size of the difference between two means relative to the spread within the samples. To decide whether this value is large enough to be statistically significant, it is compared with a critical value from a statistical table at a chosen probability (usually , i.e. a 5% chance of obtaining the result by chance alone). The critical value depends on the degrees of freedom (df), which for an unpaired t-test with two samples of size and is .
Understanding the Question
The student has 20 samples from each of two tubers. They will calculate and need to decide if the difference in water potential is significant. The question asks for the interpretation of the value.
Approach
Identify the degrees of freedom, find the critical value at , and decide what the comparison means.
Step-by-Step Reasoning
- Number of samples: (old tuber central), (new tuber central).
- Degrees of freedom: .
- At and df = 38, the critical value of is approximately 2.024 (from a standard table). The mark scheme requires you to look it up in a probability table.
- Compare the calculated with the critical value:
- if the calculated is greater than the critical value, the difference between the two means is statistically significant (the null hypothesis of no difference is rejected);
- if the calculated is less than (or equal to) the critical value, the difference is not statistically significant (the null hypothesis is not rejected).
The mark scheme also accepts the idea of "rejecting the null hypothesis" in place of a numerical comparison, but the comparison with the critical value is the standard wording.
Key Takeaways
- Degrees of freedom for an unpaired t-test = .
- A calculated greater than the critical value at means the difference is statistically significant.
- A calculated less than (or equal to) the critical value means the difference is not statistically significant.
Common Mistakes
- Using the wrong degrees of freedom — for two independent samples the correct formula is , not (which gives the same answer here, but be careful in general).
- Using instead of — the standard significance level is unless otherwise stated.
- Saying "the difference is significant" without reference to a comparison with a critical value at a stated probability.
- Confusing "higher is more significant" with "higher is more significant" — once is fixed, it is the size of that matters.
Things to Be Careful About
- The mark scheme requires a probability value (0.05), a comparison (higher/lower than critical) and the degrees of freedom; for 2 marks aim to give all three elements.
- The mark scheme accepts "reject the null hypothesis" as an alternative to "higher/lower than critical".
- A two-tailed test is appropriate here because there is no prior prediction about which mean should be larger.
From the readings in Fig. 1.3 the student concluded that
- the tissue in the old tuber close to the growing shoot has the lowest water potential.
- in the old tuber close to a growing shoot, starch reserves were being converted to sugar.
- in the old tuber central region, starch was being converted to sugar.
- in the newly formed tuber all the sugar had been converted to starch.
With reference to Fig. 1.3, state the evidence that supports these conclusions and the evidence that does not support these conclusions.
evidence to support these conclusions
evidence that does not support these conclusions
Answer
Evidence to support the conclusions (any 2):
- The curve for the old tuber near the new shoot crosses the -axis (no change in mass) at the highest sucrose concentration (about 0.55–0.6 mol dm⁻³), so this tissue has the lowest water potential — supporting the first conclusion.
- The same curve is the highest across the whole range, showing the greatest change in mass at low sucrose concentrations (less than 0.5 mol dm⁻³) — again consistent with the most-negative water potential — supporting the first conclusion.
- The water potential of the central region of the old tuber (curve crosses zero at about 0.4 mol dm⁻³) is lower than the water potential of the central region of the newly formed tuber (curve crosses zero at about 0.2 mol dm⁻³), consistent with more dissolved solutes (sugar) in the old tuber — supporting the second and third conclusions.
- The newly formed tuber curves (both near bud and central) cross the -axis at the lowest sucrose concentrations, consistent with the least dissolved solute in the cells — supporting the fourth conclusion.
Evidence that does not support the conclusions (any 2):
- The graph only shows total water potential, not which solutes are present; it cannot directly distinguish starch (insoluble) from sugar (soluble), so the specific claims about starch ⇌ sugar conversion are inferred rather than measured.
- There are no replicates shown in Fig. 1.2 / 1.3, so the reliability of the readings cannot be judged.
- There are too few data points (only five concentrations) to determine precisely where each curve crosses zero, so the water-potential estimates are approximate.
Support: highest crossing-point and largest change for old tuber near shoot; lower water potential in old central than new central. Against: data show only water potential, not which solute; no replicates; too few data points.
Background Concept
Fig. 1.3 plots percentage change in mass against sucrose concentration for four tissue samples. Where each curve crosses the -axis (no change in mass), the water potential of the tissue equals that of the surrounding solution. The further to the right the crossing point, the lower the tissue water potential (because a more concentrated — more negative — solution is needed to balance it). Starch is insoluble and contributes little to water potential; soluble sugars (sucrose, glucose, fructose) lower the water potential of the cell sap. So a lower water potential is consistent with a higher concentration of soluble sugar.
Understanding the Question
The student has reached four conclusions:
- The old tuber near the growing shoot has the lowest water potential.
- In the old tuber near a growing shoot, starch reserves are being converted to sugar.
- In the central old tuber, starch is being converted to sugar.
- In the newly formed tuber, all the sugar has been converted to starch.
The question asks, with reference to Fig. 1.3, what evidence supports these conclusions and what evidence does not. The mark scheme gives up to 2 points in each direction (max 3 overall).
Approach
Look at the position of each curve and where it crosses zero, and decide what those features imply. Then ask: can the data really tell us about starch and sugar specifically?
Step-by-Step Reasoning
Support (any 2):
- The curve for the old tuber near the new shoot crosses zero at the highest sucrose concentration (≈ 0.55–0.6 mol dm⁻³) → this is the lowest water potential → supports conclusion 1.
- Across the whole range, the old-tuber-near-shoot curve lies above the others → greatest mass change at low concentrations → again consistent with the most-negative water potential → supports conclusion 1.
- The old tuber central curve crosses zero at a higher sucrose concentration than the new tuber curves → more negative water potential → more solutes (consistent with sugar) → supports conclusions 2 and 3 by inference from a lower water potential.
- The new tuber curves cross zero at the lowest sucrose concentration (≈ 0.2 mol dm⁻³) → least solutes in solution inside the cells → consistent with little or no soluble sugar present → supports conclusion 4.
Against (any 2):
- The graph shows only the total water potential of the tissue. It cannot directly distinguish between starch and sugar — these are not measured. So the specific claims about starch ⇌ sugar conversion are an interpretation, not a direct measurement.
- There are no replicates in Fig. 1.2 / 1.3, so the data are not reliable enough to support a strong conclusion.
- The data are sparse (only five sucrose concentrations across the range) so the exact point of zero change in mass is uncertain; a more precise conclusion would need more data points (intermediates), especially around the crossing point.
Key Takeaways
- A curve crossing zero at a higher sucrose concentration indicates a lower tissue water potential.
- Water potential is determined by soluble solutes — starch (insoluble) does not affect it.
- Conclusions that go beyond what the data directly show (here, claims about starch ⇌ sugar) need separate biochemical evidence to support them.
- Reliability and resolution (number of data points) affect the strength of any conclusion.
Common Mistakes
- Confusing starch with sugar when interpreting water potential: starch is insoluble and does not lower water potential; only soluble sugars do.
- Stating that the data "show that starch has been converted to sugar" — the data only show that the water potential is lower, which is consistent with more sugar but does not directly prove conversion.
- Saying "the range of sucrose concentrations is not wide enough" — the mark scheme explicitly rejects this; the issue is the small number of data points / lack of replicates, not the breadth of the range.
Things to Be Careful About
- The mark scheme requires evidence from the figure (positions of curves, specific concentration values), not a general discussion.
- The "evidence against" must address the data, not the biology — e.g. do not argue about dormancy here, just point out what the data do and do not show.
Suggest what further investigations the student could do to provide more support for the conclusions about starch and sugar in the storage tissue.
Answer
- Use the iodine test to test for starch and Benedict's (or Fehling's) test to test for reducing sugar / sucrose on tissue samples from the same four regions of the tubers. Make the tests quantitative or semi-quantitative: for iodine, prepare a starch calibration curve or use a colorimeter to measure the intensity of the blue-black colour; for Benedict's, filter and weigh the precipitate, or use a colorimeter to measure the intensity of the orange colour.
- Repeat the tests at intervals over the lifetime of the tuber (e.g. monthly, from formation through dormancy and shoot emergence) so that any change in the amount of starch or sugar with age can be followed.
Named quantitative tests for starch and sugar, repeated over time on tissue from the same regions.
Background Concept
The conclusion that starch is being converted to sugar (or vice versa) is an inference from water potential, not a direct observation. To test the conclusion directly, the actual amounts of starch and of soluble sugar in the tissue must be measured. Standard biochemical tests:
- Iodine test for starch: iodine solution turns blue-black in the presence of starch. The intensity of the colour depends on the amount of starch; a colorimeter or a starch calibration curve gives a quantitative or semi-quantitative reading.
- Benedict's test (or Fehling's) for reducing sugars: heating with Benedict's reagent gives an orange-red precipitate; the amount of precipitate (or its colour intensity) is proportional to the amount of reducing sugar. Non-reducing sugars (e.g. sucrose) must be hydrolysed first (e.g. with dilute HCl, then neutralised) before being tested with Benedict's.
A single measurement in time is only a snapshot; to show that starch is being converted to sugar, the change in starch and sugar amounts must be tracked over the life of the tuber.
Understanding the Question
The student has inferred from water-potential measurements that starch reserves are being mobilised (or that sugar is being stored). The question asks what further investigations would provide more direct support for the conclusion.
Approach
A two-mark question. The mark scheme credits: (1) named tests for starch and/or sugar; (2) a quantitative / semi-quantitative method; (3) the idea of testing over time. Aim for at least two of these in the answer.
Step-by-Step Reasoning
- Named tests: iodine for starch, Benedict's (or Fehling's) for reducing sugars; if testing for sucrose, hydrolyse it first.
- Quantitative / semi-quantitative: for iodine, prepare a starch calibration curve (iodine + known starch concentrations) and read off the sample, or measure the absorbance with a colorimeter; for Benedict's, filter and weigh the precipitate or use a colorimeter on the coloured solution.
- Over time: take samples at intervals (e.g. weekly or monthly) from the same regions of the same tubers and follow the starch and sugar concentrations through dormancy and shoot emergence. A pattern of starch decreasing while sugar increases during sprouting would directly support the "starch → sugar" conversion.
Key Takeaways
- A direct test for the conclusion requires measuring starch and sugar, not just water potential.
- Iodine and Benedict's are the standard named tests.
- A quantitative or semi-quantitative method allows the change to be tracked.
- Repeated sampling over time turns a snapshot into a trajectory.
Common Mistakes
- Vague: "test for starch and sugar" without naming a specific test or without a quantitative element.
- Forgetting that Benedict's detects reducing sugars; sucrose must be hydrolysed first.
- Only giving a single time-point — the mark scheme credits the idea of testing over time.
Things to Be Careful About
- The mark scheme accepts "find the amount" for either starch or sugar; methods like the starch calibration curve, iodine colorimetry, or weighing the Benedict's precipitate are all acceptable.
- Thiosulfate titration is also a valid quantitative method for iodine and is credited by the mark scheme.
- "Investigate the amount of starch and sugar in tissues of different ages" would cover the over-time element and the named-test element in one statement.
The student found that newly formed tubers do not form shoots until a period of dormancy lasting several months has occurred.
The student investigated tissues taken from tubers of different ages to test the hypothesis
Dormancy in tubers is caused by an inhibitory growth regulator.
Suggest what results would be obtained if this hypothesis was valid.
Answer
If dormancy is caused by an inhibitory growth regulator:
- younger (dormant) tubers would have a high concentration of the inhibitor;
- older tubers (those that have completed dormancy and are beginning to sprout) would have a much lower concentration of the inhibitor;
- so as the tuber ages, the concentration of the inhibitor would fall (or disappear) just before shoot growth begins.
Younger tubers have a high concentration of inhibitor; older tubers (about to sprout) have a low concentration of inhibitor.
Background Concept
Dormancy in plant storage organs (e.g. potato tubers, buds, seeds) is often controlled by plant growth regulators. The classical model is that dormancy is induced by an inhibitor (most famously abscisic acid, ABA, although the picture in potato is more complex and involves other hormones such as ethylene and cytokinins). The hypothesis being tested here is that dormancy is caused by an inhibitory growth regulator. If the hypothesis is true, the inhibitor should be present when the tuber is dormant and decline (or be absent) when dormancy ends and shoots emerge.
Understanding the Question
The hypothesis is: "Dormancy in tubers is caused by an inhibitory growth regulator." The student has access to tubers of different ages (from newly formed to old enough to sprout). The question asks what results would be expected if the hypothesis were valid.
Approach
Translate the hypothesis into a measurable prediction. Dormancy is the state of "no shoot growth"; the hypothesis says an inhibitor is the cause. Therefore the inhibitor should be present when the tuber is dormant (young) and absent (or in lower concentration) when the tuber is no longer dormant (old, sprouting).
Step-by-Step Reasoning
- The hypothesis is that an inhibitory growth regulator prevents shoot growth during dormancy.
- A young, newly formed tuber is dormant. If the hypothesis is true, its tissues should contain a high concentration of the inhibitor.
- An old tuber that is about to form new shoots has come out of dormancy. The inhibitor should no longer be present (or should be at a much lower concentration).
- The general pattern therefore: as the tuber ages and approaches the end of dormancy, the concentration of the inhibitor falls.
- The mark scheme accepts this as 2 marks: younger tubers have higher concentrations, older tubers have lower concentrations (or vice versa if the candidate describes the trend in words).
Key Takeaways
- A hypothesis about an inhibitor leads to a simple prediction: the inhibitor should be present when the trait it suppresses is occurring, and absent when the trait is no longer occurring.
- A 2-mark question can usually be earned with two specific, testable predictions (one per age group).
Common Mistakes
- Vague wording such as "there would be a difference between the two" — the mark scheme wants specific concentrations (high / low) at each age.
- Confusing the inhibitor with a promoter and predicting the opposite trend.
- Describing the biology (what the inhibitor does) rather than the prediction (what the measurements should show).
Things to Be Careful About
- The mark scheme accepts either the two single statements (younger higher, older lower) or a single combined statement ("as the tuber gets older, the concentration of inhibitor decreases").
- The mark scheme also allows alternative valid ideas, e.g. that another growth regulator (a promoter such as gibberellin or cytokinin) increases as dormancy ends.
The rest of this paper
1 more questions- Q2Planning · Analysis, Conclusions and Evaluation10M