Biology 9700/53 — October/November 2010
Cambridge A-Level · Planning, Analysis and Evaluation · worked solutions for every part, with the mark scheme
Topics Planning · Analysis, Conclusions and Evaluation
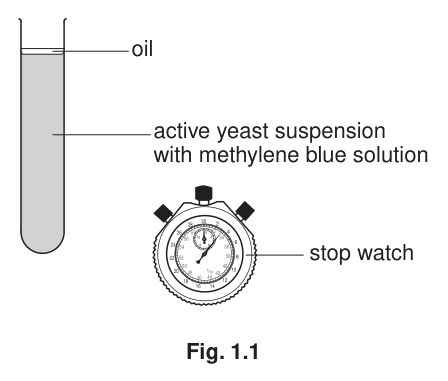
Fig. 1.1 shows a simple apparatus used by a student to measure the rate of respiration in the yeast Saccharomyces cerevisiae.
Active yeast suspension is a pale cream colour. It is prepared by mixing dry yeast, glucose and water and leaving for 1 hour at . The methylene blue solution acts as an electron acceptor and becomes colourless when reduced.
State how the dependent variable is measured in this experiment.
Explain why the layer of oil is needed.
Outline how the student could use this apparatus to find the optimum temperature for the respiration of yeast.
In a further investigation, the student tested the ability of yeast to use different sugars. Active yeast suspensions were mixed with 2% solutions of six different sugars. The yeast was allowed to metabolise the sugars at its optimum temperature and the carbon dioxide released was collected for a 10 minute period.
Table 1.1 shows the student’s results.
Table 1.1
| volume of carbon dioxide in 10 mins / | ||||||
|---|---|---|---|---|---|---|
| monosaccharides | disaccharides | |||||
| glucose (glu) | fructose (fru) | galactose (gal) | sucrose (glu + fru) | maltose (glu + glu) | lactose (glu + gal) | |
| 1 | 2.0 | 5.0 | 0.1 | 3.0 | 1.4 | 0.3 |
| 2 | 2.2 | 3.8 | 0.3 | 2.6 | 1.7 | 0.4 |
| 3 | 2.4 | 4.6 | 0.2 | 3.6 | 1.3 | 0.6 |
| mean | 2.2 | 4.5 | 0.2 | 3.1 | 1.5 | 0.4 |
Suggest an explanation for these results.
Based on these observations, the student made a hypothesis:
The yeast will form more cells when provided with fructose than with glucose.
Table 1.2 shows the results of counting cell samples from the active yeast suspension that had been supplied with fructose or glucose and left at the optimum temperature for 30 minutes. Three samples were taken from each suspension and the cells counted using a microscope slide with a grid. Four counts were made from each sample and the number of cells per calculated.
Table 1.2
| fructose number of cells per | glucose number of cells per | |||||||||
|---|---|---|---|---|---|---|---|---|---|---|
| count 1 | count 2 | count 3 | count 4 | mean | count 1 | count 2 | count 3 | count 4 | mean | |
| sample 1 | 52 | 75 | 62 | 56 | 53 | 55 | 48 | 54 | ||
| sample 2 | 58 | 66 | 71 | 46 | 62 | 45 | 52 | 51 | 52 | 51 |
| sample 3 | 65 | 61 | 68 | 64 | 53 | 53 | 42 | 54 |
The student then calculated the standard error for these results.
The standard deviation for fructose = 8.11 = 8 cells
The standard error for fructose = 2.30 = 2 cells
The formula for standard error is:
= standard deviation
= number of samples
Complete the calculation to find the value of for glucose.
Show your working. State your answer to the nearest whole cell.
= ______
State what standard deviation shows.
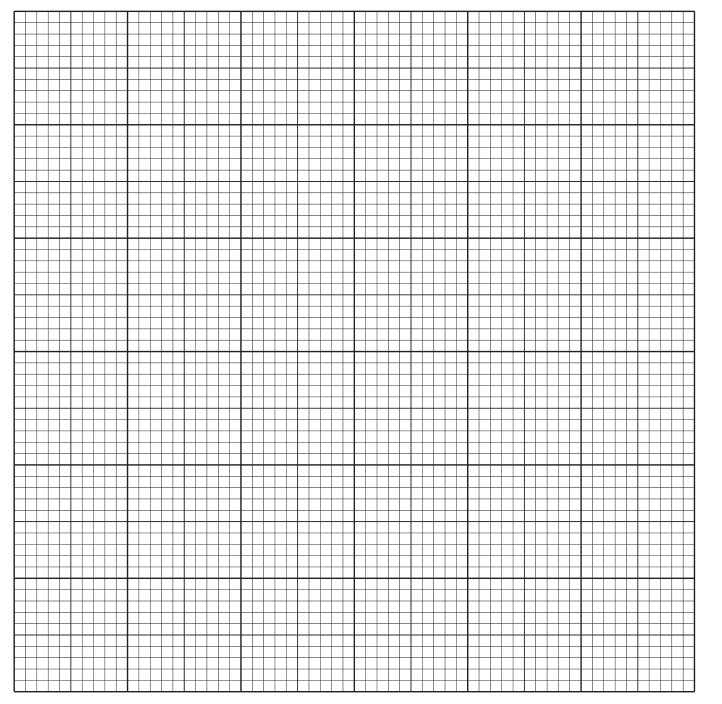
Use the grid to plot the data in Table 1.2 to show the difference in the mean population size of yeast supplied with fructose and yeast supplied with glucose. Include error bars.
State whether the data support the hypothesis. Give a reason for your answer.
The rest of this paper
1 more questions- Q2Planning · Analysis, Conclusions and Evaluation9M