Biology 9700/52 — October/November 2010
Cambridge A-Level · Planning, Analysis and Evaluation · worked solutions for every part, with the mark scheme
Topics Planning · Analysis, Conclusions and Evaluation
A student noticed that the leaves on a plant growing close to a wall had two sorts of leaves. The leaves next to the wall were in the shade and looked different from the leaves on the side away from the wall that were exposed to the sun. The length of the internodes on the stem also looked different.
The student decided to investigate the differences by measuring some features of 30 leaves and internodes from each side of the plant.
Fig. 1.1 shows the leaf shape Fig. 1.2 shows an internode
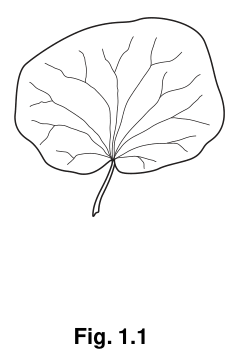
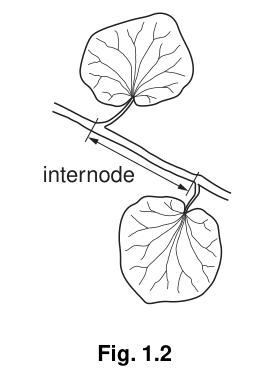
Table 1.1 shows the student’s results.
Table 1.1
| shaded leaves | exposed leaves | |
|---|---|---|
| mean internode length / | ||
| mean surface area of leaves / | ||
| mean mass of leaves / | ||
| mean leaf surface area : leaf mass ratio | ||
| rate of water loss / |
State the independent variable being investigated.
Answer
Light intensity (or exposure to light).
Light intensity / exposure to light
Background Concept
An investigation has an independent variable (the factor the investigator deliberately varies), a dependent variable (the factor measured to see the effect) and controlled variables (factors kept constant). In this investigation the student noticed that leaves on the wall-facing side of the plant were in shade, while those on the other side were exposed to the sun. The plant is responding to the differing light it receives, so the factor that has been allowed to vary between the two samples is the light environment.
Understanding the Question
The question asks the candidate to state, in a single phrase, what has been deliberately varied between the shaded-side sample and the exposed-side sample. The mark scheme rejects answers that simply say "light" because light is a broad term — the same plant receives light from the same source, but the intensity reaching each side differs. It also rejects answers referring to the position of the plant in the shade/sun, because position is not itself the variable, only a proxy for it.
Approach
Identify the factor that differs systematically between the two groups of leaves. The plant is in one place; what differs is how much light each side of the canopy receives.
Step-by-Step Reasoning
- The two sets of leaves experience different light conditions: low light (shade) on one side, high light (sun) on the other.
- The independent variable is therefore the intensity of light reaching the leaves, or equivalently their light exposure.
- "Light" alone is too vague — the mark scheme requires "light + intensity/exposure" to earn the mark.
- "Position in shade/sun" is rejected because it describes the location rather than the environmental factor that is actually differing.
Key Takeaways
- The independent variable is the factor deliberately varied (here, the light intensity falling on each set of leaves).
- CIE mark schemes often reject unqualified biological terms; "intensity" or "exposure" must accompany "light".
Common Mistakes
- Writing only "light" — the mark scheme explicitly does not credit this.
- Writing "position in the shade" or "side of the plant" — these are not the environmental variable, only a description of where the leaves are.
- Confusing the independent variable with the dependent variables (surface area, mass, internode length, water loss), which are the things being measured.
Things to Be Careful About
- Be precise: include "intensity" or "exposure" alongside "light".
- The dependent variables (the things being measured) are not the independent variable.
Outline the procedures the student could use to obtain these results.
Answer
Sampling (independent variable):
- Obtain leaves systematically from each side, e.g. take the 3rd leaf from the apex on the shaded and exposed sides, ensuring comparable leaf age and position on the plant.
Surface area:
- Place each leaf on 1 cm² graph paper (or under a transparent grid) and trace the outline.
- Count whole squares inside the outline and add estimates of partially covered squares to obtain the surface area.
- Repeat for the underside of the leaf and add the two values to give the total surface area.
Mass:
- Weigh each fresh leaf on a digital balance (record in mg).
- For dry mass, dry the leaves in an oven at a low temperature until the mass is constant, then reweigh.
Internode length:
- Use a ruler to measure the length of each internode (the stem between two adjacent nodes) in mm, either on the plant or on a cut section of stem.
Water loss:
- Use a potometer to measure the rate of water uptake (an estimate of transpiration rate).
- Alternatively, weigh a leaf or a sealed plastic bag enclosing the leaf at the start and after a set time, and calculate the mass lost per mm² per hour.
- Keep environmental conditions (temperature, humidity, air movement) constant when measuring water loss.
Reliability:
- Use all 30 leaves and 30 internodes from each side.
- Calculate the mean for each variable on each side.
- Calculate the standard deviation to indicate the spread of the data.
- Calculate the surface area : mass ratio for each leaf and then the mean ratio.
Safety:
- Low-risk practical; use tongs when removing leaves from the oven and allow them to cool before weighing.
See working
Background Concept
Plants respond plastically to their light environment, producing leaves with different morphologies and anatomies on shaded versus exposed sides (a phenomenon called leaf heteroblasty or photomorphogenesis). To compare these responses objectively, the student must take a defined number of leaves/internodes and measure several features quantitatively: surface area, mass, internode length and water-loss rate. Each measurement requires a defined, repeatable technique so the results from the two sides can be compared meaningfully.
Understanding the Question
The question awards 8 marks for outlining the procedures needed to obtain the values in Table 1.1. The mark scheme is structured as a checklist of 14 possible marking points (the best 8 are credited), covering: a systematic sampling method; surface area (method, calculation, both sides); mass (method, dry mass); internode length; water loss (method, transpiration apparatus, controlled environment); safety; and reliability (mean, standard deviation, SA:mass ratio).
Approach
The candidate should work through the variables in turn: (1) how to obtain the leaves, (2) how to measure each feature, and (3) how to ensure the data are reliable. A concise bullet list that hits at least 8 of the 14 possible points will earn full marks.
Step-by-Step Reasoning
- Sampling: Pick leaves at the same developmental position on each side (e.g. the 3rd leaf from the apex) so that any differences in morphology are due to light, not to leaf age. Always include all 30 leaves/internodes on each side to support a statistical comparison.
- Surface area: A leaf is two-dimensional, so a 1 cm² grid (or transparent grid placed over the leaf) gives a direct count of mm². Count whole squares and combine with estimates of partially-covered squares; remember that a leaf has two sides, both of which contribute to the surface area available for gas exchange.
- Mass: A digital balance gives mass in mg to 1–2 decimal places. A dry mass is obtained by drying the leaf in an oven (typically ~60–80 °C) until successive weighings differ by less than a stated tolerance — this ensures all water is removed and the result is the mass of the structural tissue alone.
- Internode length: A simple ruler (or string + ruler) is sufficient, measured between two adjacent nodes on the stem.
- Water loss: A potometer directly measures the rate of water uptake, which approximates transpiration rate in a leafy shoot. Alternatively, weigh a leaf (or a sealed plastic bag enclosing the leaf) at the start and after a stated time interval. Either way, the environmental conditions (temperature, humidity, air movement, light) must be kept constant so that the rate reflects the leaf's properties, not a change in the surroundings.
- Reliability: Calculate the mean of all 30 measurements on each side, and quote the standard deviation to show the spread. The ratio of surface area to mass is a derived (compound) variable — calculate it for each leaf and then average.
- Safety: This is a low-risk practical; the only real hazard is the hot oven, so allow leaves to cool before weighing and handle with tongs.
Key Takeaways
- A good procedure specifies the technique, the controls, and the reliability statistics.
- Each quantitative measurement in Table 1.1 (surface area, mass, length, water loss) requires a specific, defined method.
- Remember both sides of a leaf contribute to its total surface area.
- Standardising the environment during the water-loss measurement is essential; otherwise the comparison is confounded.
Common Mistakes
- Vague statements such as "measure the leaves" or "find the area" with no detail of how (grid, squares, balance, ruler).
- Forgetting to include the underside of the leaf in the surface-area measurement.
- Using only fresh mass and ignoring dry mass.
- Failing to control the environment when measuring water loss (temperature, humidity, air movement all change the rate).
- Quoting "a mean of three" or a single value rather than the mean of all 30 measurements.
Things to Be Careful About
- The mark scheme rejects "mean of three" but accepts "mean of the whole sample" (all 30 leaves/internodes).
- The student does not need to plant seeds or grow plants — ignore any reference to that; the data come from the existing plant.
- "Standard deviation" is a markable idea, but the mark scheme says the formula is ignored — only the idea of calculating it is needed.
- The student is not asked to construct a results table or to plot a graph; the table is given.
The student carried out -tests for leaf surface area : leaf mass ratio and for internode length.
The leaf surface area : leaf mass ratio gave the value
The formula for -test is
Complete the calculation to find the value of for the internode length.
Show your working.
= ______
Working
Answer
t = 8.9
8.9
Background Concept
The t-test compares the means of two independent samples and tests whether the difference between them is statistically significant or could reasonably be due to chance. The formula given is the standard two-sample t-test:
The numerator is the absolute difference between the two sample means. The denominator is the standard error of the difference between the means, which combines the spread (variance, ) of each sample and its size (). A large t value (numerator much larger than the standard error) indicates the means are genuinely different.
Understanding the Question
The student must fill in the missing numbers in the formula for the internode length t-test, using the shaded and exposed values from Table 1.1. The given values are:
- Shaded: mean , ,
- Exposed: mean , ,
The formula already has the term filled in (because ), and the denominator 0.9 is given as a pre-computed value; the student must complete the missing blanks and obtain the final value.
Approach
- Substitute the means and standard deviations into the numerator and the missing denominator term.
- Simplify the numerator: .
- Simplify the denominator: , and the given 0.9 is this value rounded.
- Divide: .
Step-by-Step Reasoning
- The blanks to fill in are: numerator and ; the second term of the denominator (i.e. numerator 9 or , denominator 30); the simplified numerator 8; the final value 8.9.
- Calculate the standard error of the difference: (the value given in the question).
- Substitute: , which rounds to (the mark scheme also accepts 8.89 or 8.88…8).
- This value, alongside the surface-area-to-mass-ratio , will be compared with the critical value in (b)(iii).
Key Takeaways
- The t-test formula combines the difference of means (top) with the standard error of the difference (bottom).
- A large value means the two means are separated by many standard errors and is unlikely to be a chance finding.
- The denominator 0.9 has been rounded to 1 significant figure, so the final is itself approximate (8.8 or 8.9 are both acceptable).
Common Mistakes
- Using the wrong standard deviation in the missing term (e.g. writing 4 instead of 3).
- Forgetting to subtract to get the numerator 8.
- Dividing 8 by an unrounded denominator (0.913) and getting 8.8 — this is not wrong, but the mark scheme gives 0.9 in the question, so 8.9 is the expected answer.
- Reporting an answer without working (the mark scheme says "ignore any working in the answer", but the working is needed for credit on the substitution marks).
Things to Be Careful About
- The formula uses the squared standard deviations ().
- The denominator combines the two variances, not their average.
- The absolute value bars mean the order of the two samples does not matter.
Table 1.2 shows the critical values at for the -test.
Table 1.2
| degrees of freedom | 18 | 20 | 21 | 22 | 23 | 24 | 25 | 26 | 27 | 28 | 29 | 30 | 40 | 60 | |
|---|---|---|---|---|---|---|---|---|---|---|---|---|---|---|---|
| critical value | 2.10 | 2.09 | 2.08 | 2.07 | 2.06 | 2.06 | 2.06 | 2.06 | 2.05 | 2.05 | 2.04 | 2.04 | 2.02 | 2.00 | 1.96 |
The number of degrees of freedom is 58.
State how the number of degrees of freedom was calculated.
Answer
Degrees of freedom = (n₁ − 1) + (n₂ − 1) = (30 − 1) + (30 − 1) = 58
(30 − 1) + (30 − 1) = 58
Background Concept
The degrees of freedom (df) is the number of independent pieces of information used to estimate a statistical parameter. For a two-sample t-test, each sample contributes df because, once the mean of the sample is fixed, only of the individual values are free to vary — the last one is determined. The two samples' df are added together.
Understanding the Question
The question states that the number of degrees of freedom is 58 and asks the candidate to show how this number was obtained. The candidate must give the formula and the substitution.
Approach
Use the standard two-sample t-test formula:
With , this becomes .
Step-by-Step Reasoning
- (shaded side), (exposed side).
- .
- Equivalently, (this is also accepted by the mark scheme).
Key Takeaways
- For a two-sample t-test, df = .
- df is needed to look up the critical value in the table at the appropriate probability level.
Common Mistakes
- Writing (no subtraction of 2).
- Writing (this is the degrees of freedom for a chi-squared test of independence, not a t-test).
- Confusing degrees of freedom with sample size or standard error.
Things to Be Careful About
- The formula is for a two-sample t-test; a one-sample t-test would have df.
- The critical value at 58 df is read from the closest row of the table (df = 60 gives 2.00; at 58 df the critical value is essentially 2.00).
State and explain the meaning of these results.
Answer
Both calculated t values (12.6 for the surface area : mass ratio and 8.9 for the internode length) are greater than the critical value at 58 degrees of freedom (≈ 2.00). The differences between the shaded and exposed sides are therefore statistically significant and are not due to chance; they are most likely caused by the difference in light exposure between the two sides of the plant.
Both differences are statistically significant (not due to chance) and are likely caused by the difference in light exposure between the two sides.
Background Concept
Once a t-value has been calculated, it is compared with a critical value at the chosen probability level (here ) and the appropriate degrees of freedom. The critical value is the t-value that would be expected by chance only 5% of the time if the two samples were drawn from the same population. If the calculated t exceeds the critical value, the null hypothesis (that there is no difference between the two means) is rejected, and the difference is said to be statistically significant.
Understanding the Question
The candidate must state and explain the meaning of the t-test results from (b)(i). The two tests are:
- surface area : mass ratio: (given in the question)
- internode length: (calculated in (b)(i))
The number of degrees of freedom is 58 (from (b)(ii)).
Approach
- Look up the critical value at 58 df and . From the table, df = 60 gives 2.00; at 58 df the critical value is essentially 2.00.
- Compare both calculated t values with the critical value.
- State the conclusion in plain language.
Step-by-Step Reasoning
- Critical value at 58 df, ≈ 2.00.
- ✓ — the surface-area-to-mass ratio differs significantly between the two sides.
- ✓ — the internode length also differs significantly between the two sides.
- Both results are statistically significant: the probability of obtaining such large differences by chance is less than 5% (in fact, very much less).
- Because the only systematic difference between the two sides is light exposure, the most plausible cause of the differences is the differing light environment.
Key Takeaways
- A t-value larger than the critical value rejects the null hypothesis at that probability level.
- The conclusion should always link the significance to the biology: here, the significant differences are attributed to light exposure.
- A "significant" statistical result does not prove cause and effect, but in a controlled comparison it is the best evidence available.
Common Mistakes
- Saying only "the t values are different" without comparing them to the critical value.
- Saying "the null hypothesis is accepted/rejected" without explaining what this means in the context of the data.
- Stating significance without linking it to the biological cause (light exposure).
- Forgetting to mention both t values (the mark scheme credits a comparison of both).
Things to Be Careful About
- The mark scheme ignores any reference to the null hypothesis unless it is explained. A bare statement like "reject the null hypothesis" is not credited; the candidate must say what the rejection means.
- "Significant" here means statistically significant — it does not necessarily mean a large difference in absolute terms.
- The candidate can still obtain these marks even if (b)(i) is omitted (ecf).
In a further investigation, the student cut sections of the leaves from the shaded side and from the exposed side of the plant. The following procedures were carried out:
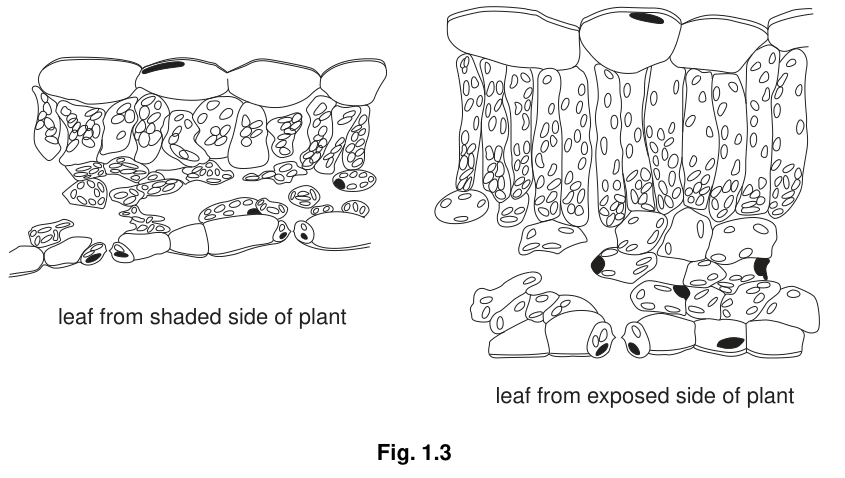
Transverse sections were made of each leaf and high-power drawings were made from these sections. The relative thickness of both the leaf and the cuticle were measured using an eyepiece graticule and the difference in the distribution of chloroplasts was observed.
Fig. 1.3 shows drawings made from transverse sections of these leaves.
Explain how the actual thickness of the leaf could be measured.
Answer
Calibrate the eyepiece graticule by aligning it with a stage micrometer (which has a scale of known length) and counting the number of graticule units that correspond to a known length on the stage micrometer. Then count the number of graticule units across the thickness of the leaf and multiply by the calibrated value of one unit to give the actual thickness of the leaf.
Count the number of graticule units across the leaf thickness, then multiply by the value of one unit (calibrated using a stage micrometer).
Background Concept
An eyepiece graticule is a small scale (usually 100 divisions) etched onto a disc that sits in the eyepiece of a microscope. The divisions have no fixed length — the apparent length of one division depends on the magnification of the objective lens. To convert graticule units into real units (mm, µm), the graticule must be calibrated against a stage micrometer, which is a slide with a scale of known length (typically 1 mm divided into 100 parts, each 10 µm).
Understanding the Question
The question asks the candidate to explain how the actual thickness of the leaf (in mm or µm) can be determined using the eyepiece graticule. The drawings in Fig. 1.3 are made at high power, so the graticule must first be calibrated at that magnification.
Approach
- Calibrate the eyepiece graticule using a stage micrometer at the same magnification used to view the leaf section.
- Measure the leaf thickness by counting the number of graticule units that span it.
- Convert the graticule units to a real length by multiplying by the calibration value.
Step-by-Step Reasoning
- Place the stage micrometer on the stage and focus on its scale. Align the graticule and micrometer scales so that a whole number of graticule units coincides with a whole number of micrometer divisions.
- For example, if 10 graticule units = 0.1 mm on the stage micrometer, then 1 graticule unit = 0.01 mm = 10 µm.
- Remove the stage micrometer and replace it with the leaf section. Count the number of graticule units that span the leaf from the upper to the lower epidermis.
- Multiply: actual thickness = (number of graticule units) × (calibration value).
- The result is the actual leaf thickness in mm or µm, depending on the units used in the calibration.
Key Takeaways
- An eyepiece graticule on its own is meaningless — it must be calibrated at every magnification used.
- A stage micrometer is the standard tool for this calibration.
- The two marking points are: (1) counting the graticule units, and (2) calibrating with a stage micrometer (or describing how one unit is given a value).
Common Mistakes
- Forgetting the calibration step (the graticule units have no intrinsic value).
- Saying "use a ruler" — rulers are not accurate at microscope magnifications.
- Failing to mention both sides of the leaf or both the shaded and exposed sections (the candidate must measure both for the comparison).
- Confusing the eyepiece graticule with the stage micrometer.
Things to Be Careful About
- Calibration must be done at the same objective lens magnification that is then used to view the leaf.
- The calibration value should be quoted to a sensible number of significant figures (e.g. 10 µm per division, not 0.00001 m per division).
With reference to the student’s results, state what conclusions can be drawn about the differences in adaptations shown by shaded leaves and exposed leaves of the plant.
Answer
-
Shaded leaves have a larger surface area (mean 2750 mm² vs 1800 mm²) and a higher surface area : mass ratio (55 vs 30). The larger area and thinner leaf tissue spread the available chloroplasts over a wider area, increasing light absorption in low light and so maximising photosynthesis when light is limited.
-
Exposed leaves have a thicker cuticle and more densely packed mesophyll cells with smaller air spaces, which reduces water loss by evaporation from the leaf surface. The smaller surface area (1800 vs 2750 mm²) further reduces the area from which water can be lost by transpiration.
-
Together, these differences show that the plant shows phenotypic plasticity: shaded leaves are adapted to maximise light capture (for photosynthesis in low light), whereas exposed leaves are adapted to minimise water loss (when light is abundant but transpiration risk is high).
See working
Background Concept
Many plants show phenotypic plasticity — different phenotypes produced by the same genotype in different environments. Shade leaves (sciomorphs) typically have a large surface area, a thin cuticle, a thin palisade mesophyll and loosely packed spongy mesophyll with large air spaces, all adaptations that maximise light capture and gas exchange in light-limited conditions. Sun leaves (xeromorphs) are typically smaller, with a thicker cuticle, a thicker palisade mesophyll packed with chloroplasts, and more densely packed spongy mesophyll with smaller air spaces — adaptations that minimise water loss when light is abundant and transpiration is high.
Understanding the Question
The candidate must use the data in Table 1.1 and the structures shown in Fig. 1.3 to draw conclusions about adaptations. The mark scheme explicitly says: do not allow marks for answers that restate the data — the candidate must explain why the data/structures are adaptive. The mark scheme offers five mark-worthy points for shade leaves and five for sun leaves, of which the best three are credited.
Approach
For each set of leaves, identify:
- the structural/quantitative difference;
- the functional consequence (the adaptation);
- the selective advantage.
Cover both shaded and exposed leaves, focusing on the trade-off between maximising photosynthesis (shade leaves) and minimising water loss (sun leaves).
Step-by-Step Reasoning
- Shaded leaves:
- Larger surface area (2750 vs 1800 mm²) → more area to intercept the limited light → maximises light absorption for photosynthesis in low light.
- Higher surface area : mass ratio (55 vs 30) → less structural material per unit area → thinner, cheaper leaves that spread the chloroplasts over a wider area.
- Thinner cuticle and thinner leaf (one palisade layer, loosely packed spongy mesophyll) → light can penetrate to deeper chloroplasts and gas exchange is faster (larger air spaces).
- Exposed leaves:
- Smaller surface area (1800 vs 2750 mm²) → less area for transpiration → reduces water loss.
- Thicker cuticle → reduces evaporation from the epidermis.
- Two layers of palisade cells packed with chloroplasts → maximises light absorption when light is abundant.
- Densely packed mesophyll with smaller air spaces → less internal evaporation surface → reduces water loss.
- The two leaf types reflect the trade-off: shade leaves invest in light capture because light is limiting; sun leaves invest in water conservation because, with abundant light, the next limiting factor is water.
Key Takeaways
- The plant shows phenotypic plasticity in response to light availability.
- Shade leaves are adapted to maximise photosynthesis (capture more limited light).
- Sun leaves are adapted to minimise water loss (cuticle, surface area, packing).
- Quantitative data and structural observations together support the same conclusion.
Common Mistakes
- Restating the data without explaining the adaptation ("shaded leaves are bigger" — earns no marks).
- Writing about internodes or stomata (the mark scheme explicitly ignores these).
- Mixing up the adaptations: e.g. saying "shaded leaves have a thick cuticle to reduce water loss" — this is a sun-leaf adaptation.
- Not linking the structural feature to its functional consequence.
Things to Be Careful About
- The mark scheme says "look for the understanding that shade leaves have adaptations that maximise photosynthesis and sun leaves have adaptations to minimise water loss" — this is the core message.
- The candidate must make it clear which leaf type they are referring to; if the type is ambiguous, the mark may be withheld.
- "Mix and match" between sun and shade is allowed, but the same adaptation cannot earn two marks.
The rest of this paper
1 more questions- Q2Planning · Analysis, Conclusions and Evaluation10M