Biology 9700/53 — May/June 2010
Cambridge A-Level · Planning, Analysis and Evaluation · worked solutions for every part, with the mark scheme
Topics Planning · Analysis, Conclusions and Evaluation
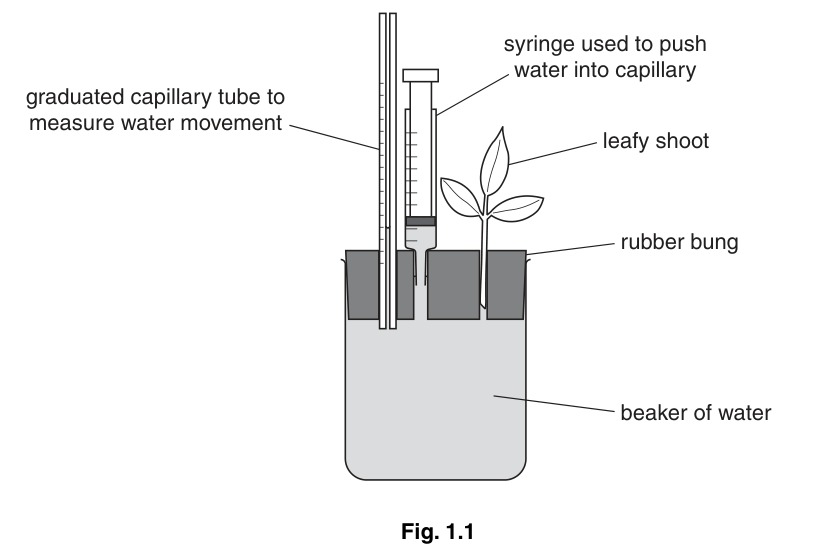
Fig. 1.1 shows one type of potometer used by a student to investigate transpiration.
Suggest a hypothesis the student could test about the transpiration of a mesophyte (a plant adapted to a moist environment) and a xerophyte (a plant adapted to a dry environment).
Answer
A mesophyte will lose more water (transpire at a higher rate) than a xerophyte.
A mesophyte will lose more water than a xerophyte.
Background Concept
Transpiration is the loss of water vapour from plant leaves, primarily through small pores called stomata. The rate of transpiration depends on environmental factors (light, temperature, humidity, wind) and on the plant's structural adaptations.
Mesophytes are plants adapted to moderately moist environments. They typically have broad, thin leaves with many stomata and a thin cuticle, giving a relatively high transpiration rate under typical conditions.
Xerophytes are plants adapted to dry environments. They have adaptations that minimise water loss:
- a thick, waxy cuticle
- sunken stomata that trap a layer of humid air
- reduced stomatal density (fewer stomata)
- leaf hairs that reduce air movement near the stomata
- rolled or smaller leaves that reduce the exposed surface area
Because of these adaptations, xerophytes generally transpire much less than mesophytes.
Understanding the Question
The question asks the student to suggest a hypothesis comparing transpiration in a mesophyte and a xerophyte. A hypothesis is a testable prediction that states the expected relationship between variables. It must:
- name both plant types
- predict which will lose more water (or transpire faster)
- be testable using the potometer shown in Fig. 1.1
The command word "suggest" allows flexibility in wording, but the mark scheme explicitly rejects the reverse prediction.
Approach
Apply knowledge of plant adaptations: xerophytes minimise water loss, so a mesophyte should transpire more. Frame this as a clear, comparative statement.
Step-by-Step Reasoning
A good hypothesis has three components:
- The independent variable — type of plant (mesophyte vs xerophyte).
- The dependent variable — rate of water loss / transpiration.
- The predicted direction.
Because xerophytes conserve water, the predicted direction is that the mesophyte loses more water. The statement "A mesophyte will lose more water than a xerophyte" satisfies all three components and is testable using the potometer.
Key Takeaways
- A hypothesis must be testable and predict the direction of the relationship.
- Xerophytes transpire less than mesophytes because of their thicker cuticle, sunken stomata and reduced stomatal density.
- Hypotheses must name the IV (type of plant) and the DV (water loss).
Common Mistakes
- Reversing the prediction (xerophyte > mesophyte) — mark scheme explicitly rejects this.
- Omitting one of the plant types.
- Including environmental conditions in the hypothesis — these are controls, not part of the prediction itself.
Things to Be Careful About
- Both "mesophyte" and "xerophyte" must appear in the hypothesis.
- The comparison must be about water loss / transpiration, not some other variable.
Using this potometer, outline a procedure that the student could use to test this hypothesis.
Answer
Independent variable
- Use leafy shoots of a mesophyte and a xerophyte with similar surface area (or the same number of leaves).
Dependent variable
- Measure the distance moved by the water (meniscus) along the graduated capillary tube over a set period of time.
Standardised variables (controls)
- Keep the same environmental conditions for both shoots (e.g. light intensity, temperature, humidity).
- Cut the shoot under water and at an angle to prevent air entering the xylem.
- Dry the leaves with a paper towel before measuring.
- Ensure an airtight seal around the shoot in the rubber bung (no air leaks).
Procedure
- Use the syringe to set the water level (meniscus) in the capillary tube.
- Leave the apparatus until a steady rate of water movement is achieved (equilibrate).
- Record the distance moved by the meniscus over a set time.
Reliability
- Repeat with at least three different shoots of each plant type and calculate a mean.
Safety
- Low-risk experiment; take care when cutting the shoot and when pushing the capillary tube through the bung.
See working.
Background Concept
A potometer measures water uptake by a leafy shoot; under steady-state conditions this equals transpiration. The apparatus shown in Fig. 1.1 consists of a leafy shoot held by a rubber bung in a beaker of water, connected to a graduated capillary tube. As the shoot transpires, water is drawn along the capillary and the meniscus moves. Measuring how far the meniscus moves in a known time gives the rate of water uptake, and hence of transpiration.
Key practical points:
- The shoot must be cut under water to prevent air entering the xylem and breaking the continuous water column (an "air lock").
- An airtight seal around the shoot prevents leaks — any gap would let water in through the bung rather than via transpiration.
- The syringe is used to reset the meniscus between readings.
- Leaves must be dry before measuring, so the water loss recorded is from transpiration, not evaporation from surface water.
Understanding the Question
This sub-part asks the student to outline a procedure to test the hypothesis from (a)(i) using the potometer in Fig. 1.1. A complete plan must specify:
- the independent variable (what is varied)
- the dependent variable (what is measured)
- the control variables (what is kept the same)
- a step-by-step method
- reliability/replication
- safety
This is a Paper 5 planning question, so all elements of good experimental design must appear.
Approach
Plan systematically: first identify what to vary (type of plant), what to measure (water movement along the capillary), what to keep the same (environmental conditions, shoot preparation, leaf state), and how to ensure reliability (repeats and a mean). Then describe the steps in a logical order, finishing with safety.
Step-by-Step Reasoning
Independent variable: use leafy shoots of a mesophyte and a xerophyte with similar surface area (or the same number of leaves). Similar surface area ensures any difference in water uptake is due to plant type, not leaf size.
Dependent variable: measure the distance moved by the water (meniscus) along the graduated capillary tube over a set period of time. The mark scheme rejects "upwards movement" because the capillary may be mounted vertically or horizontally — what matters is the distance moved.
Standardised variables (controls):
- Same environmental conditions: keep light intensity, temperature and humidity the same for both shoots. The apparatus should be set up in the same location for each trial.
- Cut the shoot under water and at an angle. Cutting under water prevents air from entering the xylem. Cutting at an angle exposes more xylem vessels and prevents the cut surface sitting flat against the bung.
- Dry the leaves with a paper towel before measuring, so the water loss recorded is from transpiration, not surface evaporation.
- Ensure an airtight seal around the shoot in the rubber bung. Any leak would allow water to be drawn in from outside, giving an inaccurate reading. The mark scheme ignores "watertight" but accepts "airtight".
Procedure:
- Use the syringe to push water into the capillary tube and set the meniscus to a convenient starting position.
- Leave the apparatus until water movement is at a steady/constant rate (equilibrate). Initially the rate may fluctuate as the system adjusts; only steady-state readings reflect true transpiration.
- Record the distance moved by the meniscus over a set time.
Reliability:
- Repeat with at least three different shoots of each plant type and calculate a mean. Repeats allow identification of anomalous results and reduce the effect of random variation.
Safety:
- This is a low-risk experiment. Take care when cutting the shoot (sharp blade) and when pushing the capillary tube through the bung — capillary tubes are fragile and can cut skin if they break, so use a towel for grip.
Key Takeaways
- A good experimental plan identifies IV, DV, controls, method, replication and safety.
- Potometer work demands careful shoot preparation to avoid air locks and leaks.
- Steady-state readings are essential for a valid rate measurement.
Common Mistakes
- Forgetting to standardise variables such as surface area, environmental conditions or shoot preparation.
- Stating the water moves "upwards" — mark scheme rejects this wording.
- Citing inappropriate timescales (e.g. seconds) — choose an interval giving a measurable distance.
- Saying "watertight" instead of "airtight" — watertight does not address air leaks into the apparatus.
Things to Be Careful About
- The shoot must be airtight in the bung; the rest of the apparatus does not need to be airtight.
- Cutting under water and at an angle are two separate ideas; the mark scheme requires both.
- Repeat at least three times and calculate a mean for reliability.
The capillary tube measures the distance moved by the water. Explain how the actual volume of water lost can be calculated.
Answer
Find the cross-sectional area of the capillary tube () and multiply by the distance moved by the water:
OR
Push water back to the original position with the syringe and read off the volume of water displaced.
Volume = cross-sectional area () × distance moved.
Background Concept
A graduated capillary tube has a constant, very small internal cross-sectional area — a circle of radius , so area . When water moves along the tube, the volume of water that has passed any point equals the cross-sectional area multiplied by the distance moved.
This is exactly the formula for the volume of a cylinder:
where is the length of the cylinder (here, the distance moved by the water).
Understanding the Question
The capillary tube measures only a linear distance (how far the meniscus has moved). The question asks how this distance is converted into the actual volume of water lost.
Approach
Two approaches are valid: (1) calculate the volume geometrically from the capillary's cross-section, or (2) use the syringe to push water back to the original meniscus position and read the volume directly from the syringe's scale.
Step-by-Step Reasoning
Approach 1 — geometric calculation:
- Measure the internal radius (or diameter) of the capillary tube.
- Calculate the cross-sectional area: .
- Multiply by the distance moved: .
The mark scheme accepts any equivalent form of the volume formula:
Approach 2 — syringe calibration:
- After the water has moved, use the syringe to push water back to the original meniscus position.
- Read the volume of water displaced directly from the syringe's graduated scale.
Approach 3 — pre-calibrated scale:
If the capillary tube has been pre-calibrated in volume units, simply read the volume directly.
Any of these methods gives the volume of water lost.
Key Takeaways
- A capillary tube converts linear distance to volume via its constant cross-sectional area.
- Volume of a cylinder = cross-sectional area × length.
- Volume can also be obtained directly by using a syringe to reset the meniscus.
Common Mistakes
- Forgetting that the capillary has a measurable cross-section that must be calculated.
- Conflating radius and diameter — the formula uses radius , not diameter .
Things to Be Careful About
- The mark scheme accepts any correct form of the volume formula: , or .
- A typical potometer capillary has a very small cross-section, so a long distance moved corresponds to a small volume.
Sketch a graph to predict the expected results of the investigation.
Answer
Line graph with:
- y-axis: water loss (or rate of water loss / distance moved by the meniscus)
- x-axis: time
- two straight lines starting from the origin; the upper, steeper line is labelled mesophyte (or "meso") and the lower, shallower line is labelled xerophyte (or "xero")
(A bar chart with type of leaf on the x-axis and rate on the y-axis is also acceptable; the mesophyte bar is taller than the xerophyte bar. A horizontal bar chart is also allowed.)
See diagram.
Background Concept
Predicted results can be presented graphically before the experiment is carried out, to show what outcome would support the hypothesis. Two common graph types are:
- Line graph: shows how one variable changes against another (e.g. water loss against time). The slope represents the rate.
- Bar chart: compares a single measured value across different categories (e.g. rate of water loss for mesophyte vs xerophyte).
For a hypothesis predicting that a mesophyte loses more water than a xerophyte, the graph should clearly show the mesophyte bar/line higher than the xerophyte one.
Understanding the Question
Part (b) asks the student to sketch a graph predicting the expected results of the potometer investigation. The graph must:
- have correctly oriented and labelled axes
- show the mesophyte with higher water loss than the xerophyte
Either a line graph or a bar chart is acceptable.
Approach
Decide between a line graph and a bar chart. A line graph is more informative when time is involved (it shows the rate as slope). A bar chart is appropriate for a direct comparison of two categories.
Step-by-Step Reasoning
Line graph option:
- y-axis: water loss (or rate of water loss, or distance moved by the meniscus)
- x-axis: time
- Two straight lines starting from the origin (0, 0).
- Upper, steeper line labelled "mesophyte" (or "meso").
- Lower, shallower line labelled "xerophyte" (or "xero").
- The gap between the lines widens over time, showing greater cumulative water loss by the mesophyte.
Bar chart option:
- y-axis: rate (or water loss)
- x-axis: type of leaf
- Two bars: the taller bar is the mesophyte, the shorter bar is the xerophyte.
- A horizontal bar chart (with type of leaf on the y-axis and rate on the x-axis) is also accepted.
Units are not required on the sketch, but should be considered.
Key Takeaways
- Sketch graphs can be line graphs or bar charts, depending on the data being predicted.
- Axes must be labelled and the categories clearly shown.
- The predicted relationship (mesophyte > xerophyte) must be evident from the graph.
Common Mistakes
- Plotting the wrong variables on the wrong axes.
- Drawing the xerophyte higher than the mesophyte (contradicts the hypothesis).
- Forgetting to label the axes.
Things to Be Careful About
- The mark scheme accepts both line graphs and bar charts, including horizontal bar charts.
- Units are not required but should appear if the student chooses to include them.
The student then measured the surface area of the leaves by tracing the outline on a grid and counting the number of squares covered by the leaves. This area was doubled.
Mesophyte:
surface area of leaves =
water loss in 30 minutes =
Calculate the rate of water loss in .
Show all the steps in your calculation.
Working
Step 1: convert leaf surface area to m²
Step 2: convert water loss to cm³ per minute
Step 3: calculate rate of water loss per m² per minute
Answer
(≈ to 2 s.f.)
Background Concept
Rate of water loss is the volume of water lost per unit area per unit time. To express the rate in we need:
- the leaf area in
- the water loss per minute (in )
- the rate = water loss per minute ÷ area in
Unit conversions:
- , so
Understanding the Question
The mesophyte leaf has a total surface area of (this figure has already been doubled to account for both leaf surfaces) and lost of water in 30 minutes. The question asks for the rate of water loss in , showing all steps.
Approach
Work step-by-step:
- Convert the area from to .
- Convert the water loss from "per 30 minutes" to "per minute".
- Divide the per-minute water loss by the area in .
Step-by-Step Reasoning
Step 1 — area in m²
(equivalently )
Step 2 — water loss per minute
(equivalently )
Step 3 — rate per m² per minute
To 3 significant figures the answer is (or to 2 s.f.).
Watch out: the mark scheme specifically warns against halving or doubling the area further. The 36 cm² already accounts for doubling (both leaf surfaces). Using 72 cm² or 18 cm² would give incorrect answers.
Key Takeaways
- Always convert all quantities to consistent SI units before dividing.
- — this conversion is commonly tested.
- Rate = amount / (area × time).
Common Mistakes
- Forgetting to convert to (or doing it the wrong way round).
- Doubling or halving the 36 cm² value (the doubling has already been done).
- Writing the final answer with the wrong units.
- Failing to show all steps of the calculation.
Things to Be Careful About
- The mark scheme accepts , or .
- Quote the answer to an appropriate number of significant figures — the input data has 2–3 s.f., so 3 s.f. is appropriate.
- All three conversion/division steps must be visible in the working for full marks.
State a statistical test that the student could use to find out if the difference in water loss between the two types of leaf is significant. State a reason for your choice.
Answer
t-test
Reason: the data are continuous (not discrete) and the test compares two means / averages.
t-test; data are continuous and compare two means.
Background Concept
When comparing two sets of measurements, a statistical test can decide whether the difference is likely to be due to chance or to a real effect of the independent variable. The choice of test depends on the data type:
- t-test: compares two means of continuous, normally distributed data.
- chi-squared test: compares observed and expected frequencies of categorical (count) data.
- Spearman's rank correlation: looks for a monotonic relationship between two ranked variables.
Water loss per unit area per minute is a continuous variable (it can take any value, not just discrete categories), and the comparison is between two means (mesophyte vs xerophyte). This makes the t-test appropriate.
Understanding the Question
Part (c)(ii) asks which statistical test the student could use to determine whether the difference in water loss between mesophyte and xerophyte leaves is significant, and why.
Approach
Identify the data type and the comparison:
- Data type: continuous (rate of water loss per m² per min).
- Comparison: two means (one per plant type).
- → t-test.
Step-by-Step Reasoning
Test: t-test.
Reason: water loss per unit area per minute is continuous, and the comparison is between two means. The t-test is designed for exactly this situation — testing whether two sample means differ significantly.
The mark scheme rejects the reason "to compare two sets of data" as too vague — it must specifically reference continuous/normal data, or comparing two means.
Key Takeaways
- t-test is for comparing two means of continuous data.
- Chi-squared is for categorical (count) data.
- The choice of test depends on the data type, not on the experiment.
Common Mistakes
- Naming the wrong test (e.g. chi-squared, Spearman's rank, Mann–Whitney).
- Giving "to compare two sets of data" as the reason — the mark scheme rejects this as too vague.
- Choosing a non-parametric test when the data are clearly continuous.
Things to Be Careful About
- The reason must explain WHY the t-test fits: it is for continuous data and compares two means.
- "Significance" here means statistical significance — whether the observed difference is likely to have arisen by chance.
In a further investigation the student measured the loss in mass of each type of leaf.
Fig. 1.2 shows the experimental set-up.
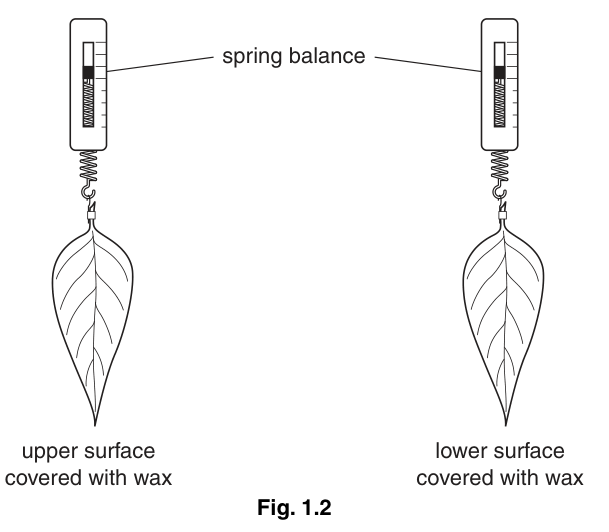
Table 1.1 shows the results of this investigation.
Table 1.1
| loss in mass / g per day | ||||
|---|---|---|---|---|
| upper side covered | lower side covered | |||
| day | mesophyte | xerophyte | mesophyte | xerophyte |
| 1 | 4.25 | 0.55 | 1.15 | 0.05 |
| 2 | 3.20 | 0.35 | 1.00 | 0.05 |
| 3 | 1.55 | 0.20 | 0.75 | 0.00 |
| 4 | 0.50 | 0.10 | 0.95 | 0.05 |
| 5 | 0.05 | 0.04 | 1.00 | 0.00 |
| total loss in mass / g | 9.55 | 1.24 | 4.85 | 0.15 |
State three conclusions that can be drawn from these results.
Answer
-
The mesophyte loses more water (greater mass loss) than the xerophyte — total loss of vs over 5 days with the upper surface covered.
-
Both leaves lose more water from the lower surface than the upper surface — when the upper surface is covered (so the lower surface is exposed), the mesophyte loses and the xerophyte loses ; when the lower surface is covered (only the upper surface is exposed), the losses are only and respectively.
-
The xerophyte loses almost no water from its upper surface — total loss with the lower surface covered is only over 5 days, suggesting it has very few or no stomata on its upper surface.
Mesophyte loses more water than xerophyte; both lose more from the lower surface; xerophyte loses almost no water from its upper surface.
Background Concept
Fig. 1.2 shows the experimental set-up: two leaves suspended from spring balances, with either the upper or lower surface covered in wax. Wax prevents water loss from the covered surface, so any mass loss recorded is from the uncovered surface only. Stomatal distribution can therefore be inferred: a leaf that loses a lot of water when only its upper surface is exposed must have many upper-surface stomata, while a leaf that loses almost no water when only its upper surface is exposed must have few or no upper-surface stomata.
Mesophytes typically have stomata mostly on the lower surface. Xerophytes often have stomata only on the lower surface (or in sunken pits), so water loss through the upper surface is minimal.
Understanding the Question
The question asks for three conclusions that can be drawn from Table 1.1. Each conclusion must be supported by figures from the table or by a clear comparison.
Approach
Scan the table systematically for trends and comparisons:
- Compare mesophyte vs xerophyte totals (both columns).
- Compare upper-side-covered vs lower-side-covered totals for each plant type.
- Look at how the daily values change to spot additional trends.
Step-by-Step Reasoning
Reading the totals from Table 1.1:
- Upper side covered, mesophyte:
- Upper side covered, xerophyte:
- Lower side covered, mesophyte:
- Lower side covered, xerophyte:
Conclusion 1 — mesophyte loses more water than xerophyte:
The mesophyte total () is roughly 8× greater than the xerophyte total () when the upper surface is covered. The same pattern holds when the lower surface is covered ( vs ).
Conclusion 2 — both leaves lose more water from the lower surface:
For the mesophyte, water loss is greater when the upper surface is covered () than when the lower surface is covered (). This means more water is lost through the lower surface — more stomata on the lower surface. The same pattern holds for the xerophyte ( vs ).
Conclusion 3 — xerophyte loses almost no water from its upper surface:
With the lower surface covered (so only the upper surface is exposed), the xerophyte loses only over 5 days — very small, suggesting very few or no stomata on its upper surface.
(Other valid conclusions, drawn from the same data, include: both leaves lose less water over time; the mesophyte has more stomata on the lower surface than the xerophyte; the mesophyte has stomata on both surfaces.)
Key Takeaways
- Conclusions must be supported by figures from the table or by clear comparisons.
- Trends across days and total comparisons both provide evidence.
- Waxing a surface selectively lets the experimenter infer stomatal distribution.
Common Mistakes
- Drawing conclusions not supported by the data.
- Saying "guard cells" instead of "stomata" — the mark scheme explicitly rejects "guard cells".
- Failing to quantify the conclusions with figures from the table.
- Concluding that stomata are completely absent (rather than fewer) when surface water loss is very low.
Things to Be Careful About
- The mark scheme accepts reverse arguments.
- Each conclusion should be distinct and supported by either totals or daily values.
- The conclusion about stomatal distribution is an inference (valid in this experiment), but the data themselves show only differences in mass loss.
The rest of this paper
1 more questions- Q2Planning · Analysis, Conclusions and Evaluation9M