Biology 9700/52 — May/June 2010
Cambridge A-Level · Planning, Analysis and Evaluation · worked solutions for every part, with the mark scheme
Topics Planning · Analysis, Conclusions and Evaluation
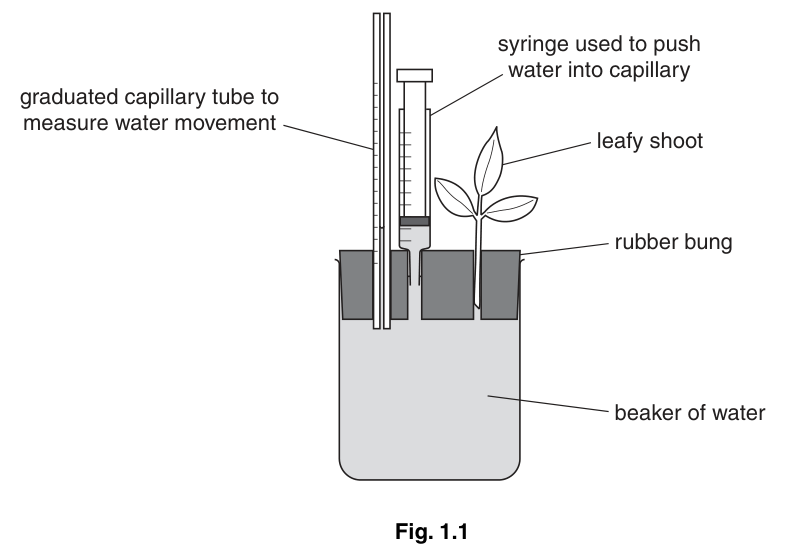
Fig. 1.1 shows one type of potometer used by a student to investigate transpiration.
Suggest a hypothesis the student could test about the transpiration of a mesophyte (a plant adapted to a moist environment) and a xerophyte (a plant adapted to a dry environment).
Using this potometer, outline a procedure that the student could use to test this hypothesis.
The capillary tube measures the distance moved by the water. Explain how the actual volume of water lost can be calculated.
Sketch a graph to predict the expected results of the investigation.
The student then measured the surface area of the leaves by tracing the outline on a grid and counting the number of squares covered by the leaves. This area was doubled.
Mesophyte:
surface area of leaves =
water loss in 30 minutes =
Calculate the rate of water loss in .
Show all the steps in your calculation.
State a statistical test that the student could use to find out if the difference in water loss between the two types of leaf is significant. State a reason for your choice.
In a further investigation the student measured the loss in mass of each type of leaf.
Fig. 1.2 shows the experimental set-up.
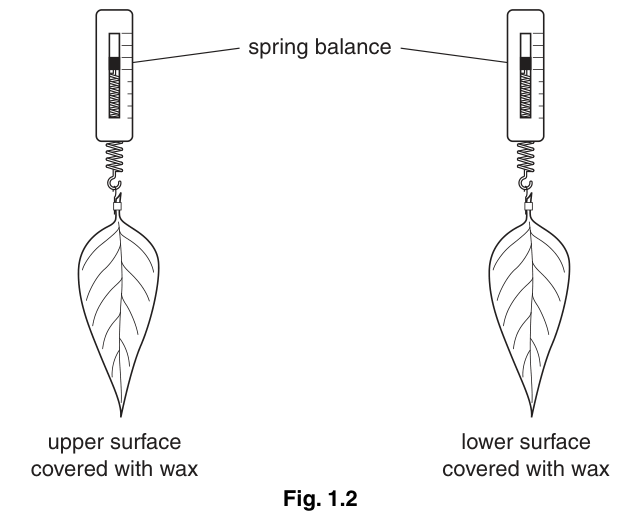
Table 1.1 shows the results of this investigation.
Table 1.1
| loss in mass / g per day | ||||
|---|---|---|---|---|
| upper side covered | lower side covered | |||
| day | mesophyte | xerophyte | mesophyte | xerophyte |
| 1 | 4.25 | 0.55 | 1.15 | 0.05 |
| 2 | 3.20 | 0.35 | 1.00 | 0.05 |
| 3 | 1.55 | 0.20 | 0.75 | 0.00 |
| 4 | 0.50 | 0.10 | 0.95 | 0.05 |
| 5 | 0.05 | 0.04 | 1.00 | 0.00 |
| total loss in mass / g | 9.55 | 1.24 | 4.85 | 0.15 |
State three conclusions that can be drawn from these results.
The rest of this paper
1 more questions- Q2Planning · Analysis, Conclusions and Evaluation9M