Biology 9700/51 — May/June 2010
Cambridge A-Level · Planning, Analysis and Evaluation · worked solutions for every part, with the mark scheme
Topics Analysis, Conclusions and Evaluation · Planning
Many plants produce two types of leaves. One type is produced where the leaves develop in full sunlight and are called ‘sun leaves’. The other type is produced where the leaves develop in the shade and are called ‘shade leaves’.
A student investigated photosynthesis in both types of leaves using leaf discs. Fig. 1.1 shows the method used by the student to obtain the leaf discs.
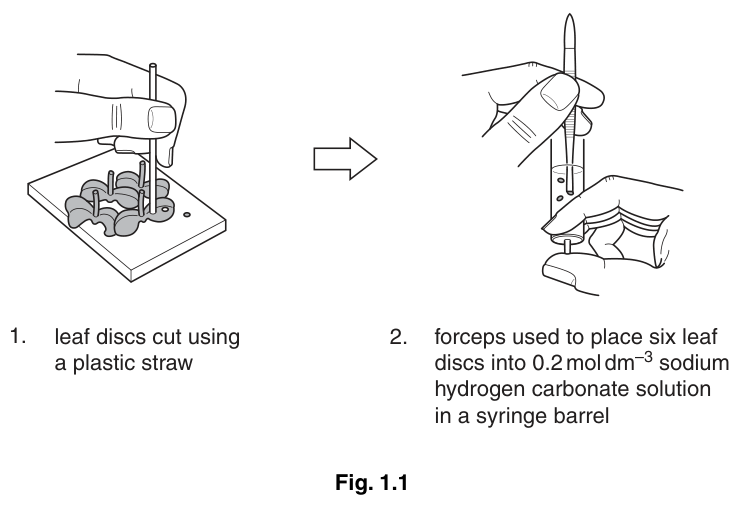
Fig. 1.1
The student then carried out the following actions:
- replaced the plunger into the syringe, turned the syringe upside down and pushed in the plunger to force out all the air
- placed a finger over the open end of the syringe and pulled down the plunger to create a vacuum
- tapped the side of the syringe to remove air bubbles
- repeated actions 3–5 until the leaf discs sank to the bottom of the syringe.
The student measured the rate of photosynthesis of discs from both types of leaves to test the hypothesis
Leaf discs from shade leaves will photosynthesise at a higher rate in low light intensity than leaf discs from sun leaves.
Fig. 1.2 shows the appearance of the leaf discs in the syringe as they photosynthesise.
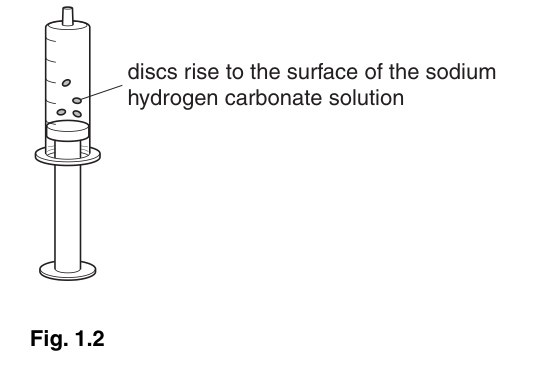
Fig. 1.2
Explain why the leaf discs rise to the surface in the light.
Using this method, outline how the student could test the hypothesis.
Fig. 1.3 shows the results that the student plotted from the investigation.
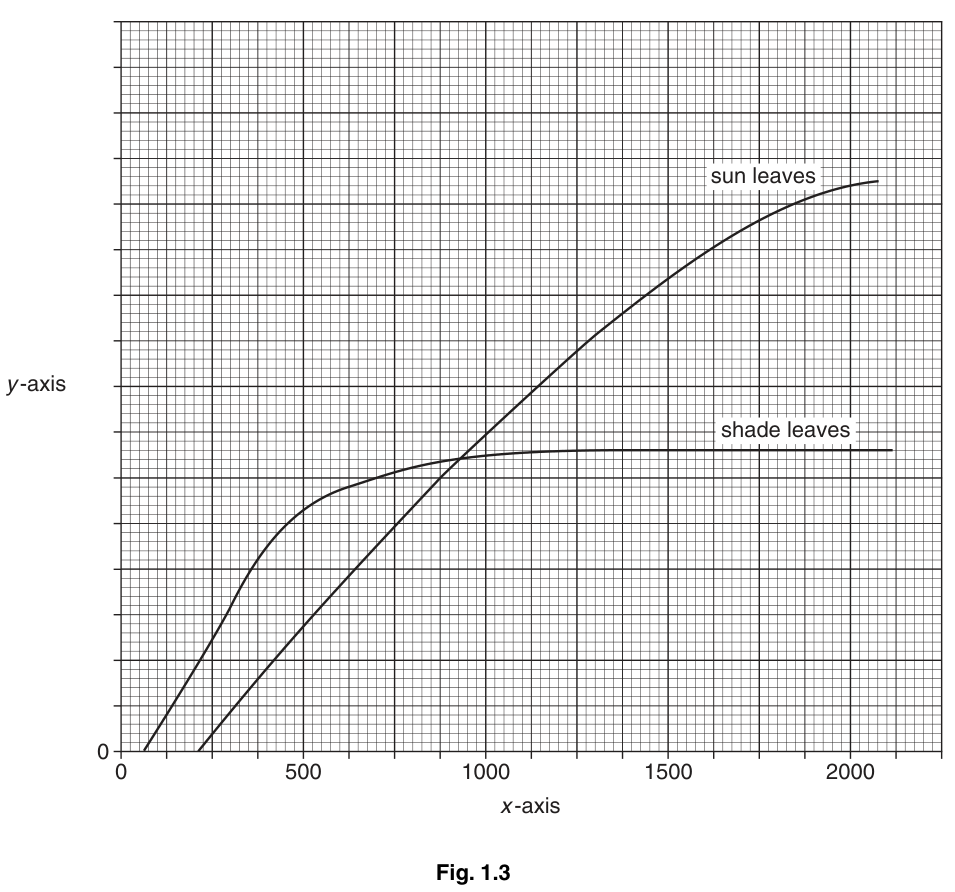
Fig. 1.3
Suggest labels for the axes of this graph.
x-axis ______
y-axis ______
State two ways in which the student’s data support the hypothesis.
-
______
-
______
In a further investigation using these two types of leaves, the student estimated the number of stomata per unit area. Epidermal strips from the lower surface of the leaf were mounted in water and observed under a microscope.
The diameter of the field of view was measured using an eyepiece graticule. The actual field of view was calculated using a calibration value from a slide micrometer scale.
Diameter of field of view at magnification
Calculate the area of the field of view. Use the formula . ( or )
Give your answer to one significant figure.
Table 1.1 shows the results of the stomatal count investigation.
Table 1.1
| number of stomata visible at magnification | mean number of stomata | number of stomata per | |
|---|---|---|---|
| sun leaves | 21 24 36 24 15 18 27 33 18 24 | 120 | |
| shade leaves | 36 39 35 42 28 36 34 40 48 32 |
Calculate the mean number of stomata per for the shade leaves.
Show your working below and write your answer in Table 1.1.
State the null hypothesis for a statistical test to find out whether the difference in the number of stomata is significant.
Name a statistical test that could be used and give the reason for your answer.
The results of the statistical test showed that the difference was significant.
Suggest one reason why there is a difference in the number of stomata of shade leaves and sun leaves.
The rest of this paper
1 more questions- Q2Planning · Analysis, Conclusions and Evaluation11M