Biology 5090/42 — October/November 2025
Cambridge O-Level · Alternative to Practical · worked solutions for every part, with the mark scheme
Topics Experimental Contexts · Observations and Measurements · Analysis, Conclusions and Evaluation · Planning Experiments and Investigations · Microscopy and Biological Drawing · Use of Techniques, Apparatus and Materials
Hydrogen peroxide is a harmful waste product in living cells. The enzyme catalase breaks down hydrogen peroxide into water and oxygen.
Some students investigated catalase in tissues from different plants. They used small filter paper discs. The filter paper discs were placed on the cut surface of plant tissues to absorb liquid from the cells. The liquid from the cells might contain catalase.
Fig. 1.1 shows how the students were able to tell if catalase was present in tissues from different plants.
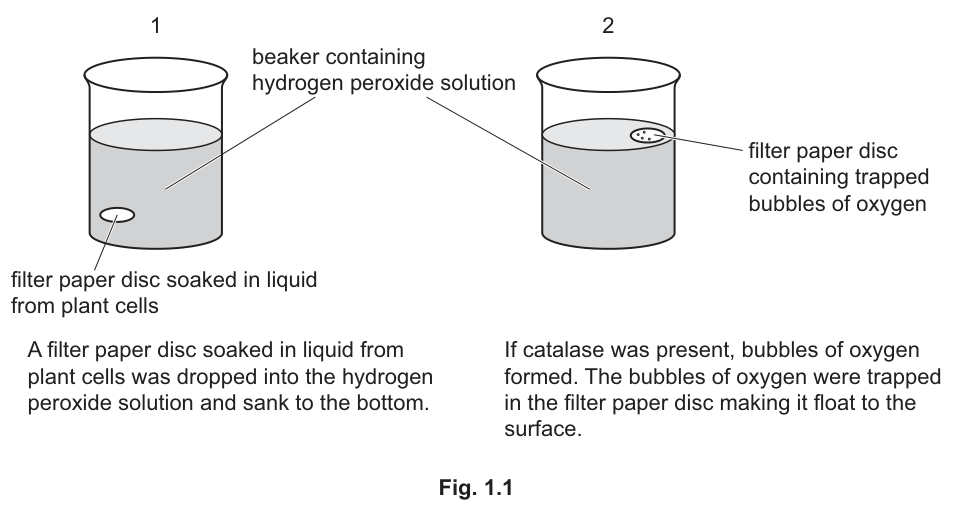
The students were given cubes of tissue from three different plants labelled A, B and C, small filter paper discs and a beaker of hydrogen peroxide solution.
The students followed this procedure.
- Cut the piece of plant tissue A in half.
- Use forceps to place a filter paper disc onto a cut surface of plant tissue A, to absorb liquid from the cells.
- After 1 minute, use forceps to pick up the filter paper disc from the cut surface of plant tissue A.
- Drop the filter paper disc into the beaker of hydrogen peroxide solution and immediately start timing. The filter paper disc will sink to the bottom of the beaker.
- Observe the filter paper disc until it reaches the surface of the hydrogen peroxide solution, then stop timing. If a filter paper disc does not float within 4 minutes (240 seconds) stop timing and record the time taken for the filter paper disc to reach the surface as >240.
- Record the time taken, to the nearest whole second, for the filter paper disc to reach the surface of the hydrogen peroxide solution.
- Use forceps to remove the filter paper disc from the beaker of hydrogen peroxide solution and place it in the waste container provided.
- Rinse and dry the forceps.
- Repeat the procedure two more times with filter paper discs on the same cut surface of plant tissue A.
- Repeat all of the procedure for filter paper discs on plant tissue B and then again for plant tissue C.
Fig. 1.2 shows a student's notebook. The student has recorded their results to the nearest whole second. The result for the third filter paper disc on plant tissue A is missing from their notes.
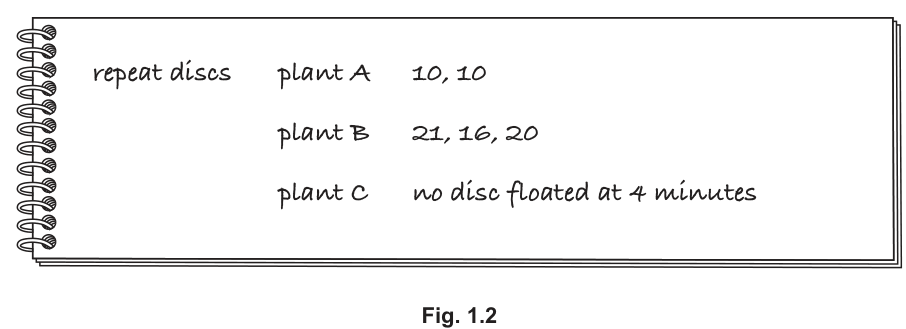
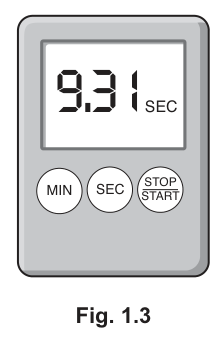
Fig. 1.3 shows the time taken for the third filter paper disc on plant tissue A to reach the surface.
Answer
| plant / tissue | time / s | disc 1 | disc 2 | disc 3 | mean |
|---|---|---|---|---|---|
| A | |||||
| B | |||||
| C |
Headings:
- First blank (top left): plant (or tissue)
- Second blank (top, above disc 1): time / s (or time taken for disc to float / seconds)
plant / tissue; time / s
Walkthrough
The table is designed to record the results of an experiment comparing three plant tissues (A, B, C). The rows are labelled with the tissue names, so the first column header must identify what is in the rows: plant or tissue. The data being recorded is the time it takes for the filter paper disc to float. The mark scheme requires the unit, so the second header must be time / s (or time in seconds). Without units, the data is meaningless in a scientific context.
Key Takeaways
When completing a results table, the first column usually identifies the independent variable (here, the plant tissue type), and the subsequent columns record the dependent variable (time) with its units.
Common Mistakes
- Forgetting the units in the header (e.g., writing just 'time' instead of 'time / s').
- Writing 'mean' in the first column header.
Things to Be Careful About
The mark scheme explicitly states 'units required'. Always include units in the main column header for the data. 'plant' and 'tissue' are interchangeable here.
Enter the data from Fig. 1.2 and Fig. 1.3 into Table 1.1.
Calculate the mean times for the filter paper discs, from tissues A, B and C, to reach the surface. Record all the values to the nearest whole second.
Answer
| plant | time taken for disc to float / s | ||||
|---|---|---|---|---|---|
| disc 1 | disc 2 | disc 3 | mean | ||
| A | 10 | 10 | 9 | 10 | |
| B | 21 | 16 | 20 | 19 | |
| C | > 240 | > 240 | > 240 | > 240 |
Working:
- Plant A, disc 3: Fig 1.3 shows 9.31 s. Rounded to nearest whole second = 9 s.
- Mean A: 10 s.
- Mean B: 19 s.
- Plant C: No disc floated within 4 minutes (240 s), so all values are > 240 and the mean is > 240.
See table above
Walkthrough
First, extract the data from the notebook (Fig 1.2) and the stopwatch (Fig 1.3).
- Plant A: Notebook has '10, 10'. The stopwatch (Fig 1.3) reads 9.31 SEC. The question asks to record to the nearest whole second, so 9.31 becomes 9. The rows for A are 10, 10, 9. Mean = , which rounds to 10.
- Plant B: Notebook has '21, 16, 20'. Mean = 19.
- Plant C: Notebook says 'no disc floated at 4 minutes'. The procedure says if it doesn't float within 240 seconds, record as >240. So all three discs are > 240. The mean of values all greater than 240 is also > 240.
Key Takeaways
- Always round raw data to the precision requested (nearest whole second here).
- When calculating a mean, round the final answer to the same precision as the data if appropriate, or follow the mark scheme's rounding (9.67 rounds to 10).
- Censored data (values exceeding the max time) should be recorded as >max_time, and the mean reflects this inequality.
Common Mistakes
- Recording 9.31 instead of 9.
- Calculating the mean for A as 9 (rounding down incorrectly) or 9.7.
- Writing '0' or '4 minutes' for Plant C instead of '> 240'.
Things to Be Careful About
- The stopwatch shows 9.31, but the instruction says 'nearest whole second'.
- Plant C data is qualitative ('no disc floated'), but must be converted to the quantitative format used in the table (> 240).
Using the results in Table 1.1, state what you can conclude about catalase in plant tissues A, B and C.
tissue A ______
tissue B ______
tissue C ______
Answer
- tissue A: has the most catalase (or enzyme); fastest reaction / shortest time.
- tissue B: has catalase (or enzyme); reaction occurred but slower than A.
- tissue C: has no catalase (or enzyme); no reaction occurred (disc did not float).
A has most catalase; B has catalase; C has no catalase
Walkthrough
The experiment measures the time taken for a disc to float. The disc floats when enough oxygen bubbles are produced by the reaction: catalase breaks down hydrogen peroxide into water and oxygen. The oxygen gets trapped in the filter paper, making it buoyant.
- Faster reaction (shorter time) means more catalase is present to break down the peroxide quickly.
- Slower reaction (longer time) means catalase is present but in lower quantities.
- No reaction (disc doesn't float) means no catalase is present.
Comparing the means: A (10s) < B (19s) < C (>240s).
- A is fastest -> most catalase.
- B is slower but floated -> has catalase.
- C didn't float -> no catalase.
Key Takeaways
- In this specific assay (filter paper disc method), the rate of reaction is inversely proportional to the time taken. Shorter time = higher rate = more enzyme.
- A negative result (no floating) indicates the absence of the enzyme.
Common Mistakes
- Saying 'C has the most catalase' because the time is highest (confusing time with rate).
- Saying 'B has more catalase than A' because 19 > 10 (failing to realize time is an inverse measure of rate).
- Not mentioning that C has no catalase, just saying 'less'.
Things to Be Careful About
- The question asks to 'state what you can conclude'. Don't just repeat the times; interpret them in terms of catalase presence/amount.
Suggest why the filter paper discs were left on the cut surfaces of the plant tissues for the same length of time.
______
Answer
- To absorb the same volume of liquid (from the cells).
- This ensures the results are comparable (or: different volumes of liquid would be a variable / affect the amount of enzyme absorbed).
absorb the same volume of liquid; make results comparable
Walkthrough
The filter paper disc absorbs liquid from the cut plant cells. This liquid contains the catalase enzyme. If the discs are left on for different lengths of time, they will absorb different amounts of liquid (and thus different amounts of enzyme). This would introduce an uncontrolled variable, making it impossible to tell if a difference in floating time is due to the plant tissue type or the amount of enzyme absorbed.
Therefore, the time must be the same to control the volume of liquid absorbed, ensuring a fair test.
Key Takeaways
- In biological assays involving absorption or extraction, time is often a controlled variable to ensure equal extraction/absorption.
- 'Fair test' arguments always link the control to the dependent variable or the validity of the comparison.
Common Mistakes
- Saying 'to make it fair' without explaining why (need to mention volume of liquid or amount of enzyme).
- Saying 'to stop the enzyme working' (the enzyme works in the beaker, not on the tissue during absorption).
Things to Be Careful About
- The mark scheme looks for two points: the direct reason (same volume) and the consequence (comparable results / control variable).
Answer
- Use water in the filter paper disc (as a negative control with no enzyme).
- OR use boiled plant tissue (to denature the enzyme / show that heat destroys catalase).
water in disc or boiled tissues
Walkthrough
A control experiment is needed to prove that the floating is actually due to catalase and not some other property of the plant tissue or the filter paper.
- Option 1 (Negative Control for Enzyme): Use a disc soaked in distilled water instead of plant tissue extract. If this disc does not float (or takes much longer), it proves the plant tissue liquid is responsible. Water contains no catalase.
- Option 2 (Denaturation Control): Boil a piece of plant tissue before testing. Boiling denatures enzymes (including catalase), destroying their active sites. If a disc from boiled tissue does not float, it proves the reaction requires functional enzyme.
Key Takeaways
- Controls for enzyme experiments often involve either removing the enzyme (water control) or destroying the enzyme (boiling/denaturing).
- The control must undergo the same procedure as the experimental groups except for the variable being tested (presence of active catalase).
Common Mistakes
- Suggesting a control with a different plant species (this tests different tissues, not the absence of enzyme activity specifically, though it could be a control, the mark scheme prefers water or boiled tissue).
- Saying 'no hydrogen peroxide' (this tests the substrate, not the enzyme in the tissue, though valid, the scheme focuses on the enzyme aspect).
Things to Be Careful About
- The mark scheme allows 'max one from', so giving either water or boiled tissue is sufficient. Boiled tissue is a very strong control for enzyme activity.
Lemna is a small green plant that floats on the surface of water in ponds and lakes. It consists of leaves which float and a root that hangs down in the water.
Fig. 2.1 shows a single plant that has four leaves. D and E indicate the maximum length of two of the plant's leaves.
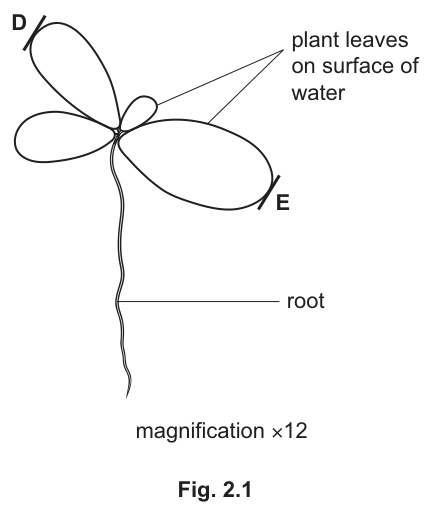
On Fig. 2.1, draw a straight line to join D and E. Measure the length of the line and record it.
______
Calculate the actual maximum length of two of the plant's leaves and record it to the nearest whole number.
______
Working
Length of line between D and E (acceptable range )
Answer
Length of line:
Actual maximum length:
4 mm
Walkthrough
- Measuring the image length: Use a clear plastic ruler to measure the straight-line distance between line D and line E on Fig. 2.1. The measured distance is (Cambridge accepts any value in the range ).
- Calculating actual size: Use the magnification formula:
Substitute the values: .
3. Rounding: The question specifically requests the answer to the "nearest whole number". rounds to .
Key Takeaways
- Always remember the relationship triangle: , hence .
- Follow instructions carefully regarding rounding and units.
Common Mistakes
- Multiplying by magnification instead of dividing (e.g., ).
- Forgetting to round to the nearest whole number as specified in the question.
Things to Be Careful About
- Ensure units are consistent (both measured length and answer in ).
The population of this plant grows by each plant dividing into two smaller plants. These smaller plants then grow new leaves and divide again.
Some students decided to investigate the growth of Lemna plants. They placed six plants in a small beaker containing nutrients in distilled water (nutrient solution). They used a lamp to provide constant light.
Answer
For healthy plant growth / plants need mineral nutrients (e.g. nitrates/magnesium) to make new cells and tissues.
for (good) growth
Walkthrough
Distilled water contains pure with no dissolved mineral ions. Plants need essential mineral ions (such as nitrates to build proteins for growth and magnesium to make chlorophyll for photosynthesis). Without adding nutrients, the Lemna plants would quickly become nutrient-deficient and unable to divide or grow new leaves.
Key Takeaways
- Distilled water lacks minerals; adding nutrient solution provides the necessary ions for plant growth and protein synthesis.
Common Mistakes
- Stating that nutrients are "food" or "provide energy" for the plant (plants make their own food by photosynthesis).
Things to Be Careful About
- Clearly link the nutrients to plant growth.
The students decided to measure growth by counting the total number of leaves at the same time each day. At the start of the investigation there were 16 leaves in total on the plants.
Fig. 2.2 shows the beaker seen from above on day 4.
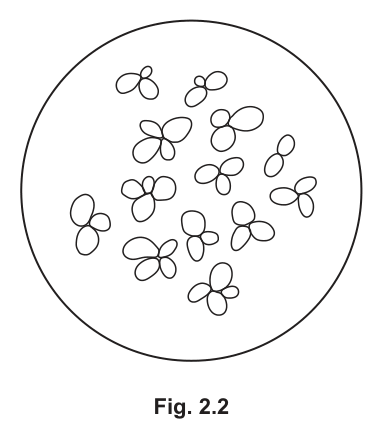
Count the total number of leaves visible in Fig. 2.2 and enter the number in Table 2.1.
Table 2.1
| time / days | total number of leaves |
|---|---|
| 0 | 16 |
| 2 | 20 |
| 3 | 29 |
| 4 | |
| 5 | 55 |
| 6 | 83 |
| 7 | 91 |
Answer
42
42
Walkthrough
Systematically count the individual leaves shown floating in Fig. 2.2 on day 4.
- Grouping by plant clusters from top to bottom:
- Top row: cluster of 3 leaves + cluster of 3 leaves = 6 leaves
- Second level: cluster of 4 leaves + cluster of 3 leaves + pair of 2 leaves = 9 leaves
- Middle: cluster of 3 leaves + cluster of 3 leaves + cluster of 3 leaves = 9 leaves
- Lower-middle: pair of 2 leaves + cluster of 4 leaves + cluster of 3 leaves = 9 leaves
- Bottom row: cluster of 5 leaves + cluster of 4 leaves = 9 leaves
- Total count leaves.
Key Takeaways
- A systematic counting technique (e.g., ticking off each leaf or working systematically across rows) avoids miscounts.
Common Mistakes
- Counting whole plants instead of individual leaves.
- Missing small emerging leaves in clusters.
Things to Be Careful About
- Double-check by recounting in a different order.
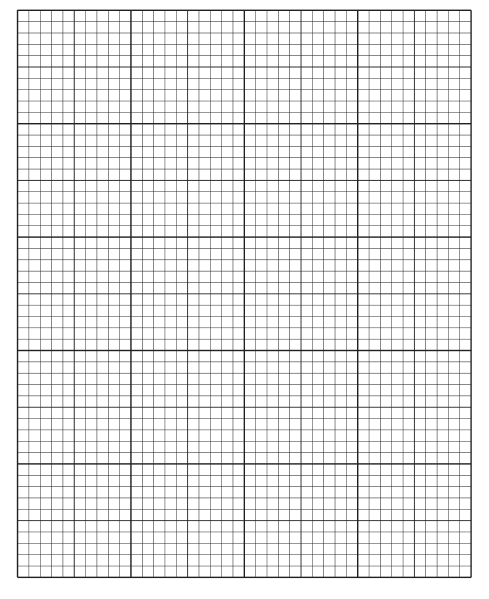
On the grid, draw a line graph of the data shown in Table 2.1.
Join the points with ruled, straight lines.
Answer
- Axes: Horizontal axis labelled
time / daysand vertical axis labelledtotal number of leaves. - Scales: Linear scales on both axes starting at 0 at the origin:
- -axis: 2 cm (1 major grid square) (from 0 to 7 or 8 days).
- -axis: 2 cm (1 major grid square) (from 0 to 100 leaves).
- Plotting: All 7 points accurately plotted with small, neat crosses () or encircled dots ():
- Line: Points connected sequentially with clean, single ruled straight lines from point to point.
Line graph plotted with time on x-axis and total number of leaves on y-axis, points joined with ruled straight lines
Walkthrough
To score full marks on a 5090 line graph:
- Orientation & Labels: Put the independent variable on the -axis (
time / days) and the dependent variable on the -axis (total number of leaves). Units must be included as given in the table. - Scale: Scales must be linear (evenly spaced) and make good use of the grid (using at least half of the grid area in both directions). Values must be indicated at the origin (0 on both axes).
- For : 0 to 7 days fits well at 2 large squares per day.
- For : 0 to 100 leaves fits well at 1 large square per 20 leaves (or 2 large squares per 20 leaves depending on orientation).
- Plotting: Mark all seven points with clear, precise crosses () or circled dots () to within (half a small square).
- Line connection: The question explicitly states: "Join the points with ruled, straight lines." Use a ruler to draw straight line segments between consecutive data points. Do not extrapolate beyond day 7 or before day 0.
Key Takeaways
- Always check whether the prompt asks for a "smooth line/curve" or "ruled, straight lines". Here, straight lines connecting points are required.
Common Mistakes
- Drawing a freehand curve when asked for ruled straight lines.
- Omitting the origin value or units on axes.
- Extrapolating the line beyond the plotted points.
Things to Be Careful About
- Ensure the point at day 4 uses the value 42 determined in part (b)(ii).
Use your graph to estimate the total number of leaves that would have been present on day 1. Show your working on your graph.
total number of leaves on day 1 = ______
Working
On the graph, draw a vertical line from up to meet the straight line between day 0 and day 2, then draw a horizontal line across to the vertical axis.
Midpoint between 16 and 20 at day 1:
Answer
18
18
Walkthrough
- Showing working on the graph: Draw a construction line (dashed or solid) vertically from on the -axis to the line joining and , and a horizontal line from this intersection to the -axis.
- Reading the value: Since the points and are joined by a straight ruled line, the value at the midpoint (day 1) is exactly .
Key Takeaways
- When asked to "Show your working on your graph", drawing the construction lines from axis to graph line and back to the other axis is essential to gain the method mark.
Common Mistakes
- Writing down 18 without drawing the construction lines on the graph (losing 1 mark).
Things to Be Careful About
- Ensure the line is drawn accurately to the intersection with the graph line.
Predict the shape of the graph after day 7 if the investigation continues for another six days. Explain your answer.
prediction ______
explanation ______
Answer
- Prediction: The graph line will level off / become horizontal / increase at a slower rate (the gradient decreases).
- Explanation: The plants will run out of nutrients in the water / run out of space on the water surface (overcrowding / leaves overlap and shade each other from light).
prediction: line levels off / becomes horizontal; explanation: plants run out of space or nutrients
Walkthrough
- Prediction: In a closed container (small beaker), exponential population growth cannot continue indefinitely. As the population reaches carrying capacity, the growth rate will slow down and the curve will plateau (level off / become horizontal).
- Explanation: Limiting factors will restrict further growth. The two main limiting factors in this investigation are:
- Depletion of mineral nutrients in the fixed volume of solution.
- Lack of surface space (the floating leaves will cover the entire surface, causing shading and competition for light).
Key Takeaways
- Sigmoid/logistic population growth curves always level off due to environmental limiting factors (space, nutrients, light).
Common Mistakes
- Predicting that the line will suddenly drop to zero immediately (unless all plants die instantly, population usually plateaus first).
- Giving a vague explanation such as "they cannot grow anymore" without naming the limiting factor (nutrients or space/light).
Things to Be Careful About
- Ensure both the prediction and the biological reason are clearly stated.
Suggest one other method that the students could use to measure the growth of Lemna.
______
Answer
Measure the change in mass (fresh mass or dry mass) of the plants / measure the total surface area covered by the leaves.
measure mass (of plants) / calculate surface area of leaves
Walkthrough
Counting leaves only measures number of organs, not their size or mass. Valid alternative biological methods to measure growth include:
- Mass (Biomass): Blotting the Lemna plants to remove excess water and weighing them on a balance to find fresh mass, or drying them in an oven to measure dry mass.
- Surface Area: Measuring or calculating the total surface area of the floating leaves (e.g. using grid paper or photographic image analysis).
Key Takeaways
- Plant growth can be quantified by increase in number of parts (leaves), increase in dimensions/surface area, or increase in fresh/dry mass.
Common Mistakes
- Suggesting measuring the length of the plant's root (which is difficult and does not represent overall growth well).
- Giving non-quantitative suggestions.
Things to Be Careful About
- Give only one clear method as requested by "Suggest one other method".
Plan an investigation to determine the effect of different concentrations of a nutrient solution on the growth of Lemna. Use the same method of counting the number of leaves that the students used in their investigation for measuring growth.
Answer
- Independent variable: Prepare at least three (e.g. 5) different concentrations of nutrient solution (e.g. , , , , and ).
- Controlled variables:
- Keep the volume of nutrient solution the same in each container (e.g. ).
- Start each container with the same number of Lemna plants/leaves (e.g. 6 plants / 16 leaves).
- Keep the temperature constant (e.g. using a thermostatically controlled room or water-bath at ).
- Keep the light intensity constant (e.g. same distance from the same lamp, constant illumination).
- Dependent variable & procedure: Place the plants into each solution and count and record the total number of leaves at regular intervals (e.g. every day at the same time for 7 days).
- Repetition: Repeat the experiment at least twice more for each concentration (minimum 3 trials per concentration) and calculate the mean number of leaves for each concentration.
- Data processing: Compare growth across the different concentrations by calculating the percentage increase in leaf number or the growth rate (leaves per day), or by plotting a graph of leaf count against nutrient concentration.
See working
Walkthrough
To obtain full marks (6 marks) in a Cambridge 5090 planning question, structure the response clearly covering all key experimental design areas:
- Independent Variable: State a clear range of at least three different concentrations of nutrient solution (e.g., , , , , or , , ).
- Control of Confounding Variables (Constants): Name specific variables to control:
- Same volume of solution (e.g. in each beaker).
- Same initial number of plants/leaves in each beaker.
- Same temperature (e.g. room temperature ).
- Same light intensity (constant light from a lamp at a fixed distance).
- Dependent Variable & Method: State what is measured and how: count the number of leaves at regular intervals (e.g. daily at the same time) over a specified duration (e.g. 7 days).
- Reliability & Repeats: Specify repeating each concentration at least twice more (3 trials total) and calculating a mean.
- Analysis / Comparison: Describe how to compare the results to determine the effect of concentration (e.g. calculate percentage increase in leaves, calculate rate of leaf production, or plot a graph of mean leaf number against concentration).
Key Takeaways
- A complete experimental plan must specify: IV (range of values), DV (measurement method and time intervals), CVs (at least 2 specific variables kept constant), Replicates (repeat and mean), and Data Analysis.
Common Mistakes
- Providing fewer than 3 concentrations.
- Stating "repeat to avoid errors" rather than "repeat and calculate mean to improve reliability".
- Forgetting to control key abiotic variables like light intensity and temperature.
Things to Be Careful About
- The prompt specifies using the same method of counting leaves as the original investigation, so make sure leaf counting is explicitly described as the measurement method.
Fig. 3.1 is a photomicrograph of cells from a plant epidermis that have been treated so that some of the cells are plasmolysed.
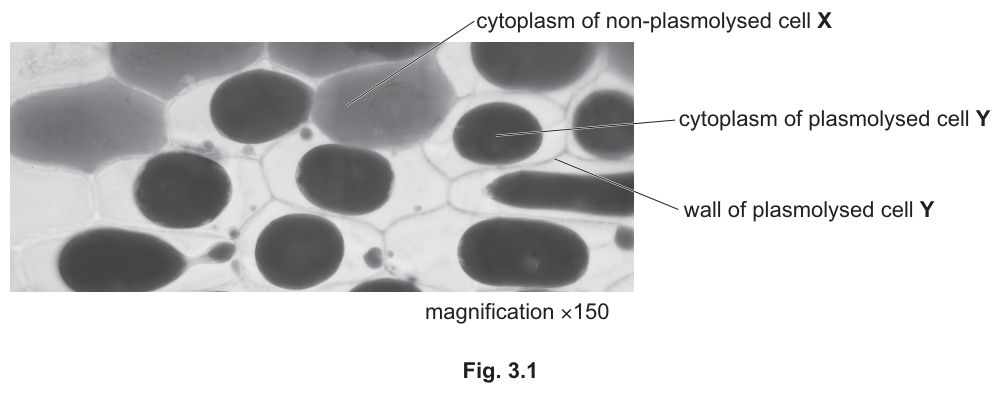
State three items of apparatus that you would need to use to observe the actual cells shown in the photomicrograph.
- ______
- ______
- ______
Answer
- Light microscope
- Microscope slide
- Coverslip
- Light microscope
- Microscope slide
- Coverslip
Walkthrough
To view plant epidermal cells at cellular magnification (such as the shown in the photomicrograph), standard light microscopy equipment is required:
- A light microscope (or optical microscope) to magnify the specimen.
- A glass microscope slide to place the epidermal tissue on.
- A glass or plastic coverslip to flatten the tissue, hold the liquid mount in place, and protect the objective lens.
(Note: A light source/lamp is also an acceptable item of apparatus.)
Key Takeaways
- Standard slide preparation for light microscopy requires a slide, coverslip, and microscope (with illumination).
Common Mistakes
- Naming staining reagents or solutions (e.g., iodine or salt solution) instead of apparatus/equipment.
- Naming a telescope or magnifying glass instead of a microscope.
Things to Be Careful About
- Ensure you list three distinct physical pieces of apparatus, as requested by the three numbered lines.
Answer
- Clear, continuous outlines drawn with a sharp pencil, with no shading, stippling, or ruled lines.
- Large drawing measuring at least across cells X and Y combined, showing the two cells touching each other along their shared/adjacent boundary.
- Accurate structural detail showing:
- The upper right wall of cell X and lower left wall of cell Y drawn as approximately straight and parallel lines.
- The shrunken cytoplasm/protoplast drawn inside plasmolysed cell Y, leaving a clear gap between the cytoplasm and the cell wall, while the cytoplasm of cell X fills the cell up to the cell wall.
Large drawing of cells X and Y measuring at least 100 mm across, drawn with clear continuous lines, no shading, and correct structural details showing plasmolysis in Y.
Walkthrough
When creating a biological drawing from a photomicrograph:
- Line Quality and Technique: Use a sharp HB pencil to draw crisp, continuous, single lines. Do not sketch with overlapping strokes, do not use a ruler for biological outlines, and strictly avoid any shading, cross-hatching, or stippling.
- Size and Proportion: The combined width of the two cells drawn must be at least (spanning more than half the available drawing space). The cells must be drawn in contact with each other, sharing a common boundary region.
- Structural Details:
- Cell X is non-plasmolysed: its cytoplasm/protoplast occupies the entire volume enclosed by the outer cell wall.
- Cell Y is plasmolysed: its cytoplasm has shrunk into a rounded mass, pulled away from the rigid cell wall, leaving an empty region between the protoplast and the wall.
- The outer boundaries between adjacent cells in this tissue (specifically the upper right edge of cell X and the lower left boundary of cell Y) are approximately straight and parallel.
Key Takeaways
- Biological drawings must follow strict rules: sharp continuous lines, minimum size, no shading, and faithful representation of cellular morphology.
- In plasmolysed plant cells, the cell wall maintains its shape while the cell membrane and cytoplasm pull away towards the center.
Common Mistakes
- Adding pencil shading to represent dark/tinted cytoplasm (strictly penalized in biological drawings).
- Drawing fuzzy, sketchy, or broken outlines.
- Drawing cell Y without its outer cell wall boundary, or forgetting the shrunken cytoplasmic mass inside.
Things to Be Careful About
- Ensure the drawing exceeds the specified size threshold (minimum across).
Describe how you would treat cells from a plant epidermis so that they become plasmolysed.
______
Answer
Place the cells in a concentrated solution of salt or sugar (sucrose).
Place the cells in a concentrated salt or sugar solution.
Walkthrough
Plasmolysis occurs when plant cells lose water by osmosis:
- To cause water to leave the plant cells, they must be immersed in a solution with a lower water potential (higher solute concentration) than the cell sap/cytoplasm inside the cells.
- In a laboratory, this is achieved by placing the epidermal strip or cells into a concentrated solution of a solute such as salt (sodium chloride) or sugar (sucrose).
- Water moves out of the vacuole and cytoplasm across the partially permeable cell surface membrane down the water potential gradient by osmosis, causing the cytoplasm to shrink away from the cell wall.
Key Takeaways
- Immersion in a hypertonic / concentrated solute solution (e.g., concentrated sucrose or salt solution) draws water out of plant cells by osmosis, causing plasmolysis.
Common Mistakes
- Stating 'pure water' or 'dilute solution' (which would make cells turgid rather than plasmolysed).
- Mentioning only 'solution' without specifying that it must be concentrated (or naming an appropriate solute like salt/sugar).
Things to Be Careful About
- Both points are required: specifying that the solution is concentrated and naming a suitable solute such as salt or sugar.