Biology 5090/41 — October/November 2025
Cambridge O-Level · Alternative to Practical · worked solutions for every part, with the mark scheme
Topics Planning Experiments and Investigations · Observations and Measurements · Analysis, Conclusions and Evaluation · Experimental Contexts · Use of Techniques, Apparatus and Materials · Microscopy and Biological Drawing
Apple juice is made by cutting up and crushing apples. When apple tissue is cut up and crushed, it can become a darker colour and go brown.
Some students investigated the effect of vitamin C on the colour change in apples when they are cut up and crushed.
The students followed these instructions:
- Label a large test-tube and add of vitamin C solution.
- Label a second large test-tube and add of distilled water.
- Label a third large test-tube and do not add any liquid.
- Cut three cubes of apple each . Do not include any skin or core.
- Cut each cube into many small pieces. Take care to keep the pieces from each cube separate.
- Add the pieces of one cube to the test-tube containing vitamin C solution.
- Add the pieces of the second cube to the test-tube containing distilled water.
- Add the pieces of the third cube to the test-tube with no added liquid.
- Use a glass rod to gently crush the pieces of apple in the bottom of each test-tube.
- Clean the glass rod between using it in each test-tube.
- Start timing.
Describe the most appropriate piece of apparatus to measure the required volumes of vitamin C solution and distilled water.
______
Answer
A measuring cylinder (or syringe) with a suitable capacity, such as or .
Final Answer
A (or ) measuring cylinder (or syringe).
A (or ) measuring cylinder (or syringe).
Walkthrough
The question asks for the most appropriate apparatus to measure of liquid. At O Level, a measuring cylinder or a syringe is the standard answer for measuring small, precise volumes. The candidate must also state a suitable size. A cylinder is too small to measure into safely without overflowing, so a or cylinder (or a / syringe) is required to give a clear meniscus reading while allowing room for the .
Key Takeaways
Always pair the name of the apparatus with a suitable capacity when asked to describe it. A measuring cylinder is not suitable for measuring of liquid because it would be filled to the brim, making the meniscus impossible to read accurately.
Common Mistakes
Students often write "test-tube" or "beaker". These are not precise enough for measuring and would not score. Writing "measuring cylinder" without stating a suitable size also loses a mark.
Things to Be Careful About
The mark scheme accepts "syringe" as an alternative to "measuring cylinder". Ensure the stated size is larger than (e.g., , ) to show understanding of how the apparatus works in practice.
Answer
To prevent the transfer of liquid (or vitamin C) from one test-tube to another, which would contaminate the treatments.
Final Answer
To prevent transfer of liquid between treatments.
To prevent transfer of liquid between treatments.
Walkthrough
The students use the same glass rod to crush apple in three different test-tubes: one with vitamin C, one with distilled water, and one with no liquid. If the rod is not cleaned between uses, a drop of vitamin C solution could be carried over into the distilled water tube or the no-liquid tube. This would introduce an uncontrolled variable, meaning the results for those tubes would be invalid. Cleaning the rod ensures that each treatment only contains what was intentionally added.
Key Takeaways
In any experiment with multiple treatments, shared equipment must be cleaned or replaced between uses to prevent cross-contamination. This is a fundamental control variable.
Common Mistakes
Students might write "to keep it clean" or "to avoid bacteria". The mark scheme specifically looks for the prevention of transfer of liquid or vitamin C between the different experimental conditions.
Things to Be Careful About
The mark scheme accepts "AW" (alternative wording) as long as the idea of preventing transfer between treatments is clear. Be precise: do not just say "to prevent contamination"; specify what is being transferred (liquid / vitamin C) and between what (the treatments / test-tubes).
The students noted that the apple tissue in each test-tube was white when they started timing.
They observed the colour of the apple tissue in each test-tube at 5, 10 and 15 minutes and recorded this in their notebooks.
Fig. 1.1 shows one of their notebooks.
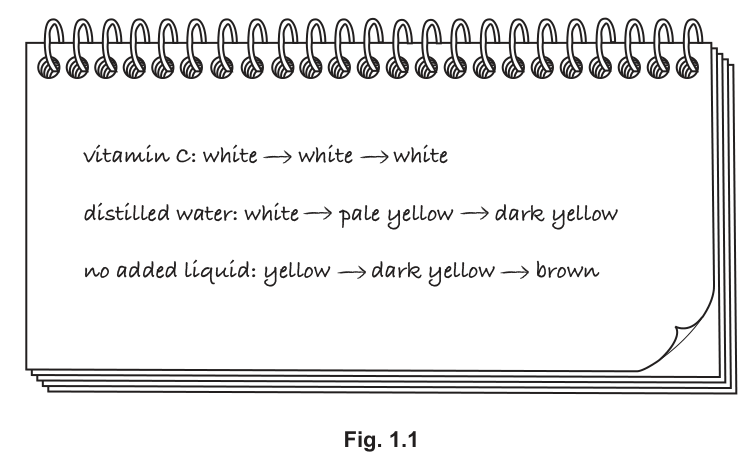
Complete the headings in Table 1.1 and use the observations in Fig. 1.1 to complete the table.
Table 1.1
| ______ | ______ | ||
|---|---|---|---|
| vitamin C | distilled water | no added liquid | |
| 0 | white | white | white |
| 5 | |||
| 10 | |||
| 15 |
Answer
| time / minutes | colour of apple : vitamin C | colour of apple : distilled water | colour of apple : no added liquid |
|---|---|---|---|
| 0 | white | white | white |
| 5 | white | white | yellow |
| 10 | white | pale yellow | dark yellow |
| 15 | white | dark yellow | brown |
See working.
Walkthrough
The question provides handwritten notes in Fig. 1.1 and asks to complete Table 1.1. The rows are labelled 0, 5, 10, 15, which correspond to the time in minutes. The columns are the three treatments: vitamin C, distilled water, and no added liquid. The observations are colours (white, pale yellow, dark yellow, yellow, brown). The first heading must be time with units (minutes), and the second set of headings must describe what is being measured (colour of apple).
Key Takeaways
When completing a table from raw notes, identify the independent variable (time) and the dependent variable (colour change) to determine the headings. Ensure units are included for quantitative headings like time.
Common Mistakes
- Forgetting the units in the time heading (e.g., writing "time" instead of "time / minutes").
- Misreading the notebook notes: for example, writing "yellow" for distilled water at 5 minutes instead of "white".
- Not entering a colour in every cell; the table must be fully populated.
Things to Be Careful About
The mark scheme awards marks for correct headings, a colour in all cells, and the correct colours. Pay close attention to the distinction between "white", "pale yellow", "dark yellow", and "yellow" as written in the notebook. The "no added liquid" tube turns yellow at 5 minutes, whereas the "distilled water" tube remains white at 5 minutes.
Using your observations in Table 1.1, state what can be concluded about the effect of vitamin C on the colour change when apple is cut up and crushed.
______
Answer
Vitamin C prevents the colour change (or turning brown) of the crushed apple.
Final Answer
Vitamin C prevents colour change.
Vitamin C prevents colour change.
Walkthrough
Looking at the completed table, the apple tissue in the vitamin C solution remains white at 0, 5, 10, and 15 minutes. In contrast, the other tubes change colour. The conclusion is simply that vitamin C stops or prevents the browning process.
Key Takeaways
A conclusion should directly answer the question using the data. If a variable prevents an effect, state that it prevents the effect. Do not over-explain the mechanism here; that is asked for in part (b).
Common Mistakes
Writing "vitamin C keeps the apple fresh" or "vitamin C stops rotting". The observation is specifically about colour change (browning), not general spoilage. The mark scheme requires the phrase "prevents colour change" or similar.
Things to Be Careful About
Keep the conclusion concise and directly tied to the observations. "Prevents colour change" is the exact phrasing in the mark scheme.
Using your observations in Table 1.1, state what can be concluded about the effect of distilled water on the colour change when apple is cut up and crushed.
______
Answer
Distilled water reduces the colour change compared to the apple with no added liquid (or exposed to air). However, it is not as effective as vitamin C at preventing the colour change.
Final Answer
Distilled water reduces colour change compared to no added liquid, but is not as effective as vitamin C.
Distilled water reduces colour change compared to no added liquid, but is not as effective as vitamin C.
Walkthrough
The question asks for the effect of distilled water. Comparing the "distilled water" column to the "no added liquid" column: at 15 minutes, distilled water is "dark yellow" while no added liquid is "brown". This shows distilled water slows down or reduces the browning. However, comparing it to vitamin C (which stays white), distilled water clearly does not prevent it completely. Therefore, it is less effective than vitamin C.
Key Takeaways
When asked about the effect of a treatment, compare it to the control (no added liquid) and to the most effective treatment (vitamin C) if relevant. A good conclusion captures both the reduction in effect and the relative effectiveness.
Common Mistakes
Saying "distilled water prevents colour change" is false; it only slows it down. Saying "distilled water is as effective as vitamin C" is also false. The mark scheme specifically looks for the comparison to no liquid/air and the comparison to vitamin C.
Things to Be Careful About
Two marks are awarded here. One for noting that distilled water reduces the change compared to no liquid, and one for noting it is not as effective as vitamin C. Both points are needed for full marks.
The students were aware that there may have been sources of error in the method used which affected their observations.
Suggest one possible source of error and suggest how it could be overcome.
______
Answer
| Source of error | Improvement |
|---|---|
| It is difficult to objectively assess or describe the colours. | Use a colour chart to match the colour of the apple tissue. |
Final Answer
See working.
See working.
Walkthrough
The experiment relies on subjective visual observation of colour changes (white, pale yellow, dark yellow, brown). A major source of error is that different people might describe the same shade differently. An improvement is to use a standard colour chart. Other valid errors include: the apple cubes not being crushed to the same extent (improvement: crush for the same amount of time or cut into a specific number of pieces), or the time taken to add the apple to the tubes varying (improvement: have multiple people add the apple simultaneously).
Key Takeaways
When evaluating a method, look for subjective measurements (like colour) or inconsistencies in preparation (like crushing). The improvement must directly address the error identified.
Common Mistakes
- Pairing an error with an unrelated improvement (e.g., "too few repeats" with "use a colour chart").
- Vague improvements like "be more careful" or "measure more accurately". The mark scheme rejects these.
- Suggesting "human error" as the source of error.
Things to Be Careful About
The mark scheme explicitly states "source of error must match improvement". Choose the easiest valid pair to write. The colour chart / subjective colour pair is the most straightforward for this specific experiment.
The students then measured the pH of the vitamin C solution and the pH of the distilled water using universal indicator paper, with these results:
distilled water: pH 6
vitamin C solution: pH 4.
Describe how you would use universal indicator paper to determine the pH of a liquid.
______
Answer
Dip a strip of universal indicator paper into the liquid, then compare the colour of the paper to the universal indicator colour chart to determine the pH.
Final Answer
Dip paper in liquid and compare colour to universal indicator colour chart.
Dip paper in liquid and compare colour to universal indicator colour chart.
Walkthrough
Universal indicator paper is a simple tool for estimating pH. The procedure is: 1) Dip the paper into the test liquid (or use a dropper to put a drop on the paper). 2) Observe the colour change on the paper. 3) Match that colour to the standard colour chart provided with the indicator paper. 4) Read the corresponding pH value.
Key Takeaways
Always mention both steps: dipping the paper AND comparing to the colour chart. Just saying "put paper in liquid" is incomplete.
Common Mistakes
- Writing "dip a pH meter in the liquid". The question specifically asks about universal indicator paper.
- Forgetting to mention the colour chart. The paper changes colour, but you need the chart to know what pH that colour represents.
Things to Be Careful About
The mark scheme awards one mark for dipping the paper and one mark for comparing to the colour chart. Ensure both are clearly stated.
When apple tissue is cut up and crushed, an enzyme comes into contact with oxygen in the air. In the presence of oxygen, the enzyme catalyses the reaction of a colourless molecule in the cells of the apple tissue to cause the change in colour.
Suggest how this might explain the effect of:
distilled water ______
vitamin C ______
Answer
- Distilled water: reduces the amount of oxygen available (or stops oxygen from getting to the apple tissue), so the enzyme cannot catalyse the reaction.
- Vitamin C: is an acid (has a low pH), which inhibits or denatures the enzyme (stops it from working), so the colour change does not occur.
Final Answer
See working.
See working.
Walkthrough
The stem states that cutting the apple causes an enzyme to contact oxygen, which catalyses a reaction that changes the colour. We need to explain why distilled water and vitamin C affect this.
- Distilled water: Submerging the apple in water displaces air, reducing the amount of oxygen that can reach the enzyme. Without oxygen, the enzyme cannot catalyse the colour-changing reaction. This explains why the change is slower than in air (no added liquid) but still happens.
- Vitamin C: The results in part (b)(i) show vitamin C has a pH of 4, making it acidic. Enzymes have an optimal pH; if the pH is too low (too acidic), the enzyme's active site can be altered (denatured) or inhibited, stopping it from working. Since the enzyme is stopped, no colour change occurs, even though oxygen is present.
Key Takeaways
When explaining experimental results, link the physical conditions (submersion in water, addition of acid) to the biological mechanisms (oxygen availability, enzyme denaturation/inhibition) described in the question stem.
Common Mistakes
- Saying "vitamin C kills the apple". Apples don't have living cells that need to be killed for this reaction; it's an enzyme-catalysed chemical reaction.
- Saying "distilled water dilutes the enzyme". Dilution doesn't stop an enzyme; lack of substrate (oxygen) does.
- Forgetting to mention oxygen for distilled water or pH/denaturation for vitamin C.
Things to Be Careful About
The mark scheme gives two routes for vitamin C: it is an acid/low pH + inhibits/denatures enzyme, OR it is more acidic so denatures the enzyme to a greater degree. Both are acceptable. For distilled water, the key is reducing oxygen availability. Ensure both parts of the question are answered.
Yeast is used to produce bread. Flour is mixed with water and yeast to produce dough. The yeast breaks down starch in the flour to produce sugar. The yeast uses the sugar for respiration, giving off bubbles of carbon dioxide. The bubbles of carbon dioxide are trapped in the dough, making it increase in volume before it is baked.
Some students tested the effect of yeast in four doughs, each made from a different type of flour – wheat, rye, buckwheat and maize. The effect of the yeast in the dough was evaluated by measuring how much the dough increased in volume.
The same mass of each type of flour was mixed with the same volume of water and the same mass of yeast to form a dough. Four measuring cylinders were labelled and dough was added to each. The volume of the dough in each of the cylinders was measured and recorded at 15-minute intervals. Some of the results are shown in Table 2.1.
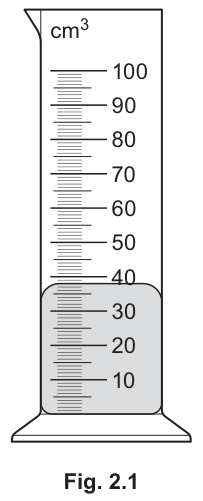
Fig. 2.1 shows the measuring cylinder with dough made from wheat flour after 30 minutes.
Record the volume of the dough in Table 2.1.
Answer
38
38
Walkthrough
To find the volume of the dough from Fig. 2.1:
- Look at the scale on the measuring cylinder. Major numbered marks are every (10, 20, 30, 40, etc.).
- Between each numbered line (e.g. between 30 and 40), there are 10 subdivisions, meaning each small line represents .
- The flat top surface of the dough sits exactly at 8 small divisions above 30, which gives .
Key Takeaways
- Always determine the value of each minor graduation on a measuring instrument before recording a value.
- The units are already given in the table header, so only the number is required in the cell.
Common Mistakes
- Misreading the scale divisions (e.g. counting from 40 downwards incorrectly or assuming divisions are ).
Things to Be Careful About
- Write only the number "38" into the table cell; do not add "cm³" as the column header already specifies the unit.
Complete Table 2.1 by calculating the total increase in volume of each dough after 45 minutes.
Table 2.1
| time / minutes | volume of dough in measuring cylinder / | |||
|---|---|---|---|---|
| wheat flour | rye flour | buckwheat flour | maize flour | |
| 0 | 20 | 21 | 21 | 20 |
| 15 | 24 | 23 | 21 | 21 |
| 30 | 27 | 22 | 22 | |
| 45 | 45 | 32 | 23 | 22 |
| total increase in volume after 45 minutes | 25 |
Working
- Wheat flour:
- Rye flour:
- Buckwheat flour:
- Maize flour:
Answer
| time / minutes | volume of dough in measuring cylinder / | |||
|---|---|---|---|---|
| wheat flour | rye flour | buckwheat flour | maize flour | |
| 0 | 20 | 21 | 21 | 20 |
| 15 | 24 | 23 | 21 | 21 |
| 30 | 38 | 27 | 22 | 22 |
| 45 | 45 | 32 | 23 | 22 |
| total increase in volume after 45 minutes | 25 | 11 | 2 | 2 |
11, 2, 2
Walkthrough
The total increase in volume after 45 minutes is calculated by subtracting the initial volume at 0 minutes from the final volume at 45 minutes for each flour type:
- For rye flour:
- For buckwheat flour:
- For maize flour:
Each calculated value is entered into its respective column in the bottom row of Table 2.1.
Key Takeaways
- Increase in volume = (Volume at 45 minutes) - (Volume at 0 minutes).
Common Mistakes
- Writing units (such as ) in the body cells of the table (explicitly rejected by mark schemes when headers already include units).
- Subtracting consecutive intervals (e.g. 45 min minus 30 min) instead of calculating the total increase from 0 minutes.
Things to Be Careful About
- Ensure values are placed correctly in each column corresponding to the right flour type.
On the grid draw a bar chart to show the total increase in volume of the four doughs after 45 minutes.
Answer
Bar chart of total increase in volume after 45 minutes for the four flour types
Walkthrough
To construct a fully scoring bar chart:
- Axes and Labels:
- Vertical y-axis: "total increase in volume after 45 minutes / " (or "total increase in volume / ").
- Horizontal x-axis: "type of flour" (or individual flour names labelling each bar centrally).
- Scale:
- Must be linear and starting from 0 on the y-axis (e.g. 2 cm / 1 major grid square = , or per 2 major grid squares).
- Must use more than half of the provided grid height ( plotted in the upper half of the grid) and width.
- Plotting:
- Wheat =
- Rye =
- Buckwheat =
- Maize =
- Bar Drawing Conventions:
- Bars must be ruled with a straight edge.
- All bars must have equal width.
- Bars must not touch each other and should have equal spacing between them.
Key Takeaways
- Bar charts are used for discontinuous/discrete independent variables (such as flour types).
- Bars should never touch unless representing continuous histogram data.
Common Mistakes
- Bars of unequal widths or touching bars.
- Missing units on the y-axis label.
- Non-linear scale on the y-axis.
Things to Be Careful About
- Accurately align the bar heights to grid lines ().
The students wanted to know why the effect of yeast in the four doughs varied.
Table 2.2 shows some of the biological molecules in the four flours.
Table 2.2
| biological molecule | mass / per flour | |||
|---|---|---|---|---|
| wheat flour | rye flour | buckwheat flour | maize flour | |
| starch | 54.5 | 54.1 | 59.0 | 74.0 |
| gluten (a protein) | 8.9 | 3.1 | 0.0 | 0.0 |
| fibre | 10.6 | 13.7 | 10.4 | 4.3 |
Using Table 2.2, your bar chart and the information about the process of bread production, suggest and explain how these biological molecules affect the total increase in volume of bread dough.
______
Answer
- Gluten (protein) content affects the total increase in volume, as higher gluten content corresponds to a greater increase in volume (wheat has the most gluten and greatest volume increase, followed by rye, while buckwheat and maize have no gluten and the lowest volume increase).
- The dough with more gluten is able to trap more bubbles of carbon dioxide gas produced by yeast respiration.
- Starch and fibre have little or no effect on the volume increase because their amounts do not correlate with the differences in volume increase (e.g. maize has the highest starch content but the lowest volume increase).
Gluten content correlates with volume increase by trapping carbon dioxide bubbles, whereas starch and fibre show no correlation with volume increase.
Walkthrough
- Identify correlation with gluten: Wheat contains gluten per and showed the largest increase (). Rye has gluten and increased by . Buckwheat and maize have gluten and showed minimal increases (). Therefore, gluten content directly matches the trend in volume increase.
- Explain the mechanism: The prompt states that yeast respiration produces carbon dioxide bubbles that are trapped in dough. Gluten provides elasticity to trap these bubbles, causing the dough to expand.
- Evaluate other molecules: Starch content is highest in maize (), yet maize had the lowest volume increase. Fibre content is highest in rye () and similar in wheat and buckwheat, showing no direct pattern with volume increase. Hence, starch and fibre do not determine the dough expansion.
Key Takeaways
- Making a valid scientific conclusion requires looking at both positive correlation and the lack of correlation among variables.
Common Mistakes
- Concluding that starch is the main factor simply because starch is broken down into sugar for yeast respiration, without checking the data in Table 2.2.
Things to Be Careful About
- Ensure you refer to carbon dioxide bubbles being trapped, as outlined in the question context.
Answer
- Add iodine solution to a sample of each flour.
- A blue-black (or black) colour confirms the presence of starch.
Add iodine solution; turns blue-black.
Walkthrough
- Reagent: Iodine solution (or iodine in potassium iodide solution) is the specific reagent used to test for starch.
- Result: In the presence of starch, iodine solution changes from yellow-brown / orange-brown to blue-black (or black).
Key Takeaways
- Starch test: Reagent = iodine solution; Positive result = blue-black.
Common Mistakes
- Stating that heat is required (heating is for Benedict's test, not iodine).
- Writing "purple" (purple is the biuret test for protein).
Things to Be Careful About
- Name the reagent correctly as "iodine solution" (or "iodine").
The students made more dough from wheat flour, yeast and water.
Using this dough, plan an investigation based on the method in 2(a) to determine the effect of temperature on the increase in volume of dough at temperatures between and .
Predict your expected results.
investigation plan ______
expected results ______
Answer
Investigation plan:
- Divide the prepared wheat dough equally (same mass or starting volume, e.g. ) into measuring cylinders.
- Set up at least three different temperatures between and (e.g. , , and ) using thermostatically controlled water-baths.
- Place a measuring cylinder with dough into each water-bath.
- Measure and record the volume of the dough at regular time intervals (e.g. every 15 minutes) for a set duration such as 45 minutes.
- Calculate the total increase in volume after 45 minutes for each temperature.
- Repeat the investigation at least 3 times for each temperature and calculate the mean increase in volume.
- Plot a graph of total volume increase on the y-axis against temperature on the x-axis.
Expected results:
- As temperature increases from up to an optimum temperature (around ), the total increase in volume will increase because yeast respiration and enzyme activity increase.
- Above the optimum temperature (towards ), the total increase in volume will decrease / stop because yeast enzymes become denatured and yeast cells are killed.
Plan: Equal volumes of dough placed in water-baths at 3+ temperatures between 20 °C and 80 °C; volume recorded at set intervals (45 min) to find volume increase; repeat 3 times and find mean. Prediction: Volume increase rises to an optimum then decreases at higher temperatures due to enzyme denaturation.
Walkthrough
To score full marks on a 6-mark planning question:
- Standardising the sample: Divide the dough equally by mass or initial volume into identical measuring cylinders.
- Independent variable: Choose at least 3 distinct temperatures strictly within the specified range ( to ), e.g. , , , .
- Apparatus for temperature control: Use water-baths to maintain constant temperatures.
- Dependent variable measurement: Measure dough volume at fixed time intervals (e.g. every 15 minutes up to 45 minutes) and calculate total increase in volume.
- Reliability and Processing: Repeat at least 3 times at each temperature, calculate the mean, and plot volume increase against temperature.
- Prediction: State that rate/volume increase rises with temperature up to an optimum (around ) due to increased kinetic energy, then decreases at high temperatures because yeast enzymes denature.
Key Takeaways
- Planning questions require: independent variable range, method of control, dependent variable measurement, control variables, repeats/mean, and a scientific prediction.
Common Mistakes
- Stating temperatures outside the specified range (e.g. or ). The prompt specified between and .
- Forgetting to mention water-baths to maintain the temperatures.
- Omitting repeats or calculation of the mean.
Things to Be Careful About
- Ensure both the investigation plan and the expected results sections are fully answered, as 1 mark is allocated specifically to the prediction.
A student investigated a plant that had some stems with flowers and some stems with no flowers. The student picked one leaf from a stem with flowers and one leaf from a stem with no flowers.
Fig. 3.1 shows the two leaves.
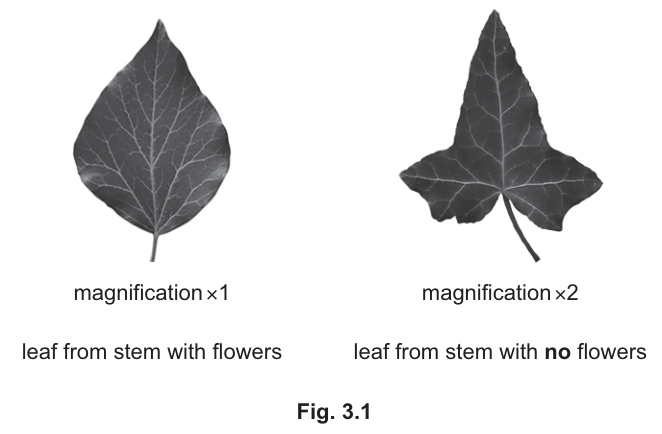
Complete Table 3.1 to compare the size and shape of the leaves.
Table 3.1
| feature of leaf | leaf from stem with flowers | leaf from stem with no flowers |
|---|---|---|
| size | ||
| shape |
Answer
| feature of leaf | leaf from stem with flowers | leaf from stem with no flowers |
|---|---|---|
| size | large / larger | small / smaller |
| shape | longer than wide, pointed oval with just one point at the tip | widest at the base, with three pointed sections (lobes) |
See working
Walkthrough
The table asks for a comparison of size and shape between two leaves photographed at different magnifications. The left leaf is shown at and the right leaf at , so although the right leaf looks bigger on the page, it is actually the smaller leaf — you must mentally divide its image size by 2 before comparing. So the flowering-stem leaf is larger, and the non-flowering-stem leaf is smaller.
For shape: the left leaf is an unlobed oval that tapers to a single point — longer than it is wide. The right leaf is the classic ivy-type leaf: broadest at the base where it joins the petiole, with three pointed lobes fanning out from that base.
Key Takeaways
- Always check magnification before comparing sizes on photographs; apparent size is not actual size.
- Comparisons should be written as paired statements naming both leaves.
- Shape descriptions should use precise terms: 'pointed oval', 'lobed', 'widest at the base'.
Common Mistakes
- Saying the lobed leaf is bigger because it appears bigger in Fig. 3.1 — ignoring the magnification label.
- Writing vague shapes such as 'one is rounder' instead of describing the outline ('three pointed sections', 'widest at base').
- Describing only one leaf rather than comparing both columns.
Things to Be Careful About
- Each row earns one mark for a correct comparison, so fill in both cells of each row.
- Use comparative language ('larger', 'smaller') or clear absolute descriptions — either scores, but the pair must be consistent.
Suggest what the student needs to do to be certain that the two leaves they picked are representative of the leaves on the two types of stem.
______
Answer
Collect more leaves from both types of stem;
and check that the leaves from each stem are similar to (the same as) the two leaves selected.
Collect more leaves from both stem types and check they are similar to the two selected
Walkthrough
A single leaf picked from each stem type may not be typical — leaves vary within a plant, and one unusual leaf would give a false comparison. To be certain the two leaves are representative, the student must sample several leaves from each type of stem and confirm that they look like the ones already chosen. If all the extra leaves match, the original pair can be trusted as representative.
This is the same sampling logic used throughout biology: more samples reduce the chance that an atypical individual distorts your conclusion.
Key Takeaways
- One specimen is never enough to claim representativeness; sampling several and checking consistency is the standard improvement.
- A good answer names what to do (collect more) AND how this confirms representativeness (they should be similar).
Common Mistakes
- Writing only 'collect more leaves' without saying why or what to do with them — the second mark needs the checking step.
- Vague answers such as 'repeat the experiment' without specifying collecting more leaves from both stem types.
- Suggesting measuring the leaves precisely — the question is about being representative, not about measurement accuracy.
Things to Be Careful About
- Two marks means two distinct points: collect more, then verify similarity. Give both.
In the space below, make a large drawing of the leaf from the stem with no flowers as it appears in Fig. 3.1.
Answer
Draw the ivy-type leaf from the stem with no flowers exactly as it appears in Fig. 3.1:
- sharp pencil, clean continuous lines, no shading or stippling, no ruled lines, labels not overlapping the drawing;
- drawn at least 80 mm high, in the correct proportions and orientation;
- show the notch in the right lobe at the base, at least three side veins branching from the top of the petiole (one running into each lobe), and draw the petiole as a double line.
Large drawing of the five-lobed leaf, at least 80 mm high, continuous pencil lines, no shading, notch in right basal lobe, three side veins radiating from the top of the petiole, petiole as a double line
Walkthrough
Biological drawing marks are awarded for technique as much as content. The mark scheme splits into three blocks:
- Drawing conventions — use a sharp pencil so lines stay fine and clean; every outline is one continuous unbroken line; absolutely no shading, stippling or cross-hatching (tone is not allowed in scientific drawing); no ruled lines anywhere; and any labels must not overlap the drawing itself.
- Size and accuracy — the drawing must be at least 80 mm tall (measure it before you finish) and must reproduce the proportions and orientation of the photograph: a five-lobed ivy-type leaf, pointed tip uppermost, petiole at the bottom.
- Specific detail — the scheme names three features: the notch cut into the right-hand lobe near the base (visible in Fig. 3.1); at least three side veins leaving the top of the petiole, one heading into each lobe; and the petiole drawn as a double line, because tubes and stalks are always drawn with two parallel lines.
Key Takeaways
- Learn the standard drawing rules: sharp pencil, continuous single lines, no shading, generous size, correct proportions.
- Stalks, midribs and tubes get double lines; veins branch from the top of the petiole.
- Always include the specific detail named in the question or visible in the specimen — here, the notch in the right lobe.
Common Mistakes
- Shading or stippling to show the dark leaf surface — instantly loses the convention mark.
- Drawing too small: under 80 mm loses the size mark even if everything else is right.
- Single-line petiole, or side veins omitted or not reaching the lobes.
- Using a ruler for outlines — ruled lines are rejected.
- Copying the wrong leaf: the question asks for the lobed leaf from the stem with no flowers, not the oval one.
Things to Be Careful About
- Measure your drawing height against the 80 mm requirement before moving on.
- Keep labels outside the outline with clean label lines touching the correct structure.
- Draw what you see, including imperfections like the notch — idealised symmetry loses the detail mark.