Biology 5090/32 — October/November 2025
Cambridge O-Level · Practical Test · worked solutions for every part, with the mark scheme
Topics Experimental Contexts · Observations and Measurements · Analysis, Conclusions and Evaluation · Planning Experiments and Investigations · Microscopy and Biological Drawing · Use of Techniques, Apparatus and Materials
Hydrogen peroxide is a harmful waste product in living cells. The enzyme catalase breaks down hydrogen peroxide into water and oxygen.
You are going to investigate catalase in tissues from different plants. Small filter paper discs can be placed on the cut surface of plant tissues to absorb liquid from the cells. The liquid might contain catalase.
Fig. 1.1 shows how you can tell if catalase is present in tissues from different plants.
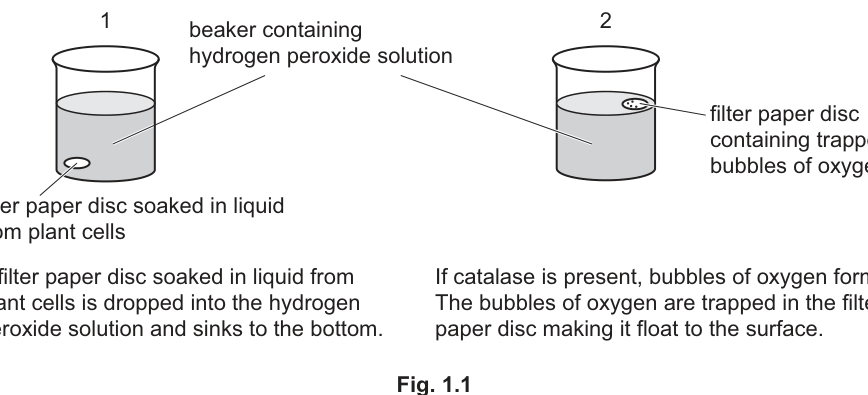
You are provided with pieces of tissue from three different plants (labelled A, B and C), small filter paper discs and a beaker of hydrogen peroxide solution.
Read through the following procedure carefully before you begin.
As hydrogen peroxide solution may cause damage to eyes, wear eye protection while you do this investigation.
- Cut the piece of plant tissue A in half.
- Use forceps to place a filter paper disc onto a cut surface of plant tissue A, to absorb liquid from the cells.
- Slowly and quietly count to 10.
- Use forceps to pick up the filter paper disc from the cut surface of plant tissue A.
- Drop the filter paper disc into the beaker of hydrogen peroxide solution and immediately start timing.
- The filter paper disc should sink to the bottom of the beaker. If it doesn't sink, then tap it gently with forceps so that it sinks.
- Observe the filter paper disc until it reaches the surface of the hydrogen peroxide solution, then stop timing. If a filter paper disc does not float within 4 minutes (240 seconds) stop timing and record the time taken for the filter paper disc to reach the surface as >240.
- In Table 1.1, record the time taken, to the nearest whole second, for the filter paper disc to reach the surface of the hydrogen peroxide solution.
- Use forceps to remove the filter paper disc from the beaker of hydrogen peroxide solution and place it in the waste container provided.
- Use the rinsing water to rinse the forceps. Dry the forceps before continuing.
- Repeat the procedure two more times with filter paper discs on the same cut surface of plant tissue A.
- Repeat all of the procedure for filter paper discs on plant tissue B and then again for plant tissue C, recording all your results in Table 1.1.
Complete Table 1.1 by calculating the mean times for the filter paper discs, from tissues A, B and C, to reach the surface.
Record your results to the nearest whole second.
Table 1.1
| plant tissue | time taken for filter paper disc to reach the surface/seconds | |||
|---|---|---|---|---|
| disc 1 | disc 2 | disc 3 | mean | |
| A | ||||
| B | ||||
| C |
Answer
Complete every cell of Table 1.1 with the three measured times for each tissue and the calculated means, for example:
| plant tissue | disc 1 / s | disc 2 / s | disc 3 / s | mean / s |
|---|---|---|---|---|
| A | (candidate's readings, each a whole number of seconds) | (sum of the three readings ÷ 3, rounded to the nearest whole second) | ||
| B | (candidate's readings) | (sum of the three readings ÷ 3, rounded to the nearest whole second) | ||
| C | (candidate's readings) | (sum of the three readings ÷ 3, rounded to the nearest whole second) |
All recorded times are whole numbers of seconds; where a disc did not float within 4 minutes, record >240. The means for A and B are less than 240, and the mean for C is greater than the means for A and B.
Table 1.1 completed with all nine timings and three means, each to the nearest whole second; means for A and B less than 240 and mean for C greater than those for A and B (values depend on the candidate's own results).
Walkthrough
This is a practical data-recording part: the marks come from how you handle your own timings, not from any fixed numbers.
- Fill in every cell. Three discs for each of three tissues gives nine timing readings, plus three means — twelve cells in total. Leaving any cell blank loses the first mark.
- Calculate each mean by adding the three times for a tissue and dividing by 3. Round to the nearest whole second — the question says so, and the mark scheme awards a mark for 'only whole number of seconds recorded'. So a mean of 43.33 s is written as 43, and 43.67 s as 44.
- Use the >240 convention. If a disc never floated, the time is recorded as >240, not as a dash, a cross, or 'no result'. The mark scheme expects plants A and B to float (times below 240) and C not to, so C's row will show readings of >240 and a mean recorded as >240.
- Check the pattern. The scheme credits 'all C > A and B' — the mean for tissue C must be larger than the means for A and B, because C contains no catalase so its discs never rise.
Key Takeaways
- Repeats allow a mean, which smooths out random variation in timing.
- Record to the precision asked for — here, whole seconds only.
- A result that never happens is still a result: record it as >240 (greater than the cut-off time).
Common Mistakes
- Writing means to one or two decimal places — the scheme requires whole seconds only.
- Recording a disc that did not float as '—', 'x' or 'no reaction' instead of >240.
- Leaving cells blank; the first mark is for data entered in all cells.
- Averaging the >240 entries as if 240 were a real measured time — record C's mean as >240.
Things to Be Careful About
- The mark scheme says 'refer to supervisor's report', so your values must be consistent with the tissues actually provided — but the marking points about whole seconds, all cells filled, and C being slowest apply regardless of your exact numbers.
- Start timing the moment the disc is dropped, and stop the instant it reaches the surface, so your times are comparable.
Using your results in Table 1.1, state what you can conclude about catalase in the plant tissues A, B and C.
tissue A ______
tissue B ______
tissue C ______
Answer
- tissue A: has the most catalase (fastest floating time, so most oxygen produced)
- tissue B: has catalase, but less than A
- tissue C: has no catalase (disc did not float within 240 s)
A has the most catalase; B has catalase (less than A); C has no catalase.
Walkthrough
The logic of the whole investigation sits in this part. Catalase breaks hydrogen peroxide down into water and oxygen. The oxygen gas bubbles are trapped in the filter paper disc, making it less dense than the solution, so it floats. The more catalase in the absorbed liquid, the faster oxygen is made, the sooner the disc floats — so a shorter time means more catalase.
- Tissue A floated fastest, so its cells released the most catalase.
- Tissue B floated, but more slowly, so it has catalase but less of it (or less active catalase).
- Tissue C never floated within 240 s, so no oxygen was produced — no catalase was present in the absorbed liquid.
Key Takeaways
- In this disc-floating method, time to float is inversely related to catalase activity: less time = more enzyme.
- A conclusion must be tied to the data — quote the pattern (A fastest, C never floats), not just a guess.
Common Mistakes
- Reversing the relationship and saying A has the least catalase because its time is smallest.
- Saying C has 'slow catalase' — if the disc never floated, no oxygen was produced, so the conclusion is that no catalase is present.
- Writing 'catalase is present' for all three without ranking A against B — the data distinguish them.
Things to Be Careful About
- Use the word catalase (or 'enzyme') in each blank — the mark scheme credits 'catalase / enzyme' in every line.
- 'Most catalase' for A needs the comparative idea; 'has catalase' alone for B is fine, but adding 'less than A' makes the ranking clear.
Suggest why the filter paper discs were left on the cut surfaces of the plant tissues while you counted to the same number each time.
______
Answer
Leaving each disc for the same time means each disc absorbs the same volume of liquid from the tissue, so the volumes of liquid are the same for A, B and C and the results are comparable (the volume absorbed is not a variable).
So each disc absorbs the same volume of liquid, making the results comparable.
Walkthrough
A filter paper disc soaks up liquid from the cut surface. The longer it sits there, the more liquid it absorbs. If disc 1 stayed for a count of 5 and disc 2 for a count of 30, disc 2 would hold more liquid — and possibly more catalase — for a reason that has nothing to do with the tissue itself. Counting to the same number every time fixes the contact time, so the volume of liquid absorbed is the same for every disc. That makes the volume a controlled variable, so any difference in floating time must be due to the amount of catalase in the tissue, not to how much liquid was picked up.
Key Takeaways
- In a fair test, all variables except the independent variable must be controlled.
- Standardising a step in the method (same soaking time) controls a variable (volume absorbed).
Common Mistakes
- Saying only 'to make it fair' without naming what is kept the same — the mark needs 'same volume of liquid'.
- Saying it controls the amount of catalase directly; the disc cannot select catalase, it absorbs liquid, and the catalase comes in that liquid.
Things to Be Careful About
- Both marks are linked: first the same volume absorbed, then comparability / volume not being a variable. Give both halves.
Answer
A filter paper disc soaked in water (containing no enzyme), treated in exactly the same way and dropped into hydrogen peroxide solution.
A disc soaked in water (no enzyme); alternatively, a disc from boiled tissue (enzyme denatured).
Walkthrough
A control checks that the effect you see is caused by the factor being tested — here, catalase — and not by the filter paper, the hydrogen peroxide or the procedure itself. A control must be identical to the experimental set-up except that the factor under test is absent.
Two standard controls work here:
- A disc soaked in water instead of tissue liquid. Water contains no catalase, so if this disc still floats, something other than catalase is causing floating.
- A disc from boiled tissue. Boiling denatures enzymes, so any catalase is destroyed; if the disc from boiled tissue still floats, the floating was not due to active enzyme.
Either is acceptable; the water disc is the simpler one to describe.
Key Takeaways
- A control differs from the experimental condition in exactly one respect: the factor being investigated is removed or inactivated.
- For enzyme work, controls either omit the enzyme or denature it by boiling.
Common Mistakes
- Suggesting a disc with no hydrogen peroxide — that removes the substrate, which tests the wrong thing.
- Saying 'a disc with nothing on it' without saying what liquid replaces the tissue liquid.
- Describing a boiled disc without saying why boiling works (it denatures the enzyme).
Things to Be Careful About
- The mark scheme allows only one mark here, from 'water in disc (as no enzyme)' or 'boiled tissues (to denature enzyme)' — give one clean control, not a list.
Lemna is a small green plant that floats on the surface of water in ponds and lakes. It consists of leaves that float and a root that hangs down in the water.
Fig. 2.1 shows a single plant that has four leaves. D and E indicate the maximum length of two of the plant's leaves.
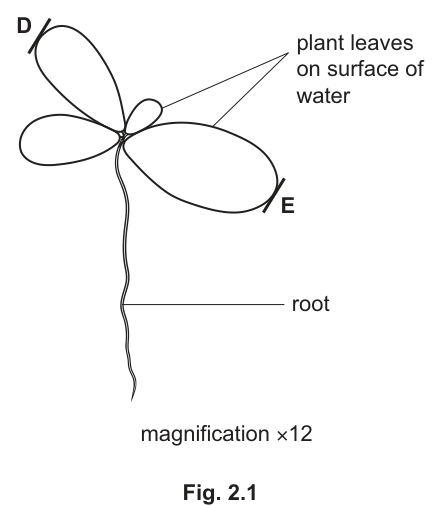
On Fig. 2.1, draw a straight line to join D and E. Measure the length of the line and record it.
______
Calculate the actual maximum length of two of the plant's leaves and record it to the nearest whole number.
______
Working
Line drawn straight from D to E measures (accepted range –).
Answer
Length of line =
Actual maximum length of the leaves = (to the nearest whole number)
Line 49–51 mm; actual length 4 mm
Walkthrough
The question asks you to draw a straight line joining the marks D and E across the two leaves, measure it with a ruler in mm, and then convert the measured (image) length into the real-life length using the printed magnification of .
The relationship is:
so rearranging:
The mark scheme accepts a measured line of – (the printed figure is about ). Dividing by 12 gives about , which rounds to — the answer required 'to the nearest whole number'.
Key Takeaways
- Magnification compares image size with actual size; to find actual size, divide the measured image size by the magnification.
- Always measure in mm as the blank asks, and keep the unit with the number.
- 'To the nearest whole number' means round at the very end, after the division.
Common Mistakes
- Multiplying by 12 instead of dividing — that gives about , absurdly large for a tiny duckweed leaf.
- Drawing a curved line or joining the wrong points; the scheme credits a straight line between D and E.
- Rounding too early, or giving the answer with a decimal when 'nearest whole number' is demanded.
- Omitting the unit mm on the measured line.
Things to Be Careful About
- Any measured value between and scores, so small ruler inaccuracies are tolerated — but the division and rounding must be correct for your own value.
- The three marks are: the correct straight line and measurement, the division by 12, and the rounding. Show the division explicitly so the examiner can award the working mark.
The population of this plant grows by each plant dividing into two smaller plants. These smaller plants then grow new leaves and divide again.
Some students decided to investigate the growth of Lemna plants. They placed six plants in a small beaker containing nutrients in distilled water (nutrient solution). They used a lamp to provide constant light.
Answer
Plants need nutrients (mineral ions) for growth.
Plants need nutrients for growth.
Walkthrough
Distilled water contains no dissolved mineral ions. Lemna is a green plant that needs mineral ions (such as nitrate and magnesium) to build proteins and chlorophyll and to grow new leaves. Adding nutrients to the distilled water ensures the plants have the minerals they need to grow and divide, so the investigation measures growth rather than starvation.
Key Takeaways
- Distilled water is pure water — no mineral ions.
- Plants require mineral ions (e.g. nitrates for amino acids and proteins, magnesium for chlorophyll) for healthy growth.
Common Mistakes
- Writing 'so the plants don't die' — the mark is for the word growth, not survival.
- Saying 'for energy' — mineral ions do not provide energy; glucose does.
Things to Be Careful About
- The mark scheme underlines growth: your answer must contain that word (or 'grow'). 'For photosynthesis' alone does not score.
The students decided to measure growth by counting the total number of leaves at the same time each day. At the start of the investigation there were 16 leaves in total on the plants.
Fig. 2.2 shows the beaker seen from above on day 4.
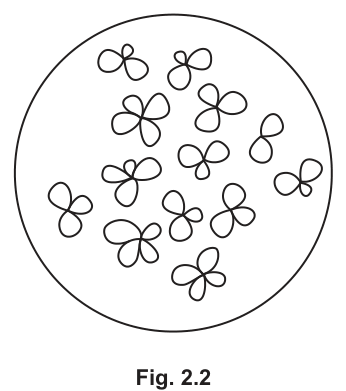
Count the total number of leaves visible in Fig. 2.2 and enter the number in Table 2.1.
Table 2.1
| time / days | total number of leaves |
|---|---|
| 0 | 16 |
| 2 | 20 |
| 3 | 29 |
| 4 | |
| 5 | 55 |
| 6 | 83 |
| 7 | 91 |
Answer
Total number of leaves on day 4 = 42
| time / days | total number of leaves |
|---|---|
| 4 | 42 |
42
Walkthrough
Count every leaf visible in Fig. 2.2, seen from above. Each Lemna plant has several small oval leaves; count them individually, marking each one as you count so none is counted twice. The correct total is 42, which fits the trend in the table: 29 on day 3 rising to 55 on day 5, so day 4 must lie between them.
Key Takeaways
- When counting objects in a diagram, mark them off systematically to avoid double-counting or missing any.
- A quick sanity check against neighbouring data values catches counting errors.
Common Mistakes
- Counting clusters (plants) instead of individual leaves.
- Double-counting leaves where plants overlap.
Things to Be Careful About
- The value must fit between 29 (day 3) and 55 (day 5); 42 does, so it is consistent.
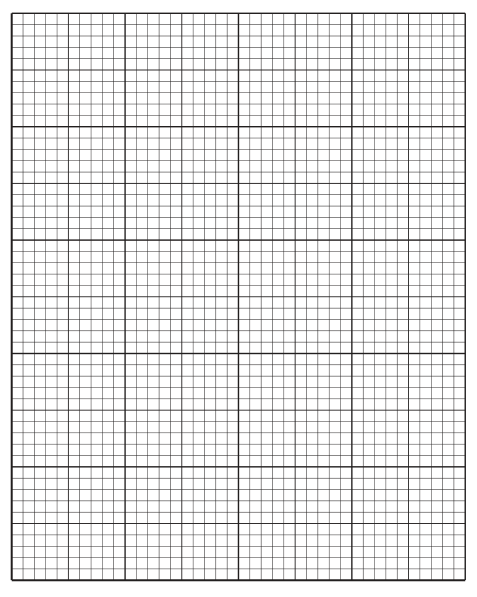
On the grid, draw a line graph of the data shown in Table 2.1.
Join the points with ruled, straight lines.
Answer
- x-axis: time / days; y-axis: total number of leaves — both axes fully labelled with units.
- Linear scales chosen so the plotted points use more than half the grid in both directions, with a value written at the origin of each axis.
- All seven points plotted correctly: (0, 16), (2, 20), (3, 29), (4, 42), (5, 55), (6, 83), (7, 91).
- Points marked with small crosses (or encircled dots).
- Points joined with a single series of ruled, straight lines.
Line graph of total number of leaves against time / days, seven points plotted and joined with ruled straight lines
Walkthrough
Time is the independent variable, so it goes on the x-axis; the total number of leaves (the dependent variable) goes on the y-axis. Both axes must be labelled with the quantity AND its unit, exactly as the table headers give them: 'time / days' and 'total number of leaves'.
Choose linear scales that spread the data over at least half the grid: time runs 0–7 days and leaf numbers run 16–91, so a y-scale of 0–100 in convenient steps works well. Write a value at the origin of each axis (0 on both). Plot each of the seven points precisely — to within half a small square — and mark each with a small cross. Finally, join the points with ruled straight lines, point to point, as the question instructs; do not draw a smooth curve and do not extrapolate beyond day 7.
Key Takeaways
- Independent variable on the x-axis, dependent variable on the y-axis, both labelled with units in slash form.
- Scales must be linear, easy to read, and use at least half the grid.
- 5090 accepts ruled straight lines between points OR a smooth curve — here the question specifies ruled lines.
Common Mistakes
- Omitting the unit from an axis label ('time' instead of 'time / days').
- Using an awkward scale (e.g. steps of 3) that makes plotting and reading difficult.
- Plotting points as large dots or joining them freehand.
- Starting an axis at a value with no number at the origin.
Things to Be Careful About
- The five marks are: axis choice and full labelling; scales; the seven plots; the point markers; and the ruled line. Each is awarded separately, so check each one.
- Plot (4, 42) uses the value you counted in (b)(ii) — if your count was wrong, the plot mark is lost even though the rest is correct.
Use your graph to estimate the total number of leaves that would have been present on day 1. Show your working on your graph.
total number of leaves on day 1 = ______
Answer
A ruled construction line drawn from day 1 on the x-axis up to the graph line, then across to the y-axis.
total number of leaves on day 1 = 18
18 (with construction lines shown on the graph)
Walkthrough
Day 1 was not measured, but the graph line between day 0 and day 2 lets you interpolate. Draw a ruled line vertically up from day 1 on the x-axis until it meets the graph line, then a ruled line horizontally across to the y-axis. Read the value where it crosses: about 18 leaves.
The first mark is for showing this construction on the graph — a single line from the graph line to either axis is enough. The second mark is for the value itself, and the scheme accepts a reading consistent with the candidate's own graph, so a value close to 18 (roughly 17–19) scores.
Key Takeaways
- Interpolation means reading a value between two plotted points — always legitimate on a straight-line section of a graph.
- Always show construction lines; the mark scheme explicitly credits them.
Common Mistakes
- Reading the value without drawing any construction lines — losing the first mark.
- Extrapolating instead of interpolating, or misreading the scale.
Things to Be Careful About
- The accepted value follows from your own graph; state the value you read, and make sure it lies between 16 (day 0) and 20 (day 2).
Predict the shape of the graph after day 7 if the investigation continues for another six days. Explain your answer.
prediction = ______
explanation = ______
Answer
prediction = the line would level off / become horizontal (increase more slowly, gradient decreasing)
explanation = the plants would run out of space / nutrients, as they fill the water surface
Graph levels off; because space or nutrients run out as the surface fills
Walkthrough
The data show rapid growth: leaf numbers roughly double between day 4 and day 6. But a small beaker is a closed, limited environment. As the population grows, two resources become limiting: the water surface fills up (leaves need space and light) and the dissolved nutrients in a fixed volume of solution get used up. When a resource is limiting, growth slows and eventually stops, so the graph would flatten into a horizontal line rather than continue rising steeply.
This is the same shape of reasoning as any population-growth curve: exponential rise while resources are plentiful, then a plateau as a limiting factor takes effect.
Key Takeaways
- Growth curves in limited environments level off because a resource becomes limiting.
- For an 'explain' mark, you must name the limiting factor — space or nutrients — not just say 'the plants stop growing'.
Common Mistakes
- Predicting the line keeps rising steeply — ignoring the finite beaker.
- Giving a prediction with no explanation, or a vague explanation like 'they run out of things'.
- Saying the population would decrease/die — the scheme wants levelling off.
Things to Be Careful About
- Both marks are linked: the shape (level off / less steep) AND the reason (space or nutrients). Give both halves explicitly.
Suggest one other method that the students could use to measure the growth of Lemna.
______
Answer
Measure the total surface area of the leaves (or measure the mass of the plants).
Calculate the surface area of the leaves / measure the mass of the plants
Walkthrough
Growth is an increase in size or mass, and counting leaves is only one way to track it. Any other measurable quantity that increases as the plants grow would do: the total surface area covered by the leaves (which can be estimated from the beaker seen from above, as in Fig. 2.2), or the total mass of the plants (blotted dry and weighed). Either scores the mark.
Key Takeaways
- Growth can be quantified in several ways: number of individuals/parts, total mass, or total area.
Common Mistakes
- Suggesting 'measure the root length' — the scheme limits credit to surface area or mass.
- Suggesting something not actually measurable, like 'how healthy they look'.
Things to Be Careful About
- Only one method is needed — 'max one'. Adding more wastes time and cannot earn extra marks.
Plan an investigation to determine the effect of different concentrations of a nutrient solution on the growth of Lemna. Use the same method of counting the number of leaves that the students used in their investigation for measuring growth.
Answer
- Prepare a range of at least three (e.g. five) different concentrations of nutrient solution.
- Put the same volume of each solution into identical beakers.
- Place the same number of plants / leaves (e.g. six plants with 16 leaves) in each beaker at the start.
- Keep all beakers at the same temperature.
- Give all beakers the same light intensity (same lamp, same distance).
- Count and record the number of leaves in each beaker at regular intervals (e.g. each day) for the same length of time.
- Repeat each concentration at least twice more and calculate the mean number of leaves.
- Compare growth between concentrations, e.g. by calculating the percentage increase in leaf number / growth rate, or by plotting a graph of mean leaf number against time for each concentration.
See working — a six-point plan covering concentration range, controlled variables, regular counting, repeats with means, and a comparison method
Walkthrough
The planning question asks you to design the investigation the students only sketched. The mark scheme lists eight creditable points for a maximum of six, so aim to cover every category:
- The independent variable — a range of nutrient concentrations, with a minimum of three values. Without a range you cannot see the effect of concentration.
- Volume controlled — the same volume of solution in every beaker, so concentration is the only difference.
- Starting material controlled — the same number of plants and leaves at the start, otherwise the counts are not comparable.
- Temperature controlled — temperature affects the rate of growth.
- Light intensity controlled — light affects photosynthesis and therefore growth; same lamp, same distance.
- The dependent variable measured regularly — count leaves at fixed intervals (e.g. daily) for the same duration in every beaker.
- Repeats and a mean — repeat each concentration at least twice more and calculate means; this improves reliability.
- A comparison method — state how the results answer the question: percentage increase in leaf number, growth rates, or a graph of mean leaf number against time for each concentration.
Write it as a numbered method someone could actually follow, naming each controlled variable explicitly.
Key Takeaways
- A full plan names the independent variable and its range, the dependent variable and how it is measured, the key controlled variables, repeats with means, and how the data will be compared.
- 'Minimum 3' concentrations is the floor; more values give a better picture of the relationship.
Common Mistakes
- Using only one or two concentrations — the scheme requires a minimum of three.
- Naming 'fair test' without saying WHICH variables are controlled — each named variable is a separate mark.
- Omitting repeats or the mean.
- Forgetting the final comparison step, so the plan never answers the question asked.
- Changing more than one thing at a time (e.g. different volumes AND different concentrations).
Things to Be Careful About
- The question specifies using the same counting method as the students, so your dependent variable must be the number of leaves counted at intervals — do not switch to measuring mass here.
- The scheme underlines the variable names (nutrient concentrations, volumes, number of plants/leaves, temperature, light intensity) — use those exact terms.
Fig. 3.1 is a photomicrograph of cells from a plant epidermis that have been treated so that some of the cells are plasmolysed.
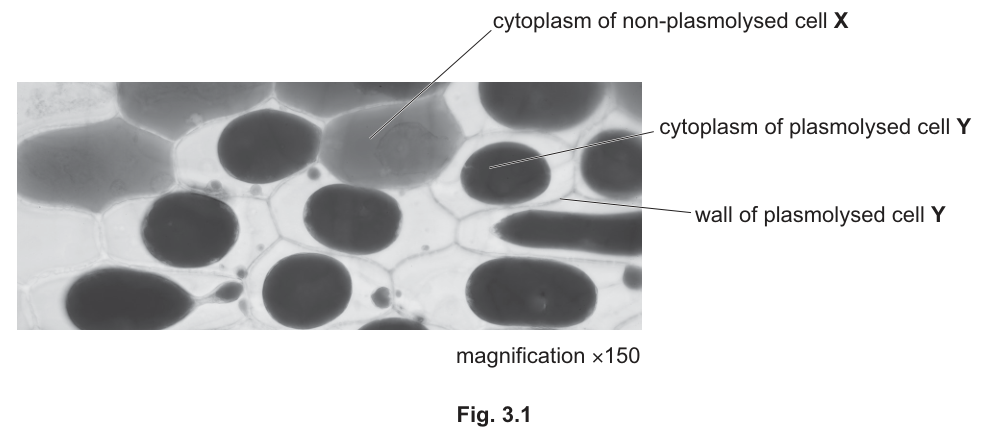
State three items of apparatus that you would need to use to observe the actual cells shown in the photomicrograph.
- ______
- ______
- ______
Answer
- microscope
- microscope slide
- coverslip
microscope, microscope slide, coverslip
Walkthrough
The photomicrograph is taken at ×150 magnification, which requires a light microscope. To prepare a wet mount of plant epidermis for observation under a light microscope, the candidate needs the microscope itself, a glass microscope slide to hold the specimen, and a coverslip to flatten it and protect the objective lens. A lamp or built-in light source is also needed to illuminate the specimen from below.
Key Takeaways
Standard apparatus for light microscopy and wet mount preparation includes the microscope, slide, coverslip, and a light source.
Common Mistakes
Naming 'tweezers' or 'scalpel' — these are used for preparing the specimen, not for observing it. Naming 'eyepiece' or 'objective lens' — these are parts of the microscope, not separate items of apparatus.
Things to Be Careful About
The question asks for apparatus to observe the cells, not to prepare them. Give exactly three items. 'Lamp' is acceptable, but 'light source' is safer if the microscope has a built-in one. Read the mark scheme's accepted alternatives carefully.
Answer
See diagram for full drawing requirements.
Large labelled drawing of cells X and Y showing plasmolysis
Walkthrough
Biological drawings on Paper 3 must follow strict conventions. Use a sharp pencil for continuous, clean lines with no shading, stippling, or cross-hatching anywhere. The drawing must be at least 100 mm across both cells X and Y combined. Cells X and Y must be drawn touching each other as they appear in the photomicrograph. A key detail for plasmolysis is that the cell wall of Y remains in its original position while the cytoplasm shrinks. The upper right edge of the unplasmolysed cell X and the lower left edge of the plasmolysed cell Y should be drawn approximately straight and parallel to each other. The cytoplasm in cell Y must be clearly drawn as shrunken away from the cell wall.
Key Takeaways
Drawing conventions for O Level Practical: sharp pencil, continuous lines, no shading, minimum size (100 mm), accurate proportions, and correct representation of the biological phenomenon (plasmolysis).
Common Mistakes
Adding shading or cross-hatching. Drawing cells not touching. Forgetting to draw the shrunken cytoplasm inside the cell wall of Y. Using a thick pen or ruler for ruled lines. Drawing the cell wall of Y collapsed or curved instead of straight and parallel to X.
Things to Be Careful About
The mark scheme specifically looks for the upper right edge of X and lower left edge of Y to be straight and parallel. This shows the cells are adjacent and the wall of Y hasn't collapsed. The cytoplasm must be drawn in the plasmolysed cell; just drawing the empty space is not enough. Minimum size is 100 mm across X and Y combined.
Describe how you would treat cells from a plant epidermis so that they become plasmolysed.
______
Answer
Place the cells in a concentrated solution of salt or sugar.
Place in a concentrated salt or sugar solution
Walkthrough
Plasmolysis occurs when water leaves a plant cell by osmosis. This happens when the cell is placed in a solution that has a lower water potential than the cell's cytoplasm. To achieve this, the cells must be placed in a concentrated solution. The solute can be a salt (like sodium chloride) or a sugar (like sucrose). The concentration must be high enough to cause a net loss of water from the cell.
Key Takeaways
Plasmolysis is caused by placing a plant cell in a hypertonic (concentrated) solution, leading to water loss by osmosis.
Common Mistakes
Saying 'put in water' — this would cause the cell to become turgid, not plasmolysed. Saying 'add salt' without specifying 'concentrated solution'. Saying 'dehydrate' — this is not the biological mechanism.
Things to Be Careful About
The mark scheme requires two points: 'concentrated solution' and 'salt / sugar'. Saying 'strong solution' is acceptable for concentrated, but 'concentrated' is the preferred term. Ensure you specify the type of solute to earn the second mark.