Biology 5090/31 — October/November 2025
Cambridge O-Level · Practical Test · worked solutions for every part, with the mark scheme
Topics Observations and Measurements · Experimental Contexts · Analysis, Conclusions and Evaluation · Use of Techniques, Apparatus and Materials · Planning Experiments and Investigations · Microscopy and Biological Drawing
Apple juice is made by cutting up and crushing apples. When apple tissue is cut up and crushed, it can become a darker colour and go brown.
You are going to investigate the effect of vitamin C on the colour change when apple is cut up and crushed.
You are provided with some apple tissue, of vitamin C solution, of distilled water, a glass rod and three large test-tubes.
Read through the following procedure carefully and decide how to label your test-tubes.
Do not carry out the procedure yet.
- Label a large test-tube and use a clean syringe to add of vitamin C solution.
- Label a second large test-tube and use a clean syringe to add of distilled water.
- Label a third large test-tube and do not add any liquid.
- Cut three cubes of apple each . Ensure that each surface of the cubes is freshly cut. Do not include any skin or core.
- Cut each cube into many small pieces. Take care to keep the pieces from each cube separate.
- Add the pieces of one cube to the test-tube containing vitamin C solution.
- Add the pieces of the second cube to the test-tube containing distilled water.
- Add the pieces of the third cube to the test-tube with no added liquid.
- Use a glass rod to gently crush the pieces of apple in the bottom of each test-tube.
- Clean the glass rod in the rinsing water between using it in each test-tube.
When you have finished crushing the apple, observe the colour of the crushed apple in each test-tube.
Answer
At 0 minutes the crushed apple in all three test-tubes is the same colour (pale yellow/cream). Or: vitamin C and distilled water are the same colour, and the no-added-liquid tube is slightly darker.
Three colours the same (or vitamin C and distilled water same; no added liquid slightly darker)
Walkthrough
At 0 minutes, immediately after crushing, the enzyme has barely had time to react, so all three test-tubes should look the same colour. The mark scheme accepts either 'all three colours the same' or 'vitamin C and distilled water same, and the no-added-liquid tube slightly darker'. The no-liquid tube may be slightly darker because the apple pieces are not diluted by any liquid.
Key Takeaways
- Record the initial observation before any colour change has had time to develop.
- Compare all three tubes at the same time.
- The observation must be qualitative (colour), not a measurement.
Common Mistakes
- Leaving the 0-minute cells blank.
- Recording different colours when the tubes are actually the same.
- Inventing a colour that was not seen.
Things to Be Careful About
- Use the same colour description for all three tubes if they look the same.
- If the no-liquid tube is slightly darker, record that difference.
- The mark scheme does not require a specific colour name, only that the three observations are consistent.
Answer
Start time: record the actual time you started timing (for example, 10:05).
Start time recorded (candidate's own reading)
Walkthrough
Immediately after crushing the apple, you need to start timing so that the 5, 10 and 15 minute observations are taken at the correct intervals. The mark scheme only requires that a start time is recorded; it does not specify a particular value.
Key Takeaways
- Timing allows you to compare how the colour changes over a fixed period.
- The start time must be written down before the first timed observation.
Common Mistakes
- Forgetting to record the start time.
- Recording the stop time instead of the start time.
- Recording a time without units (e.g. writing '10:05' but not saying am/pm if needed).
Things to Be Careful About
- Write the actual time you started, not a time you think you should have started.
- Use the same clock or stopwatch throughout the experiment.
Observe the colour of the crushed apple in each test-tube at 5, 10 and 15 minutes and record your observations in Table 1.1.
Table 1.1
| time /minutes | colour of crushed apple in each test-tube | ||
|---|---|---|---|
| vitamin C | distilled water | no added liquid | |
| 0 | |||
| 5 | |||
| 10 | |||
| 15 |
Answer
| time / minutes | vitamin C | distilled water | no added liquid |
|---|---|---|---|
| 0 | pale yellow | pale yellow | pale yellow |
| 5 | pale yellow | pale yellow | pale yellow |
| 10 | pale yellow | pale yellow | pale yellow |
| 15 | pale yellow | pale yellow | brown/dark yellow |
Table completed with colours at 5, 10 and 15 min; vitamin C same colour throughout; no added liquid brown/dark yellow by 15 min; distilled water same as vitamin C or intermediate.
Walkthrough
At each time (5, 10 and 15 minutes) look at each test-tube and record the colour of the crushed apple. The expected pattern is that the vitamin C tube stays the same colour throughout, the no-added-liquid tube becomes brown or dark yellow by 15 minutes, and the distilled water tube either stays the same as vitamin C or is intermediate between vitamin C and no added liquid. This is because the enzyme in the apple reacts with oxygen in the air; vitamin C prevents this reaction, while water reduces the amount of oxygen available.
Key Takeaways
- A results table should have every cell filled with the observation.
- The same colour description should be used for the same appearance.
- The pattern of results supports the later conclusions about vitamin C and distilled water.
Common Mistakes
- Leaving some cells blank.
- Recording 'brown' for the vitamin C tube.
- Recording different colours for the same tube at different times when the colour has not changed.
- Writing a measurement (e.g. '5') instead of a colour.
Things to Be Careful About
- The mark scheme requires a colour in all the 5, 10 and 15 minute cells.
- Use consistent colour words so that 'same' is clear.
- The no-added-liquid tube should be brown/dark yellow at 15 minutes; the distilled water tube should not be as brown as that.
Using your observations in Table 1.1, state what can be concluded about the effect of vitamin C on the colour change when apple is cut up and crushed.
______
Answer
Vitamin C prevents the colour change / stops the apple from turning brown.
Vitamin C prevents the colour change / stops the apple from turning brown.
Walkthrough
Compare the vitamin C tube with the no-added-liquid tube. The no-added-liquid tube turns brown, while the vitamin C tube stays the same colour. Therefore vitamin C prevents the colour change. The mark scheme accepts 'prevents colour change' or 'stops turning brown'.
Key Takeaways
- A conclusion must be based on the observations in the table.
- 'Prevents' is stronger than 'slows down' and is what the data show.
Common Mistakes
- Saying 'vitamin C slows the colour change' when the data show it stops it.
- Mentioning acid or pH in this part; that is not needed for the conclusion.
- Giving an explanation instead of a conclusion.
Things to Be Careful About
- Use the word 'prevents' or 'stops'.
- Do not add extra detail that the observations do not support.
Using your observations in Table 1.1, state what can be concluded about the effect of distilled water on the colour change when apple is cut up and crushed.
______
Answer
Distilled water reduces the colour change compared with no added liquid, but it is not as effective as vitamin C in preventing the colour change.
Distilled water reduces colour change compared with no added liquid, but not as effective as vitamin C.
Walkthrough
Compare the distilled water tube with the no-added-liquid tube: the distilled water tube is less brown, so distilled water reduces the colour change. Then compare it with the vitamin C tube: the vitamin C tube stays the same colour, while the distilled water tube may be slightly darker, so distilled water is not as effective as vitamin C. Both points are needed for the two marks.
Key Takeaways
- A two-mark conclusion often contains two linked comparisons.
- Distilled water has an effect, but a weaker one than vitamin C.
Common Mistakes
- Saying distilled water has no effect.
- Saying distilled water prevents the colour change.
- Only giving one of the two required points.
Things to Be Careful About
- Use 'reduces' rather than 'prevents' for distilled water.
- Include the comparison with vitamin C: 'not as effective as vitamin C'.
You may have found difficulty in carrying out some of the instructions consistently which may have resulted in sources of error.
State one possible source of error and suggest how it could be overcome.
______
Answer
Source of error: it is difficult to assess/describe the colours.
Improvement: use a colour chart to compare the colours.
Difficulty assessing/describing colours; use a colour chart.
Walkthrough
Think of a step in the procedure that could vary between tubes or between times. One common source of error is that judging colours is subjective, so different people might describe the same colour differently. This can be overcome by using a colour chart. Another acceptable pair is that the cubes are not cut or crushed to the same degree; this can be overcome by cutting each cube into the same stated number of pieces or crushing for the same time. The source of error must match the improvement.
Key Takeaways
- A source of error is a specific part of the procedure that could affect the results.
- The improvement must directly address that source of error.
- Vague answers such as 'human error' are not enough.
Common Mistakes
- Giving an improvement that does not match the source of error.
- Saying 'to avoid mistakes' without identifying a specific error.
- Choosing a source of error that is not actually part of this procedure.
Things to Be Careful About
- The mark scheme requires the source of error and the improvement to be linked.
- Use specific language: 'use a colour chart', 'cut into the same number of pieces', 'crush for the same time'.
Use the universal indicator paper that has been provided to test and record the pH of the distilled water and the pH of the vitamin C solution.
distilled water pH ______
vitamin C solution pH ______
Answer
distilled water pH 6
vitamin C solution pH 4
distilled water pH 6; vitamin C solution pH 4 (candidate's readings)
Walkthrough
Use the universal indicator paper to test each liquid. Dip the paper into the liquid or place a drop on it, then compare the colour with the chart on the container. The expected readings are distilled water pH 6 and vitamin C solution pH 4, but you should record the values you actually obtain. The mark scheme says to refer to the supervisor's results if your readings are different.
Key Takeaways
- pH is a measure of acidity: lower pH means more acidic.
- Universal indicator paper gives a pH value by matching colour to a chart.
- The two liquids should give two different pH values.
Common Mistakes
- Recording the same pH for both liquids.
- Writing 'acidic' instead of a number.
- Confusing the order: vitamin C is the more acidic solution, so it has the lower pH.
Things to Be Careful About
- Record whole-number pH values as shown on the chart.
- The mark scheme expects two different numbers.
- If your readings differ from the expected values, use the supervisor's results.
When apple tissue is cut up and crushed, an enzyme comes into contact with oxygen in the air. In the presence of oxygen, the enzyme catalyses the reaction of a colourless molecule in the cells of the apple tissue to cause the change in colour.
Suggest how this might explain the effect of:
distilled water ______
vitamin C. ______
Answer
Distilled water reduces the amount of oxygen available to the apple, so the enzyme-catalysed colour change is slowed.
Vitamin C is an acid (low pH); it inhibits/denatures the enzyme, so the enzyme stops working and the colour change is prevented.
Distilled water reduces oxygen available; vitamin C is acidic and denatures/inhibits the enzyme.
Walkthrough
The browning reaction needs oxygen and an enzyme. Adding distilled water covers the apple pieces, so less oxygen from the air reaches the enzyme; this slows the reaction. Vitamin C is acidic (low pH). Most enzymes work best at a particular pH, and a very low pH can denature the enzyme, changing its shape so it can no longer catalyse the reaction. That is why the vitamin C tube stays the same colour.
Key Takeaways
- Enzyme-catalysed reactions can be affected by the availability of a reactant (oxygen).
- pH affects enzyme activity; extreme pH can denature the enzyme.
- Denaturation changes the shape of the enzyme's active site so the substrate cannot bind.
Common Mistakes
- Saying distilled water 'stops' the reaction instead of 'reduces' it.
- Saying vitamin C 'neutralises' the oxygen.
- Saying vitamin C 'kills' the enzyme without mentioning denaturation or inhibition.
- Giving only one of the two explanations when two marks are available.
Things to Be Careful About
- For distilled water, the key idea is less oxygen available.
- For vitamin C, the key ideas are acid/low pH and inhibit/denature the enzyme.
- The mark scheme accepts 'inhibits' or 'denatures' for vitamin C.
Yeast is used to produce bread. Flour is mixed with water and yeast to produce dough. The yeast breaks down starch in the flour to produce sugar. The yeast uses the sugar for respiration, giving off bubbles of carbon dioxide. The bubbles of carbon dioxide are trapped in the dough, making it increase in volume before it is baked.
Some students tested the effect of yeast in four doughs, each made from a different type of flour – wheat, rye, buckwheat and maize. The effect of the yeast in the dough was evaluated by measuring how much the dough increased in volume.
The same mass of each type of flour was mixed with the same volume of water and the same mass of yeast to form a dough. Four measuring cylinders were labelled and dough was added to each. The volume of the dough in each of the cylinders was measured and recorded at 15-minute intervals. Some of the results are shown in Table 2.1.
Fig. 2.1 shows the measuring cylinder with dough made from wheat flour after 30 minutes.
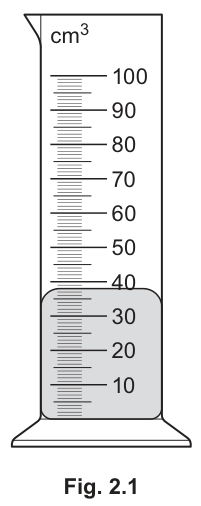
Record the volume of the dough in Table 2.1.
Answer
38
38 cm³
Walkthrough
The dough surface in Fig. 2.1 sits exactly on the graduation line between 30 and 40, at the 38 mark. Read the bottom of the dough level against the scale and record it as 38 cm³ — no unit is written into the table cell because the column heading already carries the unit.
Key Takeaways
Reading volumes from graduated apparatus; recording only the number when the table heading gives the unit.
Common Mistakes
Writing units inside the table cell (the scheme rejects this); misreading to 37 or 40 by not aligning with the correct graduation line; confusing the minor graduations with the major ones.
Things to Be Careful About
The column heading 'volume of dough / cm³' already contains the unit, so the cell must contain the bare number 38.
Complete Table 2.1 by calculating the total increase in volume of each dough after 45 minutes.
Table 2.1
| time/minutes | volume of dough in measuring cylinder/ | |||
|---|---|---|---|---|
| wheat flour | rye flour | buckwheat flour | maize flour | |
| 0 | 20 | 21 | 21 | 20 |
| 15 | 24 | 23 | 21 | 21 |
| 30 | 27 | 22 | 22 | |
| 45 | 45 | 32 | 23 | 22 |
| total increase in volume after 45 minutes | 25 |
Answer
| time/minutes | wheat flour | rye flour | buckwheat flour | maize flour |
|---|---|---|---|---|
| total increase in volume after 45 minutes | 25 | 11 | 2 | 2 |
(rye: ; buckwheat: ; maize: )
rye 11, buckwheat 2, maize 2
Walkthrough
The total increase after 45 minutes is the final volume minus the starting volume for each flour. The wheat row shows the pattern: . Apply the same subtraction: rye ; buckwheat ; maize . Enter all three numbers so every cell of that row is filled — the first mark is for completing all three cells, the second for all three being correct.
Key Takeaways
Increase = final value − initial value; complete every required cell of a table.
Common Mistakes
The mark scheme states 'R if units in table' — writing cm³ in the cells loses the marks. Subtracting from zero instead of the time-zero volume; leaving a cell blank.
Things to Be Careful About
No units anywhere in the cells; use each flour's own starting volume, which differs slightly between flours.
On the grid draw a bar chart to show the total increase in volume of the four doughs after 45 minutes.
Answer
Bar chart of total increase in volume after 45 minutes for the four flours, with labelled axes and labelled bars
Walkthrough
This is a bar chart because the independent variable (type of flour) is discontinuous — four named categories, not a continuous scale. Four things are marked:
- Axes fully labelled: y-axis 'total increase in volume / cm³', x-axis naming the four flours, and each bar labelled centrally underneath (wheat, rye, buckwheat, maize).
- A linear scale on the y-axis running from 0 to at least 25, chosen so the tallest bar uses at least half the grid height; the x-axis categories should also spread across at least half the grid width.
- Bar heights plotted correctly: wheat 25, rye 11, buckwheat 2, maize 2.
- Bars drawn with ruled lines, all of equal width, equally spaced, and NOT touching each other — touching bars are the convention for histograms, not bar charts.
Key Takeaways
Bar chart conventions for categorical data: labelled axes with units, linear scale filling half the grid, equal-width separated bars, central labels.
Common Mistakes
Letting bars touch (histogram convention); forgetting the unit on the y-axis label; choosing a scale so small the bars occupy less than half the grid; labelling bars off-centre or omitting labels; freehand rather than ruled bars.
Things to Be Careful About
Each of the four mark points is scored separately, so all four conventions must be present — a beautifully plotted but unlabelled chart still loses two marks.
The students wanted to know why the effect of yeast in the four doughs varied.
Table 2.2 shows some of the biological molecules in the four flours.
Table 2.2
| biological molecule | mass/ per flour | |||
|---|---|---|---|---|
| wheat flour | rye flour | buckwheat flour | maize flour | |
| starch | 54.5 | 54.1 | 59.0 | 74.0 |
| gluten (a protein) | 8.9 | 3.1 | 0.0 | 0.0 |
| fibre | 10.6 | 13.7 | 10.4 | 4.3 |
Using Table 2.2, your bar chart and the information about the process of bread production, suggest and explain how these biological molecules affect the total increase in volume of bread dough.
______
Answer
- Gluten (a protein) has an effect: its amounts match the pattern of total volume increase — wheat has the most gluten () and the largest increase, rye less gluten and a smaller increase, and buckwheat and maize have none and the smallest increases.
- The dough with the largest volume increase trapped more bubbles of carbon dioxide (gluten forms a stretchy network that holds the gas in).
- Starch and fibre have little or no effect: they do not match the volume differences (maize has the most starch yet one of the smallest increases).
Gluten amount matches the volume-increase pattern; more gluten traps more carbon dioxide bubbles; starch and fibre do not match the differences.
Walkthrough
'Suggest' means reason from the data, not recall. Compare the three molecules in Table 2.2 against the bar chart:
- Starch: maize has by far the most starch (74.0 g per 100 g) but one of the smallest volume increases (2 cm³), while wheat with less starch has the biggest increase. So starch does not explain the pattern.
- Fibre: rye has the most fibre but only a middling increase — again no match.
- Gluten: wheat 8.9 g → 25 cm³; rye 3.1 g → 11 cm³; buckwheat 0 → 2 cm³; maize 0 → 2 cm³. This ordering matches the bar chart perfectly, so gluten is the molecule responsible. Biologically, gluten forms an elastic protein network in dough that traps the carbon dioxide bubbles made by respiring yeast, so more gluten means more gas held and a greater rise.
Key Takeaways
To identify which factor causes a pattern, check whether its values rise and fall in step with the results; a factor whose values contradict the pattern can be eliminated.
Common Mistakes
Saying 'starch is broken down to sugar so it causes the rise' without noticing maize contradicts this; describing the gluten effect without linking it to trapping carbon dioxide bubbles; giving observations ('wheat rose most') without the explanation the question demands.
Things to Be Careful About
All three marking points are needed: gluten matches the pattern (+), the mechanism is trapping CO₂ bubbles (+), and starch/fibre are excluded because they do not match (+). Each point needs both halves joined by '+' in the scheme.
Answer
Add iodine solution to a sample of each flour. A blue-black colour with each flour shows that starch is present.
Add iodine solution; it turns blue-black with each flour, showing starch is present.
Walkthrough
The standard test for starch uses iodine solution (iodine in potassium iodide), which is orange-brown. When it contacts starch it becomes trapped in the starch molecules and turns blue-black. So the method is: add a few drops of iodine solution to each flour sample (or to a suspension of each flour in water) and observe the colour. A blue-black result confirms starch in all four flours.
Key Takeaways
Iodine solution tests for starch; positive result is blue-black.
Common Mistakes
Using Benedict's solution (tests reducing sugars) instead of iodine; saying just 'it changes colour' without naming blue-black; omitting the reagent name.
Things to Be Careful About
Both marks are needed: the reagent (iodine solution) and the colour change (blue-black/black). Say the colour appears 'with each flour' since the question asks about all four.
The students made more dough from wheat flour, yeast and water.
Using this dough, plan an investigation based on the method in 2(a) to determine the effect of temperature on the increase in volume of dough at temperatures between and .
Predict your expected results.
investigation plan ______
expected results ______
Answer
Investigation plan
- Make the dough and divide it equally between several measuring cylinders.
- Use at least three different temperatures between and , e.g. , and .
- Place each cylinder in a water-bath at its temperature.
- Keep everything else the same: same mass of flour, yeast and water, same initial volume of dough.
- Measure the volume of dough at stated time intervals (e.g. every 15 minutes up to 45 minutes).
- Calculate the increase in volume at 45 minutes for each temperature.
- Repeat each temperature at least three times and calculate the mean increase in volume.
- Plot a graph of mean total volume increase (y-axis) against temperature (x-axis).
Expected results
The volume increase will increase as temperature increases up to an optimum (around ), then increase much less / decrease at higher temperatures as enzymes denature above the optimum.
See working — plan with at least three temperatures in water-baths, controlled variables, repeats and mean, graph of volume increase against temperature; prediction: volume increase rises with temperature to an optimum then falls/levels off.
Walkthrough
The planning question rewards hitting every category the scheme lists, and it lists eight points for five marks plus one for the prediction, so cover them all:
- Dependent variable: increase in volume of dough, measured as in 2(a) — divide the dough equally between cylinders, read volumes at fixed intervals, calculate the increase at 45 minutes.
- Independent variable: temperature, with at least three stated values strictly within 20–80 °C (e.g. 20, 50, 80 °C). Values outside the range score nothing.
- How to control temperature: water-baths set at each temperature.
- Controlled variables: same masses of flour, yeast and water, same starting volume — anything that would itself change gas production must be held constant.
- Reliability: repeat each temperature at least three times and calculate a mean.
- Presentation: plot total volume increase (y-axis) against temperature (x-axis).
- Prediction: yeast respiration is catalysed by enzymes, so rate rises with temperature up to an optimum near 40 °C, then falls sharply as enzymes denature above it — so volume increase rises then drops (or stops rising) at high temperatures.
Key Takeaways
A scoring plan names what is measured, how, at least three values of the independent variable within the stated limits, the variables kept constant, repeats with a mean, and how results will be displayed. Predictions about enzyme reactions follow the temperature–activity curve.
Common Mistakes
Giving temperatures outside 20–80 °C; using only two temperatures; forgetting the water-baths; predicting a rise with no mention of the fall beyond the optimum; plotting temperature on the y-axis; omitting repeats and a mean.
Things to Be Careful About
The scheme caps the plan at 5 marks and gives 1 for the prediction — write both sections clearly under their headings. State the temperatures explicitly; 'different temperatures' alone does not score point 2.
A student investigated a plant that had some stems with flowers and some stems with no flowers. The student picked one leaf from a stem with flowers and one leaf from a stem with no flowers. Fig. 3.1 shows the two leaves.
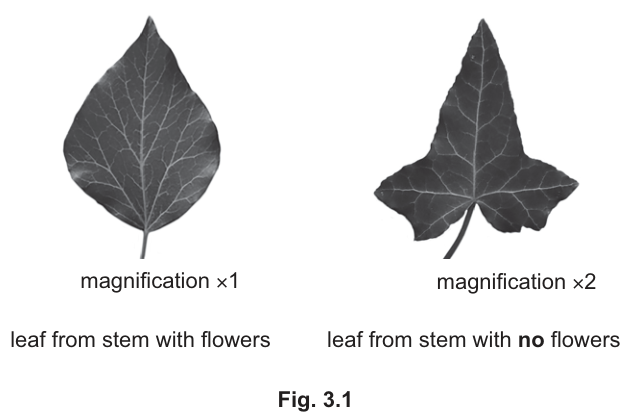
Complete Table 3.1 to compare the size and shape of the leaves.
Table 3.1
| feature of leaf | leaf from stem with flowers | leaf from stem with no flowers |
|---|---|---|
| size | ||
| shape |
Answer
| feature of leaf | leaf from stem with flowers | leaf from stem with no flowers |
|---|---|---|
| size | large / larger | small / smaller |
| shape | longer than wide / pointed oval shape / just 1 point at tip | widest at base / three pointed sections |
See working
Walkthrough
The question asks for a comparison of the size and shape of two leaves. The critical detail here is the magnification label beneath each photograph. The leaf from the stem with flowers is shown at (actual size), while the leaf from the stem with no flowers is shown at (twice actual size).
Size: Although the right leaf appears roughly the same height as the left leaf in the photograph, it is magnified twice as much. Therefore, its actual size is about half the height of the left leaf. The leaf from the stem with flowers is larger in actual size, and the leaf from the stem with no flowers is smaller.
Shape:
- The left leaf (flowers) is an unlobed, pointed oval or lanceolate shape. It is longer than wide, with just one point at the tip.
- The right leaf (no flowers) is palmately lobed (ivy-like). It is widest at the base, with three (or more) pointed sections (lobes) radiating outwards.
Key Takeaways
- Always check for magnification labels on photographs before comparing sizes. An object magnified that looks the same size as an object at is actually half the size in reality.
- Use precise biological terminology for shapes (e.g., 'unlobed', 'palmately lobed', 'lanceolate', 'longer than wide').
Common Mistakes
- Ignoring magnification: Stating that the right leaf is larger because it looks bigger in the photograph. This is a classic trap.
- Vague shape descriptions: Saying 'one is round, one is spiky'. The mark scheme requires specific descriptors like 'longer than wide' or 'widest at base'.
- Confusing the columns: Putting the description of the left leaf in the right column.
Things to Be Careful About
- The mark scheme accepts 'large/larger' and 'small/smaller' for size. Do not just write 'big' and 'small'; comparative terms are expected when comparing two items.
- Give exactly the number of points required. The table has two rows (size and shape), so provide one clear point for each column in each row.
Suggest what the student needs to do to be certain that the two leaves they picked are representative of the leaves on the two types of stem.
______
Answer
- collect more leaves (from both types of stem);
- check leaves from each stem are similar / the same as the two leaves selected.
See working
Walkthrough
The student has only picked one leaf from a stem with flowers and one leaf from a stem with no flowers. In biology, a sample size of is never sufficient to draw reliable conclusions or make generalisations about a population, because individual variation is common.
To be certain the leaves are representative (i.e., they accurately reflect the typical leaves on those types of stems), the student must:
- Collect more leaves from multiple stems of both types.
- Compare the newly collected leaves to the original two to ensure they share the same characteristics (similar shape, size, etc.). If the new leaves look different, the original selection was not representative.
Key Takeaways
- Representativeness requires a sufficiently large sample size and a lack of bias in selection.
- In any investigation comparing two groups, you must sample from both groups to make a valid comparison.
Common Mistakes
- Suggesting 'repeat the experiment': This is vague and doesn't address the specific problem of a single, potentially unrepresentative leaf.
- Suggesting 'use a microscope': Magnification or detailed observation does not make a single leaf representative of the whole plant.
- Forgetting to sample from both types: Just picking more leaves from the 'no flowers' stem doesn't help compare the two types.
Things to Be Careful About
- The mark scheme specifically looks for 'collect more leaves' and 'check they are similar'. Use these exact ideas.
- Do not write 'to avoid errors' or 'to be accurate' as the primary reason; the core requirement is increasing sample size to ensure representativeness.
In the space below, make a large drawing of the leaf from the stem with no flowers as it appears in Fig. 3.1.
Answer
The drawing must meet the following criteria to earn full marks:
- Conventions: Drawn with a sharp pencil using continuous lines, with no shading, no ruled lines, and no overlapping text.
- Size and Proportion: A correct leaf shape drawn with a minimum height of 80 mm.
- Specific Detail: Must include a notch in the right lobe at the base.
- Vein/Branch Detail: Must show at least 3 side branches (one to each lobe) radiating from the top of the petiole.
- Petiole: The petiole (leaf stalk) must be drawn as a double line.
Large labelled drawing of the palmately lobed leaf from the stem with no flowers
Walkthrough
This is a biological drawing question on Paper 3 (Practical Test). The candidate is asked to draw the leaf from the stem with no flowers (the right-hand leaf in Fig 3.1). This leaf is palmately lobed, resembling an ivy leaf, with three to five pointed lobes.
1. Drawing Conventions (1 mark):
5090 is extremely strict about drawing style. The candidate must use a sharp pencil (not a pen or soft pencil). Lines must be continuous (no jagged or broken lines). There must be no shading, stippling, or cross-hatching. There must be no ruled lines (rulers are not allowed for drawing the specimen itself, only for label lines). Text from the question or other labels must not overlap the drawing.
2. Size and Proportion (1 mark):
The drawing must be large. The mark scheme specifies a minimum height of 80 mm. The proportions must accurately reflect the photograph: the leaf is wider at the base and tapers to pointed lobes. The candidate must not just trace the photo; they must redraw it to scale on the exam paper.
3. Specific Structural Detail (1 mark):
This is where candidates often lose marks. The mark scheme explicitly requires:
- A notch in the right lobe at the base (look closely at the base of the right-hand leaf in Fig 3.1; there is a distinct indentation where the right lobe meets the central lobe).
- At least 3 side branches (veins or minor stems) radiating from the top of the petiole (the point where the leaf stalk meets the leaf blade), with one going to each lobe.
- The petiole (the leaf stalk at the bottom) must be drawn as a double line (two parallel lines), not a single thick line.
Key Takeaways
- Biological drawings are not art; they are scientific records. Conventions (sharp pencil, continuous lines, no shading) are non-negotiable and earn marks.
- Minimum size is mandatory. An 80 mm minimum height is a hard requirement; a smaller drawing loses the size/proportion mark.
- Read the mark scheme for specific details. Examiners look for very specific features (like the notch or the double-line petiole) that candidates might overlook if they just draw a generic 'ivy leaf'.
Common Mistakes
- Using shading or cross-hatching: This is the most common error. Biological drawings must be clean line art.
- Drawing the petiole as a single line: The mark scheme explicitly requires a double line for the petiole.
- Missing the notch: The indentation at the base of the right lobe is a key identifying feature of this specific leaf variation and must be included.
- Overlapping text: Label lines or text from the question covering the drawing invalidates the conventions mark.
- Drawing the wrong leaf: The question asks for the leaf from the stem with no flowers (the lobed one), not the unlobed one.
Things to Be Careful About
- Label lines: If you add labels, use straight, un ruled lines that do not cross each other or the specimen. However, this question does not explicitly ask for labels in the text, though the mark scheme description implies a complete drawing. Stick to the explicit criteria in the mark scheme.
- Precision: The notch and side branches are small details. Use a sharp pencil and take your time to include them.
- Paper orientation: Ensure the leaf is oriented correctly (petiole at the bottom, lobes pointing up/outwards) as shown in the photograph.