Biology 5090/42 — May/June 2025
Cambridge O-Level · Alternative to Practical · worked solutions for every part, with the mark scheme
Topics Experimental Contexts · Observations and Measurements · Analysis, Conclusions and Evaluation · Planning Experiments and Investigations · Use of Techniques, Apparatus and Materials · Microscopy and Biological Drawing
Catalase is an enzyme found in living cells. This enzyme catalyses the breakdown of hydrogen peroxide into oxygen and water. Some plant cells are a source of catalase.
If some material from a plant is crushed and added to water, a suspension of the contents of the plant's cells can be obtained.
When hydrogen peroxide solution is added to this suspension, the oxygen produced is released as bubbles of gas. These bubbles collect to form a foam on top of the suspension.
The height of any foam produced can be measured. Greater height indicates greater catalase activity.
A student investigated the activity of catalase in the cells of three different species of plant by measuring the height of foam produced in each. They used three suspensions of cells, one each of celery, apple and potato, provided in separate beakers.
The student followed these instructions:
- use a clean stirring rod to stir the celery cell suspension in the beaker
- use a syringe to add of celery cell suspension to a clean test-tube
- use a clean syringe to add of hydrogen peroxide solution to this test-tube
- immediately start timing
- after 60 seconds, measure the height of any foam produced and record your measurement.
Repeat these instructions using the apple cell suspension and then the potato cell suspension.
Fig. 1.1 shows the total contents of each of the three test-tubes after 60 seconds.
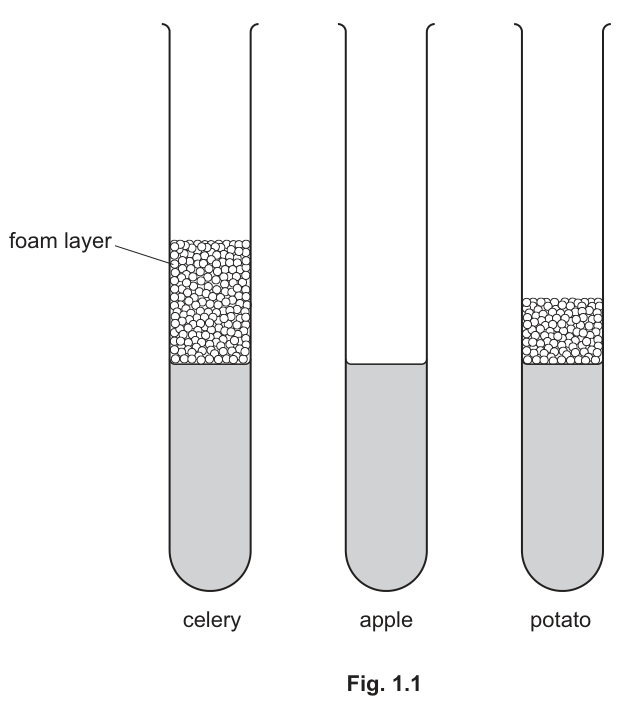
Measure the height of any foam produced in each test-tube and record these values in a table.
Answer
| plant | height of foam / mm |
|---|---|
| celery | 20 |
| apple | no foam / – |
| potato | 10 |
(The table is drawn with ruled lines; any measured values within the accepted ranges — celery 1–23 mm, potato 1–13 mm — score.)
Ruled table: celery ≈ 20 mm, apple = no foam, potato ≈ 10 mm (any value within the accepted range scores)
Walkthrough
The question asks you to measure the foam height in each test-tube in Fig. 1.1 and record the values in a table. Most of the 7 marks are for HOW you present the table, not the numbers themselves:
- The table must be drawn with ruled lines — a hand-sketched or unruled table loses the first mark.
- The header must name what was measured AND give its unit, e.g. "height of foam / mm". Writing just "height" without a unit loses a mark.
- All three plant types must appear as rows (or columns).
- Then measure each foam height against the scale on Fig. 1.1. The mark scheme accepts a range (celery 1–23 mm, potato 1–13 mm) because printed diagrams vary slightly; measure carefully to the nearest mm.
- For apple there is no foam at all — record this as "no foam", "none" or a dash. Do not write 0 if your table header says height/mm... actually 0 is ambiguous here because it could mean a foam of zero height; "no foam" is the safest wording.
Key Takeaways
- A results table needs: ruled lines, a header naming the variable, the unit in the header (slash form, e.g. height / mm), and every sample listed.
- When nothing is observed, write "no foam" or a dash rather than an invented number.
- Readings from printed figures have accepted ranges — measure carefully but do not panic about being exact.
Common Mistakes
- Omitting the unit from the header — this is a named marking point.
- Giving three separate mini-tables instead of one single table.
- Writing "0" for apple instead of "no foam".
- Measuring the foam plus the liquid instead of just the foam layer.
Things to Be Careful About
- The unit goes in the HEADER, not repeated in every cell.
- Use a ruler to measure the foam heights on the figure; the scheme's ranges are generous but a wild guess will fall outside them.
Use your results to place the three species of plant cells in order of catalase activity.
most active ______
______
least active ______
Answer
most active celery
potato
least active apple
celery, then potato, then apple
Walkthrough
Greater foam height means more oxygen was released in 60 seconds, which means more catalase activity. From part (a)(i): celery produced the tallest foam, potato a moderate foam, and apple none. So the order from most active to least active is celery → potato → apple.
Key Takeaways
- The link is: foam height ∝ oxygen produced ∝ catalase activity (in the fixed 60-second time window).
Common Mistakes
- Reversing the order by ranking "least active" first.
- Putting apple first because it is listed first in the question.
Things to Be Careful About
- The answer lines are pre-labelled most active / least active — fill them in that direction only.
Suggest why the three plant tissues were crushed before adding the hydrogen peroxide solution.
______
Answer
Crushing breaks open the plant cells, releasing the catalase so it can mix with (and act on) the hydrogen peroxide.
To break open the cells and release the catalase/enzyme
Walkthrough
Catalase is inside living cells. If whole pieces of tissue were used, the hydrogen peroxide could only reach enzyme at cut surfaces. Crushing ruptures the cell membranes, releasing the enzyme into the suspension where it can mix freely with the substrate. The mark scheme wants exactly this idea: "break open cells / release catalase / enzyme".
Key Takeaways
- Enzymes act only where substrate and enzyme can meet; preparation steps like crushing exist to maximise that contact.
Common Mistakes
- Saying crushing "increases surface area" without linking it to releasing the enzyme from broken cells — the credited point is cell breakage/release of enzyme.
- Saying it kills the cells or denatures the enzyme.
Things to Be Careful About
- Name the enzyme (catalase) or say "enzyme" — a vague answer about "contents mixing" may miss the point.
Suggest why the plant suspensions were stirred before adding the hydrogen peroxide solution.
______
Answer
- Stirring ensures the cells / cell contents / catalase are evenly distributed throughout the suspension.
- It gives the maximum (and the same) surface area for enzyme activity for each species, so the comparison is fair.
Even distribution of cells/catalase; maximum and equal surface area for enzyme activity in each species
Walkthrough
This is worth 2 marks, so two separate ideas are needed:
- After standing, dense cell material settles to the bottom of the beaker. Stirring redistributes it so every 2 cm³ sample withdrawn contains the same amount of catalase — even distribution.
- Stirring also breaks up clumps, exposing the greatest possible surface area of cell contents to the hydrogen peroxide. Crucially, doing this identically for all three species makes the comparison fair — the same surface area for enzyme activity in each.
Key Takeaways
- Preparation steps usually serve two purposes: making the measurement valid within one sample, and making comparisons between samples fair.
Common Mistakes
- Only giving the distribution point and missing the fairness/surface-area point.
- Saying stirring "speeds up the reaction" — the credited idea is distribution and surface area, not kinetic energy.
Things to Be Careful About
- The second mark specifically compares ACROSS the three species ("the same for each species") — include that comparative wording.
Answer
Volume of plant suspension used () — also acceptable: volume of hydrogen peroxide (), the time (60 seconds), or the diameter of the test-tubes.
e.g. volume of hydrogen peroxide solution (or volume of suspension, time, test-tube diameter)
Walkthrough
A controlled variable is one kept the same for all three plants so that only the plant species differs. Reading the method: 2 cm³ of suspension each time, 2 cm³ of hydrogen peroxide each time, timing stopped at 60 seconds each time, and clean identical test-tubes. Any ONE of these earns the mark.
Key Takeaways
- Controlled variables are often hiding in plain sight in the numbered instructions of the method.
Common Mistakes
- Naming the plant species — that is the independent variable, not controlled.
- Naming foam height — that is the dependent variable.
Things to Be Careful About
- Give only one variable; extra incorrect variables cannot lose the mark here but keep the answer clean.
Suggest two reasons why repeating the investigation would give the student more confidence in the results.
- ______
- ______
Answer
- Repeating would identify any anomalous results (outliers) that could then be discounted.
- It would make the results more reliable.
Identify anomalies/outliers; make results more reliable
Walkthrough
A single measurement might be unusually high or low — perhaps the timing was late, or the suspension was not mixed well. Repeating lets the student spot a result far from the others (an anomaly) and discount or re-check it, and averaging several consistent results gives greater confidence that the pattern (celery > potato > apple) is real rather than chance. These are exactly the two credited points.
Key Takeaways
- The standard repeat-and-mean argument has two halves: spotting anomalies, and improving reliability.
Common Mistakes
- Saying repeats make results "more accurate" — the scheme credits "more reliable"; accuracy refers to closeness to the true value, reliability to consistency.
- Vague answers like "to avoid mistakes" or "human error" score nothing.
Things to Be Careful About
- Give exactly two reasons, one per line, phrased as distinct points.
Another student used the same procedure using a celery cell suspension and hydrogen peroxide. Instead of using a test-tube, they used a measuring cylinder. They measured the total volume of the contents of the measuring cylinder every minute for 5 minutes.
These measurements are shown in Table 1.1. The student did not record the measurement at 4 minutes.
Table 1.1
| time / minutes | total volume of contents / |
|---|---|
| 0 | 4.0 |
| 1 | 11.0 |
| 2 | 16.0 |
| 3 | 19.5 |
| 5 | 20.5 |
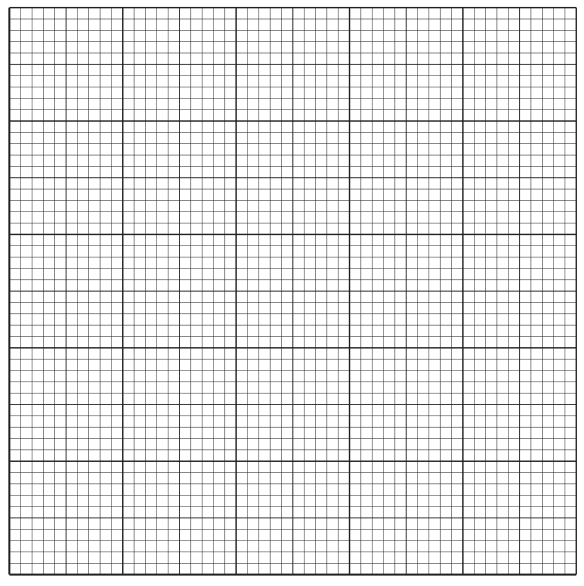
Construct a graph of the data in Table 1.1 on the grid below.
Join your plotted points with ruled, straight lines.
Answer
- x-axis: time / minutes; y-axis: total volume of contents / — both axes fully labelled with units.
- Linear scales starting at 0 at the origin, using at least half the grid in both directions (e.g. 2 cm per minute horizontally, 2 cm³ per 2 large squares vertically).
- All five points plotted accurately as small crosses: (0, 4.0), (1, 11.0), (2, 16.0), (3, 19.5), (5, 20.5).
- Points joined with ruled straight lines; the line stops at 5 minutes — no extrapolation beyond the plotted points.
Line graph: time / minutes on x-axis, total volume / cm³ on y-axis, five plots joined by ruled lines, no extrapolation
Walkthrough
Graph questions on Paper 4/6 are marked on construction, point by point:
- Axes: time always goes on the x-axis (it is the independent variable); total volume goes on the y-axis. Both axes need a full label WITH the unit — "time / minutes" and "total volume of contents / ".
- Scales: linear scales (equal spacing per division), a value shown at the origin (0), and good use of the grid — at least half the grid in each direction. Here time runs 0–5 minutes and volume runs 4.0–20.5 cm³, so start volume at 0 and go up to at least 21 cm³.
- Plots: all five points plotted precisely — within half a small square. Use sharp crosses or encircled dots.
- Line: join the plots with ruled straight lines (this instruction overrides the usual smooth-curve option). Stop at the last point (5 minutes); drawing the line back to time = 0 beyond the data, or forward past 5 minutes, is extrapolation and loses the mark.
Key Takeaways
- The four standard graph marks: labelled axes with units, linear scales with origin value and half-grid use, accurate plots, correct line with no extrapolation.
Common Mistakes
- Swapping the axes (volume on x).
- Omitting units from the axis labels.
- Using an awkward scale (e.g. 3 squares per minute) that makes plotting hard.
- Extrapolating the line to time = 0 or beyond 5 minutes.
- Joining points freehand instead of with a ruler.
Things to Be Careful About
- The question explicitly says "ruled, straight lines" — a smooth curve would lose the fourth mark here even though curves are accepted elsewhere.
- Plot (3, 19.5) needs care: 19.5 sits halfway between gridlines.
Use your graph to estimate the total volume of the contents of the measuring cylinder at 4 minutes.
Show your working on your graph.
total volume at 4 minutes = ______
Answer
total volume at 4 minutes =
(Any value read correctly from the candidate's own line between 3 and 5 minutes scores; the construction lines drawn on the graph count as the working, and the unit must be stated.)
≈ 20.0 cm³ (any correct interpolated reading from the candidate's own graph, with construction lines shown and unit cm³)
Walkthrough
The missing value at 4 minutes lies between the plotted points at 3 minutes (19.5 cm³) and 5 minutes (20.5 cm³). To find it:
- Go up the x-axis to 4 minutes.
- Draw a vertical construction line up to the plotted line.
- Draw a horizontal construction line across to the y-axis.
- Read the volume — about 20.0 cm³ on a correctly drawn graph.
The construction lines ARE the "working on your graph" the question demands — without them you lose a mark even if the number is right. The mark scheme accepts any value consistent with the candidate's own graph, so ecf applies.
Key Takeaways
- Interpolation = reading between plotted points; show dashed construction lines to earn the working mark.
- Always attach the unit () — it is a separate marking point.
Common Mistakes
- Guessing 20.0 without showing construction lines.
- Averaging 19.5 and 20.5 arithmetically but forgetting the unit.
- Reading from a badly scaled graph and getting an inconsistent value.
Things to Be Careful About
- This is interpolation (between points), which is allowed — unlike extrapolation beyond 5 minutes, which is rejected elsewhere in the scheme.
Answer
- The total volume increases with time.
- The increase slows down and the graph plateaus (levels off) after about 3–4 minutes.
- Explanation: the hydrogen peroxide (substrate) is gradually used up as it is broken down, so eventually little or none remains and the reaction stops, so no more oxygen is produced.
Volume increases with time, then plateaus because the hydrogen peroxide/substrate is used up
Walkthrough
Three marks, three linked statements:
- Describe: volume increases with time — oxygen gas from the reaction collects above the liquid, adding to the total volume. Note the direction: time causes volume to change, never the reverse ('as volume increases, time increases' is explicitly rejected).
- Describe: the curve gets shallower and levels off (plateaus) — the rate of reaction falls as time passes.
- Explain: the plateau happens because the hydrogen peroxide is being used up. As substrate concentration falls, fewer enzyme-substrate complexes form per second, so less oxygen is made per minute, until virtually all the substrate is broken down and the reaction stops.
Key Takeaways
- Rate graphs for enzyme reactions typically rise steeply then level off; the explanation is substrate running out (substrate becomes the limiting factor).
- Enzymes are NOT used up — they are catalysts and are reused.
Common Mistakes
- "The enzyme is used up" — explicitly REJECTED by the mark scheme; enzymes are catalysts.
- "As volume increases, time increases" — reversed causation, rejected.
- Describing the shape without explaining it — the explain mark needs the substrate-use-up reason.
Things to Be Careful About
- Underline-worthy word: the scheme underlines volume — talk about the volume increasing, not just "the reaction".
- Link the plateau to a time period visible on your own graph (about 3–5 minutes here).
Fig. 2.1 is a photomicrograph of a section of a celery plant.
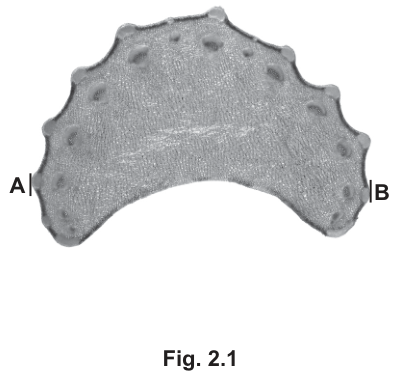
In the space below, make a large drawing of the plant section as it appears in the photomicrograph.
Answer
Large drawing of the celery section: smooth concave lower edge, scalloped upper edge with ridges drawn as double lines with delimited bumps, vascular bundles drawn, at least 90 mm wide, no shading.
Walkthrough
This is the classic 'make a large drawing' task. The examiner is marking HOW you draw as much as WHAT you draw. Work through the mark scheme points:
-
Line quality (1 mark): every line must be a single, clean, continuous line drawn with a sharp pencil. Never sketch in short broken strokes, and never use shading, stippling (dots) or cross-hatching to show tone — biological drawings are outlines only.
-
Size (1 mark): the drawing must be at least 90 mm wide measured across the line A–B. Use a ruler to check before you finish. 'Large' is a mark, not a suggestion.
-
Overall shape (1 mark): the celery petiole section is curved — a smooth concave lower (inner) edge and a scalloped (bumpy) upper (outer) edge. Get the proportions right: the section is wider than it is tall, with the concave side facing down.
-
Detail of the ridges (1 mark): the scalloped upper edge must be drawn with a double line, and each ridge shown as a delimited 'bump' — these are the collenchyma ridges that give celery its ribs. Double lines show that the ridge has thickness, not just an outline.
-
Vascular bundles (1 mark): draw the vascular bundles as distinct outlined shapes within the section, in the positions seen on the photomicrograph (towards the outer/scalloped side).
Key Takeaways
- A biological drawing is a set of continuous outlines with sharp pencil — no shading, stippling or cross-hatching, ever.
- 'Large' always means a stated minimum size; here 90 mm across A–B. Measure it.
- Draw only what is asked for, in the correct proportions and orientation.
- Structural detail (double lines on ridges, vascular bundles) earns separate marks — look carefully at the photomicrograph before starting.
Common Mistakes
- Shading or stippling to show the grey tones of the photomicrograph — this loses the line-quality mark.
- Drawing too small — anything under 90 mm across A–B loses the size mark.
- Drawing the section upside down (convex side down) or with wrong proportions.
- Drawing the scalloped edge as a single line, or drawing the bumps as vague wiggles rather than delimited ridges.
- Omitting the vascular bundles, or sketching with broken, hairy lines instead of one continuous stroke.
Things to Be Careful About
- Use a sharp HB pencil and a good eraser; do not use pen or coloured pencils.
- Check the 90 mm minimum width with a ruler before finishing — this is a printed mark-scheme figure, not a guideline.
- Keep the drawing to the section only: no background, no magnification written on the drawing at this stage.
- The concave edge is the smooth inner curve; the scalloped edge with ridges is the outer edge — match the photomicrograph's orientation.
Draw a straight line to join A and B on Fig. 2.1. This is the length of the plant section in the photomicrograph. Measure and record this length.
length A–B = ______
Answer
length A–B = (any value in the range 59–61 mm)
59–61 mm
Walkthrough
Place a ruler carefully across Fig. 2.1 joining the two marks A and B, and read the length to the nearest millimetre. The mark scheme accepts 59–61 mm, so small differences in how you place the ruler are allowed — but a value outside that range shows careless measuring. Record the number with its unit, mm.
Key Takeaways
- Measure between the exact points indicated by the letters, not across the widest part of the image.
- Record to the nearest mm with the unit.
Common Mistakes
- Measuring the vertical height of the section instead of the A–B width.
- Omitting the unit, or reading to the nearest half cm.
- Giving a value outside 59–61 mm through careless ruler placement.
Things to Be Careful About
- The line must join A to B as printed — the two marks are at the two outer lateral edges of the curved section.
- Any value from 59 to 61 inclusive scores; the printed range is the answer, not one exact number.
On your drawing, draw a straight line in the same position as the line A–B you have drawn on the photomicrograph. Measure and record the length of this line.
length of line on drawing = ______
Answer
Draw a straight line across the drawing in the same position as A–B on the photomicrograph (joining the same two lateral edges), then measure it with a ruler and record the length in mm, e.g. length of line on drawing = (the candidate's own measured value).
Correct line drawn in the same position as A–B and its measured length in mm recorded (candidate-dependent value)
Walkthrough
On your own drawing from part (a), rule (lightly, in pencil) a straight line joining the same two points that A and B join on the photomicrograph — the two outer lateral edges of the section. Then measure that line with a ruler and record it in mm. The mark is for the line being in approximately the correct position AND the measurement being correct for your drawing. Since your drawing is 'large' (at least 90 mm wide), your measured line should be at least 90 mm — if it is smaller, your drawing is too small and part (a) will also have lost the size mark.
Key Takeaways
- The line on the drawing must correspond in position to A–B on the photomicrograph.
- The measured length is used in (b)(iii) as the 'image size' in the magnification calculation.
Common Mistakes
- Drawing the line across the wrong part of the drawing (e.g. vertically instead of across the width).
- Recording a length inconsistent with the drawing actually produced.
- Forgetting to actually draw the line — the mark requires both the line and the measurement.
Things to Be Careful About
- This value is carried forward into (b)(iii), so measure carefully and keep the unit (mm).
- ecf applies: if your measurement here is wrong, the magnification in (b)(iii) can still score for correct method.
Use your measurements in (b)(i) and (b)(ii) to calculate the magnification of your drawing compared to the photomicrograph. Record your answer to 2 decimal places.
Show your working.
magnification ______
Working
Answer
magnification (using the candidate's own measured values; the answer must be given to 2 decimal places, with no unit)
Candidate's (b)(ii) value divided by (b)(i) value, expressed as × and given to 2 decimal places (e.g. ×2.00)
Walkthrough
Magnification is simply how many times bigger your drawing is than the photomicrograph:
Here the 'image' is your drawing and the 'actual size' is the photomicrograph. So divide your answer to (b)(ii) by your answer to (b)(i). Both are in mm, so the units cancel and the magnification is a pure number written with the × sign — magnification has no unit. The mark scheme awards: (1) the division set up correctly as (b)(ii) ÷ (b)(i), (2) the correct value, and (3) the answer given to exactly 2 decimal places. If your drawing is twice the size of the photomicrograph, 120 ÷ 60 = 2.00, so magnification × 2.00.
Key Takeaways
- Magnification = length on drawing ÷ length on the original, with both lengths in the same unit.
- Magnification is written with the multiplication sign (×) and carries no unit.
- 'To 2 decimal places' means exactly two digits after the point: 2.00, not 2 or 2.0.
Common Mistakes
- Dividing the wrong way round (photomicrograph ÷ drawing), which gives a value less than 1 for a 'large' drawing.
- Omitting the × sign, or writing a unit such as 'mm' after the magnification.
- Giving 2 or 2.0 instead of 2.00 — the 2 d.p. mark is lost.
- Mixing units (measuring one line in cm and the other in mm) without converting.
Things to Be Careful About
- Show the substitution as well as the answer — the scheme awards a mark for the correct division set up.
- ecf applies: an error in (b)(i) or (b)(ii) can still earn the method and rounding marks if the division is done correctly with the wrong value.
- Round only at the end, and always to exactly 2 decimal places as instructed.
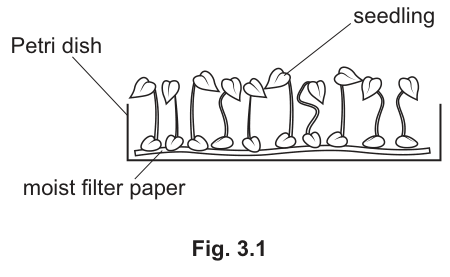
Plan an investigation to find out the effect of varying light intensity on the increase in height of mustard plant seedlings provided in Petri dishes, as shown in Fig. 3.1.
Answer
- Set up at least three Petri dishes and expose them to different light intensities by placing them at different distances from a lamp (or using different bulbs / a dimmer switch).
- Ensure the light source is directed from above only (e.g. place in a dark room with only the lamp as a light source, or use a heat shield to prevent heat from the lamp affecting temperature).
- Keep controlled variables constant: same volume of water, same nutrients, same temperature, and the same time / time interval between measurements.
- Measure and record the starting height (length) of the seedlings in each dish.
- After the set time period, measure and record the final height of the seedlings.
- Calculate the mean change (or mean increase) in height per dish for each light intensity.
See working
Walkthrough
- The question asks for a plan to investigate the effect of light intensity on seedling height. This is a classic practical planning question worth 6 marks. The mark scheme provides a list of 8 potential marking points, from which the candidate must select 6.
- First, define the independent variable: light intensity. The scheme requires at least 3 different values, so we must state we will use at least three different intensities. We also need to specify how we will vary it: by changing the distance from a lamp, using different bulbs, or using a dimmer switch. Simply saying "use different light intensities" scores zero because it does not describe the method.
- Second, control the light direction and background: the light must come from above only. This is crucial because if light comes from the side, phototropism will cause the seedlings to bend, skewing the height measurement. An acceptable alternative (AVP) is to place the apparatus in a dark room with only the lamp as a light source, or to use a heat shield.
- Third, identify and state the controlled variables. The scheme gives examples: volume of water, nutrients, temperature. We must also state that the time or time between measurements must be the same for all dishes. Vague answers like "same conditions" do not score.
- Fourth, describe the measurement protocol. We need to measure the starting height and the final height of the seedlings to calculate the actual increase. Measuring only the final height does not score because we do not know how much they grew.
- Fifth, describe the data analysis. We must calculate the mean change (or mean increase) in height per dish for each light intensity to allow a fair comparison between the groups.
Key Takeaways
- A 6-mark planning question requires a structured method that covers: the range of the independent variable, how it is manipulated, the controlled variables, the measurement protocol, and the data analysis.
- Always specify how you will change the independent variable (e.g. distance, not just "different light intensities").
- Include AVPs like heat shields or dark rooms to show awareness of confounding variables (like heat from the lamp affecting temperature).
- Always mention measuring both starting and final values when the question asks for an "increase" or "change".
Common Mistakes
- Stating "use different light intensities" without explaining how (e.g. distance or different bulbs).
- Forgetting to mention that the light must come from above only, which could cause phototropism to bend the seedlings and invalidate the height measurement.
- Not specifying that you need to measure both starting and final heights to calculate the change or increase.
- Forgetting to calculate a mean; stating "find the average" without specifying it is the mean change per light intensity.
- Listing vague controlled variables like "same conditions" instead of naming specific variables like temperature, volume of water, or nutrients.
Things to Be Careful About
- The mark scheme awards up to 6 marks from a list of 8 points. You only need to provide 6 clear, distinct points, but providing all 8 ensures you cover the required ones.
- Ensure you mention "mean change" or "mean increase" in height, not just "measure the height".
- Use precise terminology: "controlled variables", "independent variable", "mean".
- Use a numbered list format for the answer to make it easy for the examiner to award marks point by point.
- Remember that 5090 planning questions are marked on the method and structure, so clarity and specificity are more important than elaborate prose.