Biology 5090/41 — May/June 2025
Cambridge O-Level · Alternative to Practical · worked solutions for every part, with the mark scheme
Topics Experimental Contexts · Observations and Measurements · Microscopy and Biological Drawing · Analysis, Conclusions and Evaluation · Planning Experiments and Investigations · Use of Techniques, Apparatus and Materials
A student investigated the effect of gravity on germinating seeds. Eight pea seeds were used.
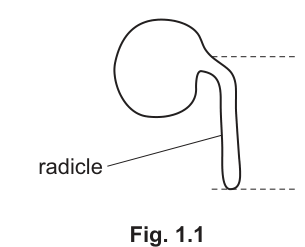
As they germinated, the pea seeds first produced radicles (roots). The length of the radicle can be measured between the dotted lines as shown in Fig. 1.1.
The student attached four of the seeds with germinating radicles to the cork base on each of two electric motors, as shown in Fig. 1.2. The cork was kept wet during the investigation and the apparatus was kept in the dark.
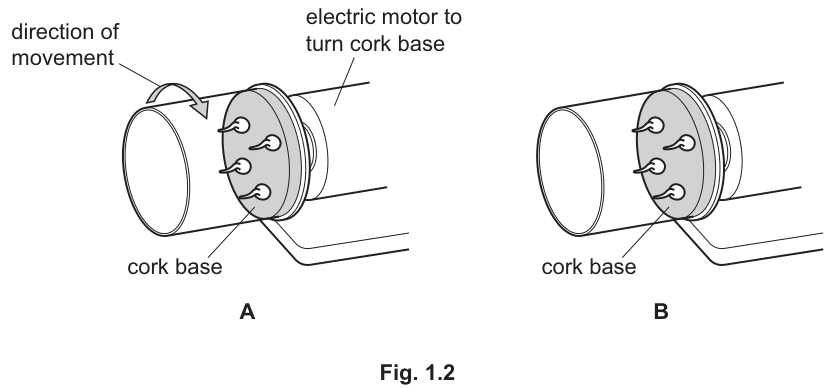
The student then switched on motor A so that the cork base rotated very slowly for two days, turning in the direction indicated by the arrow.
Motor B was not switched on so the cork base did not rotate.
Fig. 1.3 shows the pea radicles after 2 days.
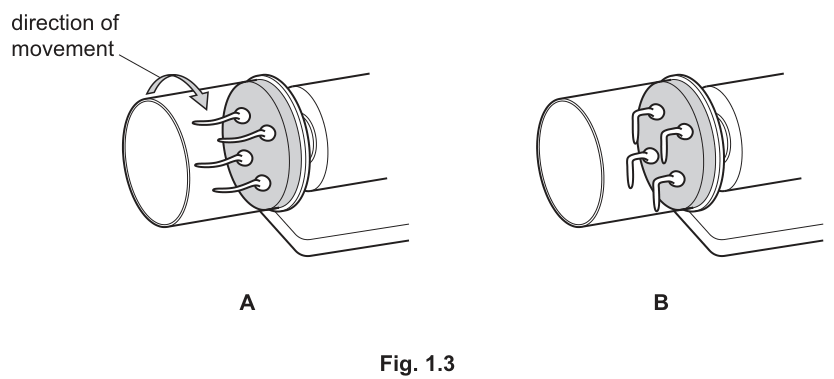
Fig. 1.4 shows the actual size of the four germinating peas from A after two days.
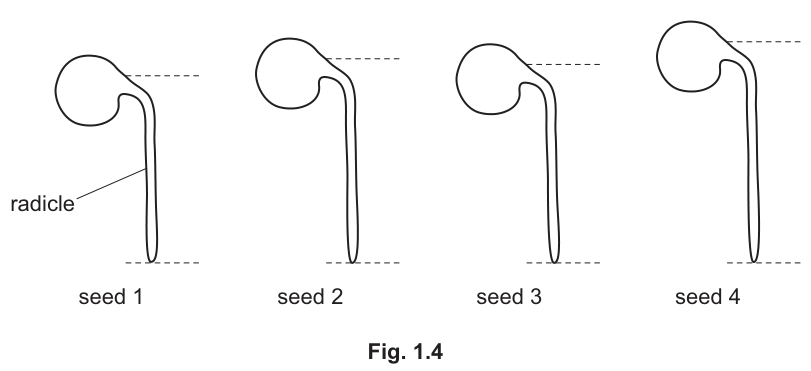
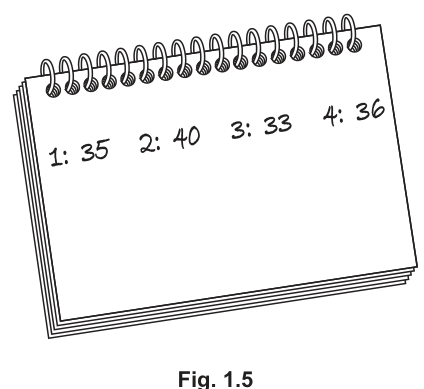
Fig. 1.5 shows the lengths recorded (in millimetres) in the student's notebook for the four radicles from B after two days.
You are going to measure and record the length of each radicle from A (the distance between the dotted lines in Fig 1.4).
In the space below construct a table in which to record your measurements from A and the student's measurements from B.
Answer
| seed | length / mm | |
|---|---|---|
| A | B | |
| 1 | ||
| 2 | ||
| 3 | ||
| 4 |
Ruled table with one 'seed' header, one 'length / mm' header, and single headers for A and B, with four numbered seed rows
Walkthrough
The question asks you to build the table before filling it in — parts (ii) and (iii) then put numbers into it. The marks are all about table CONSTRUCTION:
- Draw the table with a ruler so every row and column is a ruled line.
- Each header appears ONCE only. Do not write 'seed 1', 'seed 2'... as separate headers — one column (or row) headed 'seed' covers them all. Similarly 'length / mm' is written once, not repeated in every cell.
- The unit goes in the HEADER ('length / mm'), never in the cells themselves. Writing '33 mm' in every cell loses the unit mark because the unit belongs in the heading.
- A and B are each named once only, as sub-headings of the length column.
Key Takeaways
A well-constructed table has: ruled lines, each variable named once in an overarching header, the unit in the header after a slash, and no information written twice.
Common Mistakes
- Repeating the unit in every data cell instead of putting it in the header.
- Writing the seed number as part of the header row so 'seed' is never stated once.
- Omitting the unit entirely from the header.
- Drawing a freehand table without ruled lines.
Things to Be Careful About
The mark scheme scores this arithmetically by construction point, so each convention is worth its own mark. Use the slash form 'length / mm' exactly as 5090 prints it.
Answer
Seed 1 = 33 mm, seed 2 = 36 mm, seed 3 = 35 mm, seed 4 = 39 mm
33, 36, 35, 39 mm
Walkthrough
Fig. 1.4 shows the four radicles at actual size, so you measure each one directly with a ruler, from the upper dotted line (where the radicle emerges) to the lower dotted line (the tip). Record each to the nearest whole millimetre. The mark scheme accepts a small range on each value (e.g. seed 1: 32–34 mm) because ruler placement varies slightly. Two marks: one for all four values being correct within range, one for placing them in the correct cells in the correct order (seed 1 first, etc.).
Key Takeaways
Measure between the exact reference points given (the dotted lines), record to the nearest mm, and keep the order of the seeds consistent throughout the paper.
Common Mistakes
- Measuring from the top of the seed instead of from where the radicle emerges.
- Recording values out of order, which loses the second mark even if the values are right.
- Writing the unit in each cell when it already sits in the table header.
Things to Be Careful About
The scheme gives accepted ranges (±1 mm), so a reading of 34 for seed 1 still scores — but 30 does not. Measure carefully along the full dotted-line span.
Answer
Seed 1 = 35, seed 2 = 40, seed 3 = 33, seed 4 = 36 (mm)
35, 40, 33, 36 mm
Walkthrough
Fig. 1.5 shows the student's notebook readings for B: 1: 35, 2: 40, 3: 33, 4: 36. Copy these into the B column of your table against the matching seed number. One mark for correct transfer of all four values in the correct places.
Key Takeaways
Data transfer must be accurate AND correctly positioned — a value in the wrong row is wrong data.
Common Mistakes
- Swapping two values between rows.
- Copying the notebook order but writing them under the wrong seed headings.
Things to Be Careful About
Do not add or change any digits — transcribe exactly what Fig. 1.5 shows.
Calculate the mean lengths of the radicles from A and B and record them to 1 decimal place.
A mean length = ______
B mean length = ______
Working
Answer
A mean length = 35.8 mm
B mean length = 36.0 mm
A = 35.8 mm, B = 36.0 mm
Walkthrough
Add the four values for each set and divide by 4. For A: 33 + 36 + 35 + 39 = 143, and 143 ÷ 4 = 35.75, which rounds to 35.8 to 1 decimal place. For B: 35 + 40 + 33 + 36 = 144, and 144 ÷ 4 = 36.0 exactly. Note that 36.0 must be written WITH the '.0' — the question demands 1 decimal place, so '36' alone would not show the required precision.
Key Takeaways
Mean = sum ÷ number of values; round only at the end; always give the number of decimal places asked for.
Common Mistakes
- Writing 36 instead of 36.0 for B.
- Rounding 35.75 down to 35.7 instead of up to 35.8.
- Dividing by 5 or forgetting one seed.
Things to Be Careful About
ecf applies: if your measured values in (ii) were within the accepted ranges, use YOUR values consistently here.
Use Fig. 1.3 and the mean lengths in (iv) to suggest what the student should conclude about the response of radicles to gravity.
Answer
- In B the radicles curved downwards, while in A they grew straight in their original directions.
- B shows positive gravitropism — gravity acts on the stationary radicles.
- Rotation cancels the effect of gravity, so the radicles in A receive no directional stimulus.
- The overall mean lengths are similar (35.8 mm vs 36.0 mm), so rotation did not affect the amount of growth, only its direction.
Radicles grow straight when rotated (no gravity stimulus) but curve downwards towards gravity when stationary (positive gravitropism); similar mean lengths show total growth was unaffected.
Walkthrough
This is a 'suggest' question — apply syllabus biology to the apparatus. Three marks from four listed points:
- Describe the difference visible in Fig. 1.3: in stationary B all four radicles bent downwards; in rotating A they stayed straight along their original directions.
- Name the response: roots growing towards gravity show positive gravitropism, so gravity acts on B.
- Explain why A differs: because the cork rotates slowly, each side of the radicle is exposed to gravity equally in turn, so there is no constant direction for the root to curve towards — the effect of gravity is cancelled.
- Use the means: 35.8 mm and 36.0 mm are nearly equal, showing the same amount of growth occurred in both — only the direction differed.
The word 'gravitropism' earns its own credit; 'gravity acts on B' is the simpler acceptable wording.
Key Takeaways
Roots are positively gravitropic. A clinostat-style rotation removes the directional gravity stimulus without removing gravity itself, so growth continues but stays straight.
Common Mistakes
- Saying 'no gravity in A' — gravity still acts; its DIRECTIONAL effect is cancelled by rotation.
- Concluding that rotation stopped growth — the means prove growth continued.
- Describing the curves without naming gravitropism or linking to gravity.
Things to Be Careful About
Use both pieces of evidence: the shapes in Fig. 1.3 AND the mean lengths in (iv). A conclusion citing only one loses a mark.
Suggest why the student should repeat the investigation several times to obtain results for more pea seeds.
Answer
- Four peas is too small a sample, so repeating identifies any anomalous results / outliers.
- More results make the conclusion more reliable.
To identify anomalous results (four peas is too small a sample) and make the results more reliable.
Walkthrough
With only four seeds per condition, one seed that germinates poorly or grows unusually could distort the mean. Repeating the investigation with many more seeds lets the student spot outliers and average over natural variation between seeds. This makes the mean and the conclusion more reliable — the same trend seen across many seeds is much stronger evidence than one set of four.
Key Takeaways
Repeats serve two purposes: detecting anomalies and increasing reliability. Both halves earn separate marks.
Common Mistakes
- Vague answers like 'to avoid mistakes' or 'human error' — rejected by the scheme.
- Saying 'more accurate' when the correct term is 'more reliable'.
- Giving only one half of the answer (reliability without the anomaly/small-sample reason).
Things to Be Careful About
Name the quantity affected: the sample size of pea seeds. Pair each improvement with the limitation it addresses.
Answer
- Light affects growth, so keeping the apparatus dark controls light as a variable.
- This ensures gravity is the only factor being investigated.
- Roots normally grow underground in the dark, so darkness matches natural conditions.
So that light does not affect the results — light is controlled, leaving gravity as the only variable investigated.
Walkthrough
Shoots respond to light (phototropism) and light can influence growth rate generally. If the apparatus were lit, any difference between A and B might be due to light direction or intensity rather than gravity. Keeping everything in the dark holds light constant, making gravity the ONLY variable being tested — a fair test. It also matches nature: pea roots grow underground in darkness anyway, so the seeds behave normally.
Key Takeaways
In any tropism experiment, control the other stimuli. Darkness removes phototropism as a confounding factor.
Common Mistakes
- Saying 'seeds need dark to germinate' — the seeds had already germinated; the reason is about controlling the variable.
- Vague answers like 'so nothing interferes'.
- Only giving one of the credited reasons when two are needed for 2 marks.
Things to Be Careful About
Any two of the three listed points score. The strongest pair is 'light is controlled' + 'gravity is the only factor investigated'.
Another student investigated the growth of the shoots (plumules) of germinating pea seeds for eight days.
The student's results are shown in Table 1.1.
Table 1.1
| time / days | mean height of shoot / |
|---|---|
| 0 | 3 |
| 2 | 6 |
| 4 | 10 |
| 6 | 13 |
| 8 | 16 |
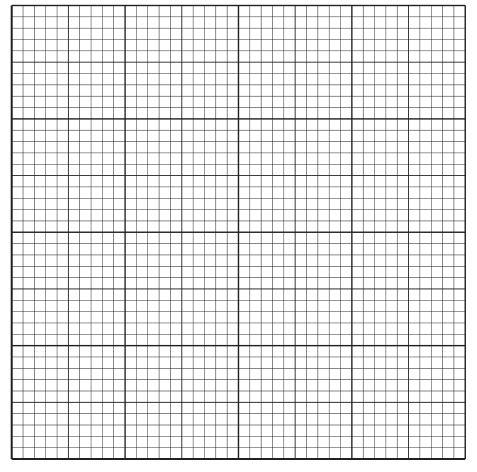
Construct a graph of the data in Table 1.1 on the grid below. Join your plotted points with ruled, straight lines.
Answer
Line graph: time / days on x-axis (0–8), mean height of shoot / mm on y-axis (0–16), five points plotted and joined with ruled straight lines
Walkthrough
Four construction marks:
- Time goes on the x-axis (it is the independent variable) and shoot height on the y-axis. BOTH axes fully labelled with the quantity AND its unit: 'time / days' and 'mean height of shoot / mm'.
- Linear scales — equal steps per square — with a value written at the origin, chosen so the plotted data fills at least half the grid in each direction. Here x: 0–8 days and y: 0–16 mm fit comfortably.
- Plot all five points exactly: (0, 3), (2, 6), (4, 10), (6, 13), (8, 16).
- Join the points with ruled straight lines — do NOT draw a smooth curve here, and do NOT extend the line beyond the last plotted point (no extrapolation).
Key Takeaways
Independent variable on x, dependent on y; label axes as 'quantity / unit'; scale to fill the grid; plot precisely; join as instructed.
Common Mistakes
- Swapping the axes (height on x).
- Missing units on either axis label.
- A smooth curve when ruled straight lines were demanded.
- Extrapolating beyond day 8 or back before day 0.
- Scales too cramped so the line occupies a corner of the grid.
Things to Be Careful About
The instruction says 'ruled, straight lines' — follow it literally. Points should be plotted to within half a small square.
Use your graph to estimate the mean height of the pea shoots on day 5.
Show your working on the graph.
mean height = ______
Working
Draw a vertical line up from day 5 on the x-axis until it meets the graph line, then a horizontal line across to the y-axis. Read the value where it crosses the y-axis: approximately 11.5 mm (accept ~11–12 mm from the candidate's own graph).
Answer
mean height = 11.5 mm
Approximately 11.5 mm (any value read correctly from the candidate's own graph with working shown)
Walkthrough
Day 5 lies between the plotted points at day 4 (10 mm) and day 6 (13 mm), so this is interpolation — reading a value from WITHIN the plotted range, which is valid. On your graph: rule a vertical line up from 5 on the time axis to the graph line, then rule horizontally to the height axis and read off. Halfway between 10 and 13 gives about 11.5 mm. Three marks: the correct value read from YOUR OWN graph, the construction lines drawn on the graph as working, and the unit (mm) with the answer.
Key Takeaways
Interpolation (inside the data range) is reliable; extrapolation (outside it) is not. Always show dashed construction lines for a read-off and give the unit.
Common Mistakes
- Reading from the wrong axis or misreading the scale.
- Omitting the unit 'mm'.
- Not drawing the construction lines — the scheme awards a mark for the working shown on the graph.
- Extrapolating instead of interpolating.
Things to Be Careful About
The scheme accepts a correct reading from the candidate's own graph, so consistency with your plotted line matters more than hitting exactly 11.5. Values around 11–12 mm drawn correctly will score.
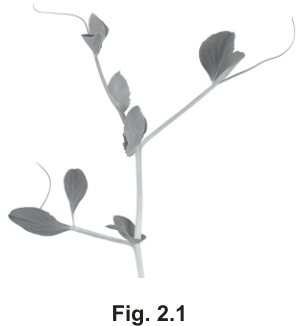
Fig. 2.1 shows part of the shoot of a pea seedling.
Answer
Make a large drawing of the pea shoot as shown in Fig. 2.1, observing the following:
- Draw with a sharp pencil using clear, clean, continuous lines; no ruled lines and no shading or stippling anywhere.
- Make the drawing at least 90 mm in size.
- Draw the stems with a double line, showing one main stem and three branches.
- Draw at least seven leaves, with the two end leaves on the lower left branch clearly delimited (outlined with a definite edge).
- Show the three tendrils in their correct positions, curling from the tops of the branches.
Large drawing of the pea shoot, at least 90 mm, drawn in clean continuous pencil lines with no shading, showing one main stem and three branches in double line, at least seven leaves with the two end leaves of the lower left branch delimited, and three tendrils in the correct positions.
Walkthrough
This is a classic Paper 4 drawing task. The examiner is not only checking that you can copy the photograph — half the marks are for how you draw, not what you draw.
Step 1: Study Fig. 2.1 carefully before drawing anything. Identify the main stem rising from the bottom, the branches coming off it, the compound leaves (each made of several leaflets), and the thin curly tendrils at the tips of the upper branches.
Step 2: Plan the size. The mark scheme demands a minimum of 90 mm — roughly the width of your palm. A tiny drawing cannot show the detail, so start large. Lightly judge proportions first: the main stem is the longest structure, the lower left branch carries a leaf with two clearly outlined end leaflets, and the tendrils are thin, unbranched, curling threads.
Step 3: Draw the stems with a double line — two parallel lines with a small gap between them — because a stem is a three-dimensional tube, not a single stroke. The scheme credits one main stem and three branches.
Step 4: Draw the leaves. You need at least seven, and the two end leaflets of the lower left branch must be delimited — given a complete, definite outline so their shape is clear, not left vague or fading out.
Step 5: Add the three tendrils in their correct positions — curling from the tips of the branches, thin and unbranched.
Step 6: Check your technique: every line continuous (not sketchy or broken), nothing ruled with a ruler, no shading, stippling or cross-hatching to indicate darkness. In biological drawing, tone is never used — shape and outline carry all the information.
Key Takeaways
- Biological drawing conventions: sharp pencil, clear continuous lines, no shading, no ruled lines.
- Size matters: a stated minimum size (here 90 mm) is itself a marking point.
- Stems and tubes are drawn with double lines.
- Accuracy of observation — correct numbers of structures (3 branches, 7 leaves, 3 tendrils) and correct positions — earns the content marks.
Common Mistakes
- Shading or stippling to show the dark leaflets — the scheme rejects this outright; outline only.
- Using a ruler for the stem — ruled lines are explicitly rejected.
- Drawing too small — below 90 mm loses a mark however accurate the drawing is.
- Single-line stems — stems must be double-lined.
- Omitting or misplacing the tendrils, or drawing fewer than seven leaves.
- Leaving the end leaflets of the lower left branch without a definite outline (not delimited).
Things to Be Careful About
- Count the structures in the photograph before you draw: one main stem, three branches, at least seven leaves, three tendrils. The mark scheme counts them.
- Draw what you see, not what you think a pea plant should look like — the lower left branch has a distinctive leaf with two delimited end leaflets, and that specific detail is credited.
- Spend time on line quality: a slow, single, confident pencil stroke scores; a hairy, over-drawn line does not.
- Do not add labels unless asked — this part asks only for the drawing itself.
The leaves of the pea shoot are green.
Describe how you would prepare a leaf from the shoot and then carry out a test on it to show that it contains starch.
Answer
- Dip the leaf in boiling water (to kill and soften it).
- Boil it in hot ethanol (in a water-bath) to remove the chlorophyll.
- Rinse the leaf in water (to soften it and wash off the ethanol).
- Add iodine solution: it turns blue-black, showing that starch is present.
Dip in boiling water; boil in hot ethanol to remove chlorophyll; rinse in water; add iodine solution which turns blue-black, showing starch is present.
Walkthrough
This is the standard 'testing a leaf for starch' procedure that underpins all photosynthesis experiments in 5090. The mark scheme lists four points but allows a maximum of 3, so any three of the four score — but the cleanest full answer includes all four.
Step 1 — boiling water: the leaf is dipped in boiling water for about 30 seconds. This kills the leaf, breaks down the cell membranes and softens the tissue so the chemicals can penetrate. The mark scheme's first point is simply 'dip in boiling water'.
Step 2 — hot ethanol: the leaf is boiled in ethanol (using a water-bath, never a direct flame, because ethanol is highly flammable). Ethanol dissolves out the green chlorophyll, so the leaf turns white/pale and the iodine colour change will be visible. The mark scheme credits 'use of hot ethanol (to remove chlorophyll)'.
Step 3 — water: the brittle, ethanol-soaked leaf is rinsed in warm water. This washes off the ethanol and re-softens the leaf so it can be spread flat on a white tile. The scheme credits 'use of water (to rinse / soften)'.
Step 4 — the test itself: iodine solution is added to the leaf on a white tile. Iodine is the specific test for starch: if starch is present the iodine turns from brown/orange to blue-black. A green leaf from a plant that has been photosynthesising contains starch, so the expected result is blue-black.
The order matters: water first (kill and soften), then ethanol (decolourise), then water again (rinse and soften), then iodine. Doing the ethanol step before the boiling-water step, or omitting the rinse, loses the flow even if the individual steps are named.
Key Takeaways
- The four stages of the starch test on a leaf: boiling water → hot ethanol → water → iodine solution.
- Ethanol removes chlorophyll so the colour change can be seen; it must be heated in a water-bath for safety.
- Iodine solution turns blue-black in the presence of starch.
Common Mistakes
- Writing 'boil in ethanol' without noting it is done in a water-bath — a direct flame would ignite the ethanol (a safety point examiners often probe).
- Saying the ethanol step is 'to kill the leaf' — killing is the job of the boiling water; ethanol removes chlorophyll.
- Omitting the second water rinse — the leaf must be softened before iodine is added.
- Giving the wrong colour change: iodine gives blue-black with starch, not purple (that is biuret for protein) or brick-red (that is Benedict's for reducing sugar).
- Testing with Benedict's solution instead of iodine — Benedict's tests for reducing sugars, not starch.
Things to Be Careful About
- The mark scheme allows a maximum of 3 from the four listed points, so give all four to be safe — any three score.
- Use the exact colour term 'blue-black'; 'dark' or 'black alone' is less secure.
- State the purpose in brackets where the scheme does — 'hot ethanol (to remove chlorophyll)' — because the purpose can be the credited half of the point.
- Sequence your answer in the order the steps are actually carried out.
Urine tests can be used to diagnose diseases.
Indicator paper strips are dipped into a sample of urine. They detect substances excreted in the urine sample that are not normally present in the urine of a healthy person.
Three examples of indicator paper strips are:
- Diastix® to detect glucose
- Albustix® to detect protein
- Ketostix® to detect ketones.
Patients with diabetes excrete glucose and ketones.
Patients with nephritis excrete protein.
Patients with malnutrition excrete ketones.
Table 3.1 shows the results of tests on the urine samples of four individuals (D, E, F and G). A tick (✓) indicates a positive test and a cross (✗) indicates a negative test.
Table 3.1
| indicator test strip | urine sample D | urine sample E | urine sample F | urine sample G |
|---|---|---|---|---|
| Diastix® | ✗ | ✓ | ✗ | ✗ |
| Albustix® | ✓ | ✗ | ✗ | ✗ |
| Ketostix® | ✗ | ✓ | ✗ | ✓ |
Answer
F is the healthy individual because all three urine tests are negative – no glucose, protein or ketones are detected.
F – all tests negative
Walkthrough
The table shows the result of three indicator tests for each person. A healthy person should not have glucose, protein or ketones in their urine, so all three tests should be negative. Looking down each column:
- D is positive for protein only.
- E is positive for glucose and ketones.
- F is negative for all three.
- G is positive for ketones only.
Only F has every test negative, so F is the healthy individual.
Key Takeaways
Urine tests can detect substances that are not normally present in a healthy person. To decide who is healthy, check every test for each individual and look for all negative results.
Common Mistakes
- Choosing D because protein is abnormal – protein suggests nephritis, not health.
- Choosing G because ketones are positive – ketones suggest malnutrition, not health.
- Saying only “F has no glucose” without stating that all three tests are negative.
Things to Be Careful About
The mark requires both the individual and the reason. The reason must be that all tests are negative, not just one test.
Answer
E is the individual with diabetes. Her urine is positive for both glucose and ketones, which are excreted by patients with diabetes.
E – positive for glucose and ketones
Walkthrough
The stem states that patients with diabetes excrete glucose and ketones. Therefore the diabetic urine sample must be positive for both of these substances.
Looking down the columns:
- D is positive only for protein, which suggests nephritis.
- E is positive for glucose and ketones, which matches diabetes.
- F is negative for all three.
- G is positive only for ketones, which suggests malnutrition.
Only E has both glucose and ketones positive, so E has diabetes.
Key Takeaways
A combination of test results can be used to diagnose a condition. Diabetes is linked to both glucose and ketones in the urine.
Common Mistakes
- Choosing D because protein is positive – protein is linked to nephritis, not diabetes.
- Choosing G because ketones are positive – ketones alone are linked to malnutrition.
- Saying “E has sugar” instead of using the exact term “glucose”.
- Giving only E without mentioning both glucose and ketones.
Things to Be Careful About
The mark scheme gives one mark for E and one for a positive test for glucose and ketones. Use the exact terms “glucose” and “ketones” and mention both.
The pH of urine in healthy humans is normally 6.5. The pH of urine can be measured using universal indicator paper strips.
A scientist wants to determine whether the pH of human urine is affected by the volume of water drunk. For her investigation she selects 20 healthy female volunteers of similar age and weight.
Plan a method the scientist could use for her investigation.
Answer
- Check the pH of urine from all 20 volunteers at the start of the investigation (expected around 6.5).
- Divide the volunteers into groups, each group drinking a different volume of water, for example 0, 500, 1000, 1500 and 2000 .
- Use the same time interval between drinking the water and collecting the urine for every volunteer.
- Keep other variables constant: give all volunteers the same diet and exercise, and keep the environmental temperature the same.
- After the fixed time, collect a urine sample and measure its pH using universal indicator paper compared with a standard chart, or use a pH meter.
- Repeat the investigation for each volume and calculate the mean pH for each volume. Look for a relationship between the volume of water drunk and the pH of urine, for example by plotting a graph of mean pH against volume of water.
Numbered method plan: check baseline pH, vary water volume, keep time and other variables constant, measure urine pH, repeat and look for a relationship.
Walkthrough
This is a planning investigation. The independent variable is the volume of water drunk. The dependent variable is the pH of the urine. All other variables must be controlled so that any change in pH is caused only by the volume of water.
First, the scientist should check the normal urine pH of the 20 volunteers at the start, because the stem says healthy urine is normally about 6.5. Then she should choose a range of water volumes, from zero to a large volume, and divide the volunteers into groups for each volume.
The time between drinking and measuring must be the same for everyone, otherwise some urine samples would be more diluted than others. Diet, exercise and environmental temperature must also be kept the same, because these could affect urine composition and pH.
After the fixed time, she should collect urine samples and measure the pH using universal indicator paper compared with a standard chart, or a pH meter. To make the results reliable, the investigation should be repeated and the mean pH calculated for each volume. Finally, she should look for a relationship, for example by plotting a graph of mean pH against volume of water, to see whether the volume of water affects urine pH.
Key Takeaways
A fair test controls all variables except the one being changed. Repeats and means improve reliability. A graph or relationship allows a conclusion to be drawn from the data.
Common Mistakes
- Using only one volume of water, so no relationship can be seen.
- Not controlling diet, exercise or temperature.
- Not using the same time interval between drinking and measuring.
- Not saying how the pH is measured.
- Not repeating the measurements or calculating a mean.
- Writing a description instead of a numbered method.
Things to Be Careful About
The mark scheme expects a range of volumes, a fixed time interval, control of other variables, measurement of pH by indicator paper or pH meter, repeats and a mean, and a search for a relationship. Include all of these in the plan. Use units such as for volume and remember that the answer should be a method that another scientist could follow.