Biology 5090/32 — May/June 2025
Cambridge O-Level · Practical Test · worked solutions for every part, with the mark scheme
Topics Experimental Contexts · Observations and Measurements · Planning Experiments and Investigations · Use of Techniques, Apparatus and Materials · Analysis, Conclusions and Evaluation · Microscopy and Biological Drawing
Catalase is an enzyme found in living cells. This enzyme catalyses the breakdown of hydrogen peroxide into oxygen and water. Some plant cells are a source of catalase.
If some material from a plant is crushed and added to water, a suspension of the contents of the plant's cells can be obtained.
When hydrogen peroxide solution is added to this suspension, any oxygen produced is released as bubbles of gas. These bubbles collect to form a foam on top of the suspension, as shown in Fig. 1.1. Greater height indicates greater catalase activity.
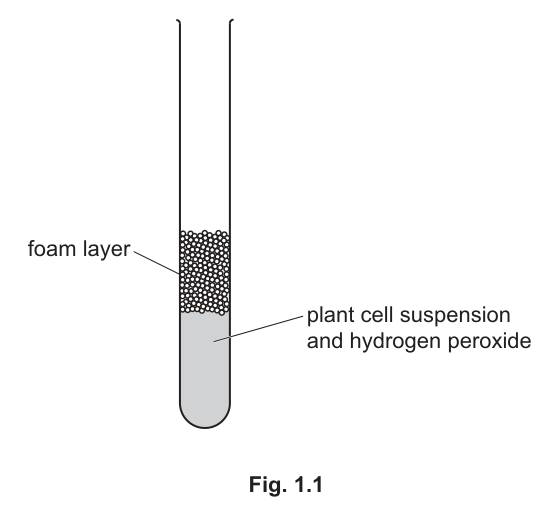
You are going to investigate the activity of catalase in three different suspensions of plant cells, celery, apple and potato.
Read these instructions and then answer (a)(i):
- use a clean stirring rod to stir the celery cell suspension in the beaker
- pour the celery cell suspension into a clean, large test-tube to a depth of
- use a clean syringe to add of hydrogen peroxide to this large test-tube
- immediately start timing
- measure the total height of any foam layer produced every 30 seconds for 2 minutes, recording your measurements
- repeat these instructions using the apple cell suspension and then the potato cell suspension.
Answer
| height of foam / (celery) | height of foam / (apple) | height of foam / (potato) | |
|---|---|---|---|
| 30 | |||
| 60 | |||
| 90 | |||
| 120 |
Fully ruled results table with time / s (30, 60, 90, 120) and height / mm headers for celery, apple, and potato
Walkthrough
When designing a data table for an experimental investigation, adhere to the following key criteria:
- Ruled lines: The table must be enclosed with fully ruled grid lines for both rows and columns.
- Independent variable: Time is recorded in the first column or top row, stating the unit once in the header (
time / sortime / minutes). The intervals must match the instructions: every 30 seconds up to 2 minutes (, , , ). - Dependent variable: The measured parameter is foam height, with its unit specified in the header (
height / mmorheight / cm). - Plant tissues: The three tissues tested (celery, apple, potato) must each have a designated, distinct column/row header and appear once only.
Key Takeaways
- Never repeat units in the data cells; place them only in the column or row headers using the slash notation (e.g.,
time / s). - Keep the structure clean and logical, with the independent variable placed in the leftmost column.
Common Mistakes
- Writing units next to every numerical entry in the body of the table instead of in the header.
- Omitting one of the plant types or failing to write the full time intervals up to .
Things to Be Careful About
- Check that the lines are drawn neatly with a ruler.
- Ensure time is represented in seconds () or minutes () consistently.
Answer
- All data cells in the table are completed with measured values.
- Foam height values for celery and potato increase over time, so that the value at is greater than at .
- Foam height values for apple are zero or close to zero.
Complete set of recorded experimental measurements with celery and potato showing increasing foam height over time, and apple near zero
Walkthrough
This is a hands-on practical task where candidates carry out the reaction and record their own measurements:
- Data completeness: Every cell in the drawn results table must contain a numerical value.
- Expected trends:
- Potato and celery tissues contain active catalase, producing oxygen gas when mixed with hydrogen peroxide. The foam layer increases in height over time, meaning the reading at must be greater than at .
- Apple tissue has very low or negligible catalase activity under these conditions, so its foam height should be recorded as (or close to zero).
Key Takeaways
- Catalase activity varies considerably among different plant tissues.
- Measurements should be recorded to a consistent degree of precision.
Common Mistakes
- Leaving table cells blank or recording non-numerical descriptions instead of heights.
- Fabricating impossible trends (such as foam height drastically decreasing without explanation).
Things to Be Careful About
- Measure from the boundary between the liquid and foam up to the top surface of the foam column.
Suggest why the three plant tissues were crushed before adding the hydrogen peroxide solution.
______
Answer
To break open the plant cells to release the catalase enzyme.
To break open the cells and release catalase
Walkthrough
Catalase is an intracellular enzyme found inside plant cells (specifically within peroxisomes/cytoplasm). Plant cells are enclosed by a rigid cellulose cell wall and cell membranes. Crushing the plant tissue ruptures the cell walls and membranes, allowing the intracellular catalase to be released into the aqueous suspension where it can come into direct contact with the hydrogen peroxide substrate.
Key Takeaways
- Intracellular enzymes require cell lysis or mechanical disruption of tissues to be extracted into solution.
Common Mistakes
- Giving vague answers such as "to make it smaller" or "to make it dissolve" without referring to breaking open cells or releasing the enzyme.
Things to Be Careful About
- Use the specific terms: break open cells or release catalase / enzyme.
Suggest why the plant suspensions were stirred before adding the hydrogen peroxide solution.
______
Answer
- To ensure the cells / catalase are evenly distributed throughout the suspension.
- To ensure maximum surface area for enzyme activity (or to ensure the surface area available is consistent for each test).
To evenly distribute the cells/catalase and provide maximum/consistent surface area for enzyme activity
Walkthrough
Suspensions are heterogeneous mixtures where insoluble cellular debris tends to settle at the bottom over time due to gravity.
- Even distribution: Stirring resuspends the settled cell material, ensuring that any sample taken has an equal concentration of cells and catalase.
- Contact and surface area: Dispersing the particles maximizes the surface area of cell fragments exposed to the hydrogen peroxide solution, ensuring consistent interaction between enzyme and substrate.
Key Takeaways
- Stirring a suspension prevents sedimentation and ensures representative sampling across repeated trials.
Common Mistakes
- Merely stating "to mix it" without explaining what is being mixed or why (e.g., failing to mention even distribution of cells/enzyme).
Things to Be Careful About
- Ensure both marking points are clearly stated: distribution of contents/enzyme, and maximizing/standardizing surface area for enzyme reaction.
Answer
Volume of plant tissue suspension (or volume of hydrogen peroxide solution / depth of suspension / diameter of test-tube).
Volume of plant tissue suspension
Walkthrough
In a valid scientific investigation, only the independent variable (the type of plant tissue) is altered. All other potential variables must be kept constant (controlled variables):
- Depth / volume of plant suspension added ( depth).
- Volume of hydrogen peroxide added ().
- Time intervals between measurements ( intervals up to ).
- Diameter/size of the test-tubes used.
Any one of these is acceptable.
Key Takeaways
- Controlled variables ensure that any difference in the dependent variable (foam height) is caused solely by the independent variable (tissue type).
Common Mistakes
- Stating the independent variable (type of plant) or dependent variable (foam height) instead of a controlled variable.
- Stating "amount" instead of the precise scientific term "volume".
Things to Be Careful About
- Use precise terms like "volume" rather than vague terms like "amount of liquid".
Suggest one reason why repeating the investigation would give you more confidence in your results.
______
Answer
To identify anomalous results (outliers) and make the results more reliable (or allow a mean to be calculated).
To identify anomalies and increase reliability
Walkthrough
Repeating an experiment multiple times under identical conditions allows the experimenter to:
- Check for consistency between trials.
- Spot and discard anomalous results (outliers) that deviate significantly from the general pattern.
- Calculate a mean value, which reduces the impact of random errors and increases the reliability of the conclusions.
Key Takeaways
- Repeating investigations increases reliability and allows identification of anomalies; it does not change the fundamental accuracy of the instruments used.
Common Mistakes
- Writing "to make it accurate" or "to avoid human error" (Cambridge mark schemes routinely reject or ignore vague references to "accuracy" and "human error").
Things to Be Careful About
- Use the specific terms: identify anomalies / outliers or increase reliability.
Answer
The top surface of the foam was uneven / not level (or bubbles kept popping, making the level change continuously / difficult to judge the boundary between liquid and foam).
The top of the foam layer was uneven and difficult to measure accurately
Walkthrough
When measuring gas bubbles forming foam in a test-tube, several practical difficulties arise:
- The upper surface of the foam layer is irregular, bumpy, and uneven rather than flat, making it difficult to decide where to position the ruler.
- Foam bubbles continuously burst or form rapidly during the reaction, changing the height while reading.
- Plant debris may cling to the sides of the tube, obscuring the boundary between the liquid suspension and the foam layer.
Key Takeaways
- Evaluating practical limitations requires pointing out specific physical observations rather than general mistakes.
Common Mistakes
- Vague answers like "it was hard to measure" without specifying what caused the difficulty.
- Stating personal error ("I forgot to look at the clock") rather than an inherent methodological difficulty.
Things to Be Careful About
- Focus on the physical nature of the foam: uneven top, fading/bursting bubbles, or unclear interface.
Another student used the same procedure using a celery cell suspension and hydrogen peroxide. Instead of using a test-tube, they used a measuring cylinder. They measured the total volume of the contents of the measuring cylinder every minute for 5 minutes.
These measurements are shown in Table 1.1. The student did not record the measurement at 4 minutes.
Table 1.1
| time / minutes | total volume of contents / |
|---|---|
| 0 | 4.0 |
| 1 | 11.0 |
| 2 | 16.0 |
| 3 | 19.5 |
| 5 | 20.5 |
Construct a graph of the data in Table 1.1 on the grid below.
Join your plotted points with ruled, straight lines.

Answer
Graph construction criteria:
- Axes: Time on the horizontal () axis labelled
time / minutes, and total volume on the vertical () axis labelledtotal volume of contents / cm^3. - Scales: Linear scales on both axes, with values starting from the origin , using at least half of the grid in both dimensions (e.g., -axis: ; -axis: or ).
- Plotting: All 5 points correctly plotted with small crosses ( or ) or encircled dots:
- Line: Points neatly joined point-to-point with ruled straight lines, with no extrapolation beyond .
Graph plotted with time on x-axis, volume on y-axis, all 5 points correctly plotted and connected with ruled straight lines
Walkthrough
To construct a full-marks graph for Cambridge O Level Biology:
- Orientation and labels: The independent variable (
time / minutes) goes on the -axis. The dependent variable (total volume of contents / cm^3) goes on the -axis. Both labels must include their units using slash notation. - Scale selection: The grid has large squares (each large square contains small squares, so small squares total).
- For the -axis (0 to 5 minutes): Scale of uses 5 large squares ( of the grid width).
- For the -axis (0 to 20.5 ): Scale of or (giving 25 at 5 large squares) uses of the grid height.
- Plotting points:
Mark each point with a crisp or a dot inside a small circle.
- Joining lines: The question specifically instructs: "Join your plotted points with ruled, straight lines." Use a clear ruler to connect consecutive points. Do not draw a line of best fit or smooth curve here, and do not extrapolate beyond .
Key Takeaways
- Always follow the explicit instruction regarding the line style (ruled straight lines vs smooth curve).
- Never extrapolate a graph line past the first or last plotted point unless explicitly requested.
Common Mistakes
- Inverting the axes (putting volume on and time on ).
- Plotting a smooth freehand curve when the question explicitly demands ruled, straight lines.
- Extrapolating the line beyond or before .
Things to Be Careful About
- Scales must be strictly linear (regular numerical increments per major division).
- Ensure is plotted on the -axis at , not at the origin .
Use your graph to estimate the total volume of the contents of the measuring cylinder at 4 minutes.
Show your working on your graph.
total volume at 4 minutes = ______
Working
Draw a vertical construction line up from on the -axis to intersect the straight line joining and .
From this point of intersection, draw a horizontal construction line across to the -axis.
Since the line connects and with a straight line, the midpoint at is:
Answer
20.0 cm^3
Walkthrough
- Linear interpolation: The straight line between and represents the rate across that 2-minute interval. At the midpoint (), the volume is exactly the midpoint between and , which is .
- Showing working: Clearly draw dashed or solid construction lines on the graph (a vertical line from to the line, and a horizontal line from the intersection to the -axis).
- Unit: State the correct unit, .
Key Takeaways
- When asked to "Show your working on your graph", construction lines on the grid are mandatory to gain full marks.
Common Mistakes
- Forgetting to draw construction lines on the graph grid.
- Omitting the unit in the final answer.
Things to Be Careful About
- Ensure the read-off precisely matches the intersection on your drawn graph.
Answer
- Description: Total volume of contents increases over time, but the rate of increase slows down (the gradient decreases / levels off).
- Explanation: The substrate (hydrogen peroxide) is being used up / broken down, so there are fewer substrate molecules to bind with catalase active sites, until the reaction stops.
Volume increases over time but the rate decreases/levels off because hydrogen peroxide (substrate) is used up
Walkthrough
This question requires two distinct parts: a description of the graph shape and a biological explanation of why that shape occurs.
-
Describe the shape (2 marking points):
- Overall trend: The total volume increases with time.
- Rate change: The reaction is fastest initially (steepest gradient from 0 to 1 minute), then the rate decreases / slows down (gradient becomes less steep between 1 and 3 minutes), eventually levelling off / plateauing towards 5 minutes.
-
Explain the shape (1 marking point):
- At the start, there is a high concentration of substrate (), leading to frequent successful collisions between substrate and active sites of catalase.
- As the reaction proceeds, hydrogen peroxide is progressively broken down into water and oxygen gas. Substrate concentration decreases (becomes limiting), resulting in fewer collisions per unit time and a slower rate of oxygen production.
- Eventually, almost all substrate is exhausted, so no more oxygen gas is produced and the volume reaches a plateau.
Key Takeaways
- In enzyme reaction progress curves, the decreasing slope over time is caused by substrate depletion, not enzyme denaturation (unless high heat was applied).
Common Mistakes
- Claiming the enzyme is "denatured" or "dies" over time (at room temperature, enzymes are not denatured; the reaction simply slows because substrate runs out).
- Giving only a description without explaining why the rate decreases.
Things to Be Careful About
- Address both parts of the command: describe the gradient/volume change and explain using substrate consumption.
Fig. 2.1 is a photomicrograph of a section of a celery plant.
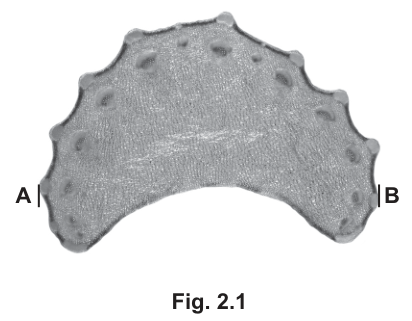
In the space below, make a large drawing of the plant section as it appears in the photomicrograph.
Answer
Make a large drawing of the celery petiole transverse section as shown in Fig. 2.1, following these conventions:
- Draw in clear, clean, continuous single lines using a sharp pencil. Do not use any shading, stippling, cross-hatching or ruled lines.
- Ensure the overall width of the drawing at the line A–B is at least 90 mm.
- Reproduce the shape: a concave (curved inwards) bottom outer edge and a scalloped (wavy with bumps) upper edge.
- Draw the ridges on the upper edge using a double line, and clearly delimit the small ‘bumps’ (collenchyma) along this upper edge.
- Draw the vascular bundles (the small dark oval/circular structures) scattered within the section.
Large labelled drawing of the celery petiole section meeting size and convention requirements
Walkthrough
This part asks for a biological drawing from a photomicrograph. In Paper 3, the examiner marks the drawing on conventions and structural accuracy rather than just what is drawn.
- Line quality: The outline must be drawn with a sharp pencil in one continuous, clean stroke. Shading or cross-hatching is strictly rejected because it obscures structural detail.
- Size: The mark scheme requires a minimum width of 90 mm at the line A–B. This ensures the drawing is large enough to show detail and is measured against the candidate's own work.
- Shape: The celery petiole section is not a perfect circle. The bottom edge curves inwards (concave), while the top edge is wavy or scalloped.
- Structural detail: The upper scalloped edge has ridges. These must be drawn with a double line to represent the thickened cell walls (collenchyma), and the individual bumps must be clearly delimited. The vascular bundles, visible as small dark ovals in the photomicrograph, must also be drawn.
Key Takeaways
- Biological drawings on the Practical Test reward precision and adherence to conventions over artistic skill.
- Minimum size requirements (e.g., 90 mm) are mandatory and checked with a ruler.
- Specific structures like collenchyma ridges require double lines to show wall thickness.
Common Mistakes
- Shading or stippling: Candidates often shade the vascular bundles or the background to make them stand out. This is always rejected.
- Ruled lines: Using a ruler to draw the outline or internal structures is incorrect; freehand continuous lines are required.
- Ignoring the double line: Drawing the upper ridges with a single line loses the mark for structural detail.
- Wrong size: A drawing that is too small (under 90 mm wide) loses the size mark immediately.
Things to Be Careful About
- Precision: Measure your drawing width with a ruler to ensure it is at least 90 mm. If it is 89 mm, you lose the mark.
- Double lines: The mark scheme explicitly asks for a double line on the scalloped upper edge to represent the collenchyma. Do not use a single thick line.
- Vascular bundles: Ensure these are drawn as distinct structures within the section, not just left as blank space.
- Label lines: Although not explicitly scored in this specific mark entry, label lines should be drawn with a ruler from outside the drawing to the structures, without arrowheads or touching the structure.
Draw a straight line to join A and B on Fig. 2.1. This is the length of the plant section in the photomicrograph. Measure and record this length.
length A–B = ______
Answer
Using a ruler, measure the distance between points A and B on the printed photomicrograph (Fig. 2.1).
length A–B = 59–61
59–61
Walkthrough
The candidate is asked to measure the width of the celery section on the printed photomicrograph between the labelled points A and B. This is a direct reading from the exam paper.
- Place a ruler along the line joining A and B.
- Read the measurement to the nearest millimetre.
- The mark scheme accepts any value between 59 mm and 61 mm. This range accounts for minor parallax errors or slight variations in how the paper was printed or scaled.
Key Takeaways
- Measurements from printed diagrams are checked against an accepted range rather than a single exact value.
- Always measure to the precision required by the question (here, to the nearest mm).
Common Mistakes
- Reading the wrong axis or line: Ensure the measurement is strictly between the vertical marks at A and B, not the outer edges of the entire image.
- Wrong precision: Recording 59.5 mm when the question implies mm precision, or failing to record the unit.
Things to Be Careful About
- Accepted range: The mark scheme gives 59–61 mm. Any value in this range scores 1 mark. If you measure 58 mm or 62 mm, you will lose the mark.
- Unit: The question already provides the unit () in the answer line, so you only need to write the number.
On your drawing, draw a straight line in the same position as the line A–B you have drawn on the photomicrograph. Measure and record the length of this line.
length of line on drawing = ______
Answer
On your drawing from part (a), draw a straight horizontal line in the exact same position as the A–B line on the photomicrograph (across the widest part of the section).
Measure this line with a ruler and record the value.
length of line on drawing = [your measured value in ]
Candidate's own measurement
Walkthrough
This part tests whether the candidate has maintained the correct scale in their drawing from part (a).
- Replicate the A–B line from the photomicrograph onto your own drawing, ensuring it is in the same relative position (across the widest point of the crescent).
- Measure this new line with a ruler.
- Record the value in mm. This value will be used in part (b)(iii) to calculate magnification.
Key Takeaways
- The line on the drawing must correspond exactly to the line on the specimen.
- This measurement is the 'image size' in the magnification formula.
Common Mistakes
- Drawing the line in the wrong position: If the line is not across the widest part or not horizontal, the measurement is invalid.
- Not measuring: Forgetting to actually measure the line and leaving the answer blank.
Things to Be Careful About
- Consistency: The value you record here must be the exact value you use in part (b)(iii). If you measure 120 mm here but use 115 mm in the calculation, you will lose marks for error carried forward or incorrect working.
- Precision: Record to the nearest mm, consistent with part (b)(i).
Use your measurements in (b)(i) and (b)(ii) to calculate the magnification of your drawing compared to the photomicrograph. Record your answer to 2 decimal places.
Show your working.
magnification ______
Working
Substitute your measurements from (b)(i) and (b)(ii):
Calculate the value and round to 2 decimal places.
Answer
magnification [calculated value to 2 d.p.]
See working
Walkthrough
The candidate must calculate the magnification of their drawing relative to the photomicrograph. This is a standard application of the magnification equation.
- Recall the formula: Magnification = Image size / Actual size. In this context, Image size is the length of the line on your drawing, and Actual size is the length of the line on the photomicrograph.
- Substitute values: Use the value you recorded in (b)(ii) as the numerator and the value from (b)(i) as the denominator. Note that the units () cancel out, so magnification is a dimensionless number.
- Calculate and round: Perform the division and round the final answer to exactly 2 decimal places as required by the question.
The mark scheme awards 1 mark for correctly carrying forward the answer from (b)(ii), 1 mark for the correct magnification calculation (which can include error carried forward from an incorrect measurement in (b)(ii) or (b)(i)), and 1 mark for the answer being to 2 decimal places.
Key Takeaways
- Magnification is a ratio and has no units.
- Error carried forward (ecf) is awarded if the formula is applied correctly to an incorrect measurement from a previous part.
- Rounding must be exact to the number of decimal places specified.
Common Mistakes
- Inverting the formula: Calculating Actual size / Image size instead of Image size / Actual size. This gives a number less than 1, which is incorrect for a drawing that is larger than the specimen.
- Wrong rounding: Rounding to 1 decimal place or rounding the intermediate calculation instead of the final answer.
- Forgetting ecf: If a candidate measures 120 mm in (b)(ii) but writes 110 mm in the calculation, they lose the calculation mark but may still get the 'correct magnification' mark if they use 120 mm.
Things to Be Careful About
- 2 decimal places: The question explicitly asks for 2 d.p. An answer like 2.0 or 2 is incorrect; it must be written as 2.00.
- Units in calculation: Do not include in the final magnification value. Magnification is just a number (e.g., ).
- Scissors/Calculator errors: Ensure your calculator is set to the correct mode and you are dividing the correct numbers. The mark scheme accepts the ecf value, so show your working clearly.
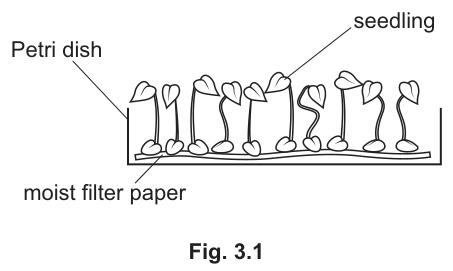
Plan an investigation to find out the effect of varying light intensity on the increase in height of mustard plant seedlings provided in Petri dishes, as shown in Fig. 3.1.
Answer
- Use at least three different light intensities.
- Vary the light intensity by changing the distance of the lamp from the Petri dishes (or use a dimmer switch / different bulbs / a heat shield).
- Position the light source directly above the dishes only (e.g., in a dark room with no other light).
- Measure the seedlings at the same time each day (or at regular time intervals).
- Keep control variables constant, such as the temperature and the volume of water on the filter paper.
- Measure and record the starting and final heights (lengths) of the seedlings, then calculate the mean increase in height for each light intensity.
See working
Walkthrough
- Identify the variables: The independent variable is light intensity, and the dependent variable is the increase in height of the mustard seedlings. The investigation must clearly address both.
- Manipulate the independent variable: The scheme requires at least three different light intensities. A candidate must specify how this is achieved, such as placing dishes at different distances from a lamp, using different wattage bulbs, or using a dimmer switch. Simply stating 'vary the light' is insufficient.
- Control the setup: Light must come from above only to ensure uniform exposure. Using a dark room with only the lamp as a light source prevents ambient light from interfering. A heat shield is important because lamps (especially incandescent ones) emit heat, which would alter the temperature—a controlled variable.
- Control other variables: Growth is affected by factors other than light. The candidate must name at least one or two control variables, such as the volume of water on the filter paper, the temperature of the room, or the type/number of seeds. The volume of water is particularly relevant here because the seedlings are on moist filter paper in a Petri dish.
- Measure the dependent variable: The candidate must state that both the starting height and the final height are measured and recorded. Measuring only the final height does not give the 'increase in height'.
- Process the data: Finally, the method must include calculating the mean change (increase) in height per light intensity or per dish to provide a reliable, comparable result.
Key Takeaways
- A 6-mark planning question requires a structured method covering the independent variable, its manipulation, controlled variables, measurement of the dependent variable, and data processing (mean).
- When varying light intensity, it is crucial to control for heat (using a heat shield) and ensure light only comes from the intended source (dark room, light from above) to avoid confounding variables.
- Always measure the change in a variable by recording both the initial and final values, not just the final value.
Common Mistakes
- Vague manipulation: Saying 'change the light intensity' without explaining how (e.g., changing distance or using different bulbs).
- Insufficient levels: Failing to state that at least three different light intensities must be used. Two levels are not enough to show a trend.
- Omitting the starting measurement: Only measuring the final height does not answer the question, which asks for the 'increase in height'.
- Ignoring heat from the lamp: Forgetting that a lamp produces heat, which would change the temperature and act as an uncontrolled variable. Suggesting a heat shield or keeping the lamp at a safe distance is a strong AVP.
- Vague controls: Stating 'keep everything the same' without naming specific variables (e.g., temperature, water volume, time of measurement).
Things to Be Careful About
- Precision in planning: Use clear, actionable language (e.g., 'measure at the same time each day' rather than 'measure regularly').
- Number of points: The scheme lists 8 potential points for a maximum of 6 marks. Provide exactly 6 clear, distinct points to secure full marks.
- Context of the apparatus: The seedlings are in a Petri dish on moist filter paper. This means the volume of water on the paper is a critical control variable that must be kept constant (e.g., by re-moistening to the same weight or volume each day).
- AVP consideration: Points like 'use a dark room' or 'use a heat shield' are alternative valid points (AVP) that show a deep understanding of experimental design and can secure marks if other points are weak.