Biology 5090/42 — October/November 2024
Cambridge O-Level · Alternative to Practical · worked solutions for every part, with the mark scheme
Topics Experimental Contexts · Use of Techniques, Apparatus and Materials · Observations and Measurements · Planning Experiments and Investigations · Analysis, Conclusions and Evaluation · Microscopy and Biological Drawing
Carbohydrates are found in different plant organs in the form of starch and sugars (such as glucose and maltose).
A student decided to test two different plant organs (a potato and an apple) for the presence of starch and sugar.
Suggest a suitable reagent for the test for starch and describe how it should be used.
Details of possible results are not required.
______
Answer
Cut or crush a sample of the plant organ, then add iodine solution to it.
Cut/crush the sample; add iodine (solution).
Walkthrough
The starch test uses iodine solution. The mark scheme wants two points: first, that the sample is cut or crushed so the reagent can reach the starch inside the tissue, and second, that the reagent is iodine solution. Details of the colour result are explicitly not required here, so do not waste time describing blue-black.
Key Takeaways
- Iodine solution is the reagent for starch.
- The sample must be cut or crushed to expose the inside of the tissue to the reagent.
Common Mistakes
- Naming Benedict's solution — that tests for reducing sugars, not starch.
- Writing only 'add iodine' without any preparation of the sample; the cut/crush point is a separate mark.
- Describing the colour change when the question says results are not required.
Things to Be Careful About
- Each semicolon in the mark scheme is one mark: 'cut / crush sample ; iodine (solution) ;'. Give both points.
- 'Iodine' alone scores; 'iodine solution' reads better.
The student carried out the test for starch on pieces of the potato and the apple. Fig. 1.1 shows the appearance of the plant pieces before the test and after the test.
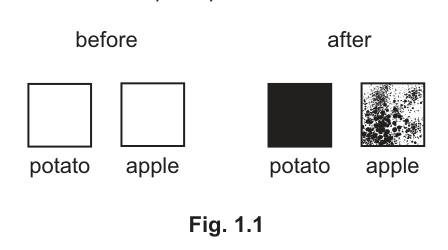
Record in Table 1.1 what you observe in Fig. 1.1 after the test and what you can conclude.
Table 1.1
| plant organ | observation | conclusion |
|---|---|---|
| apple | ||
| potato |
Answer
| plant organ | observation | conclusion |
|---|---|---|
| apple | partially black / slightly black (less black than potato) | some starch present, but less starch than potato |
| potato | completely black | starch present / large amount of starch |
Apple: partially black — some starch, less than potato. Potato: fully black — starch present.
Walkthrough
Fig. 1.1 shows the potato piece turned solid black after the iodine test, while the apple piece shows only scattered dark speckles. Iodine turns blue-black where starch is present, so the potato contains starch throughout its tissue, and the apple contains only a small amount. The mark scheme insists on comparison: the observation for the apple must say it is less/partially black, and the conclusion must compare ('less starch than potato'). Without the comparison you lose marks even if your words are otherwise correct.
Key Takeaways
- Iodine turning blue-black indicates starch; the intensity/extent of blackening relates to how much starch is present.
- Observations describe what is seen; conclusions state what it means biologically.
- Comparative questions need explicit comparisons in both columns.
Common Mistakes
- Writing 'apple has no starch' — the speckling shows some starch is present.
- Giving identical wording for both organs with no comparison; the scheme caps the conclusion at 1 mark if no comparison is made.
- Confusing observation and conclusion columns — 'starch present' is not an observation.
Things to Be Careful About
- The mark scheme note: 'comparison must be implied in observation and conclusion to access full marks; max 1 for conclusion if no comparison in the conclusion.'
- Accepted observations for apple: partially black, slightly black, or similar wording (AW).
The student then carried out a test for sugar on the potato and the apple, using Benedict's solution and following these instructions:
- Cut a cube of potato.
- On a white tile, use a cutting device to cut the cube into small pieces, and place these in a large test-tube.
- Add of distilled water, and use a stirring rod to gently crush the pieces and mix them with the water.
- Clean your tile, cutting device and stirring rod.
Repeat this procedure with the apple.
- Add of Benedict's solution to both test-tubes. The contents of both test-tubes will be blue.
- Heat the two test-tubes for ten minutes at a temperature between and .
Describe how you would keep the test-tubes at the required temperature for ten minutes.
______
Answer
Place the test-tubes in a water-bath heated to between and , and use a thermometer to check that the water stays within this range for ten minutes.
Use a water-bath at 75–85 °C with a thermometer to check/maintain the temperature.
Walkthrough
Test-tubes containing sugar solutions are never heated directly over a flame because they can boil over or crack; instead they stand in a beaker of hot water — a water-bath — which heats them indirectly and evenly. To keep the temperature in the required 75–85 °C band for ten minutes you must monitor it, which means a thermometer in the water (or a thermostat/electronic water-bath that controls it automatically). A thermostatically controlled water-bath alone earns both marks.
Key Takeaways
- Benedict's test requires heating, done safely via a water-bath.
- Temperature must be checked (thermometer) or controlled (thermostat).
Common Mistakes
- Saying 'heat with a Bunsen burner' — direct heating is unsafe and does not hold a steady temperature.
- Mentioning a water-bath but omitting any way of knowing the temperature — that loses the second mark.
Things to Be Careful About
- Mark scheme notes: thermostatically controlled water-bath = 2 marks; electronic water-bath = 1 mark. A plain water-bath plus thermometer = 2 marks.
After ten minutes, the student observed the test-tubes. The colour of the apple mixture was red, and the colour of the potato mixture was blue.
State what conclusions can be made from these results.
apple ______
potato ______
Answer
Apple: reducing sugar present.
potato: no reducing sugar present.
apple: sugar present; potato: no sugar present
Walkthrough
Benedict's solution starts blue. On heating with a reducing sugar it changes through green, yellow and orange to brick-red; the deeper the colour, the more sugar. Red therefore means the apple mixture contained reducing sugar. Staying blue means no reducing sugar was present in the potato mixture. Both conclusions are needed for the single mark — the '+' in the mark scheme joins them.
Key Takeaways
- Blue after heating with Benedict's = no reducing sugar; red/orange = reducing sugar present.
Common Mistakes
- Concluding only about the apple and forgetting the potato — both halves are required for the one mark.
- Saying 'glucose present' specifically — the test detects reducing sugars generally.
Things to Be Careful About
- The '+' in the mark scheme means both statements are needed for this one mark.
Suggest why it was important to:
- use a cube for each plant organ
______
- cut each cube up into small pieces
______
- crush the small pieces and mix them with water.
______
Answer
- Using the same size cube for each organ makes the results comparable (same amount of tissue tested).
- Cutting into small pieces increases the surface area and breaks open cells, releasing the sugars.
- Crushing and mixing with water releases/dissolves the sugars into solution so they can react with Benedict's solution.
Same cube size → comparable results; small pieces → greater surface area/breaks open cells; crushing in water → sugars released into solution.
Walkthrough
Each instruction serves a different purpose. The equal-sized cubes are a controlled variable: if you tested a large piece of apple against a tiny piece of potato, any difference in colour could be due to quantity of tissue rather than sugar content, so equal volumes make the comparison fair. Cutting into small pieces increases surface area and physically breaks open cell walls and membranes, letting the sugars escape. Crushing under water then washes those sugars out so they dissolve — Benedict's solution can only react with sugars dissolved in the liquid around the pieces, not with sugar locked inside intact cells.
Key Takeaways
- Fair testing: keep the quantity of material the same across samples.
- Surface area and cell disruption increase the rate and extent of extraction.
- Food-test reagents react with substances in solution, so the substance must be extracted into water first.
Common Mistakes
- Giving the same reason three times (e.g. 'to release sugar' for all three blanks) — each blank needs its own distinct reason.
- Saying 'to make it accurate' without naming what is being compared or released.
Things to Be Careful About
- Match each reason to the right bullet: comparability, surface area/cell breakage, sugars into solution.
Explain why the tile, cutting device and stirring rod were cleaned after using them on the potato.
______
Answer
To prevent transfer of potato (starch/sugar) onto the apple sample, i.e. to prevent cross-contamination.
To prevent cross-contamination of the apple sample with potato/starch/sugar.
Walkthrough
Any potato residue left on the tile, cutting device or stirring rod would be carried into the apple test-tube. That could give a false positive — the apple might appear to contain starch or sugar that actually came from the potato. Cleaning prevents this cross-contamination and keeps each result valid for its own sample.
Key Takeaways
- Apparatus shared between samples must be cleaned to avoid cross-contamination and false results.
Common Mistakes
- Vague answers such as 'to keep it clean' or 'for hygiene' — name what would be transferred and what effect it would have.
Things to Be Careful About
- The mark scheme accepts transfer of potato, starch or sugar; the key idea is preventing contamination of the next sample.
Describe how you would test the apple for protein, and state what you would observe if protein was present and not present.
test ______
protein present ______
protein not present ______
Answer
test: Cut/crush a sample of apple, add biuret reagent to it.
protein present: the solution turns mauve/purple/lilac/violet.
protein not present: the solution remains blue.
Crush apple + add biuret reagent; protein present = purple/mauve/lilac/violet; protein absent = remains blue
Walkthrough
The protein food test uses biuret reagent. As with the other tests, the sample should first be cut or crushed so the reagent can contact the contents of the cells. Biuret reagent is itself pale blue; if protein is present it turns purple (mauve, lilac or violet are all accepted), because the copper ions in the reagent form a coloured complex with the peptide bonds in protein. If there is no protein, nothing reacts and the mixture simply stays blue. Note the parallel with Benedict's: blue is the negative result here too, but for a different reagent and reason.
Key Takeaways
- Biuret reagent tests for protein: blue → purple is positive; staying blue is negative.
- Always prepare the sample (cut/crush) before adding the reagent.
Common Mistakes
- Confusing reagents: iodine is for starch, Benedict's for reducing sugars, biuret for protein.
- Giving only the positive result and forgetting the negative — the question asks for both.
- Writing 'blue to purple' as the positive result without realising the starting colour is the reagent's own blue.
Things to Be Careful About
- Four separate marks: preparing the sample, naming biuret reagent, the positive colour, the negative colour. Give all four.
- Any of mauve/purple/lilac/violet scores for the positive result.
Photosynthesis in green plants can be summarised by the equation:
A student used the apparatus shown in Fig. 2.1 to investigate the rate of photosynthesis in an aquatic plant.
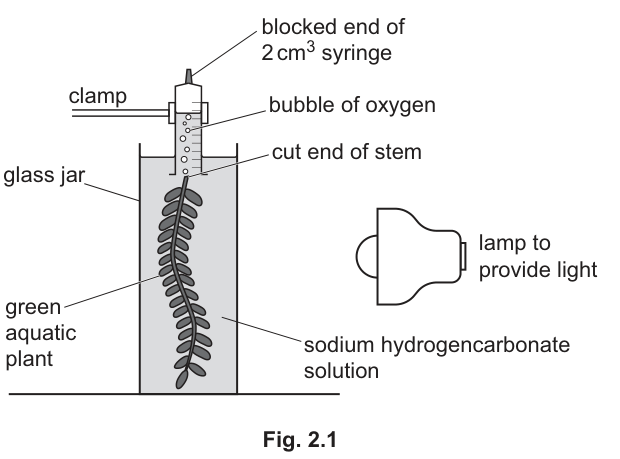
When the student switched the lamp on, bubbles of oxygen formed and entered the syringe. The student recorded the volume of oxygen produced in ten minutes. The syringe was then refilled with sodium hydrogencarbonate solution and the oxygen collected for another ten minutes.
The student then decided to investigate the effect of different colours of light on the rate of photosynthesis. Leaving the same plant in the glass jar, a red transparent filter was wrapped around the glass jar so that the plant only received red light. The volume of oxygen produced in ten minutes was measured. This measurement was then repeated.
The red transparent filter was replaced by a green transparent filter and then by a blue transparent filter. For each filter, the volume of oxygen produced in ten minutes was also measured twice.
The measurements are shown in Table 2.1.
Table 2.1
| filter | volume of gas collected in ten minutes / measurement 1 | volume of gas collected in ten minutes / measurement 2 | volume of gas collected in ten minutes / mean |
|---|---|---|---|
| no filter | 1.1 | 1.3 | 1.2 |
| red | 0.7 | 0.9 | 0.8 |
| green | 0.3 | 0.3 | 0.3 |
| blue | 0.6 |
The syringe at the end of ten minutes for measurement 2 with the blue filter is shown in Fig. 2.2.
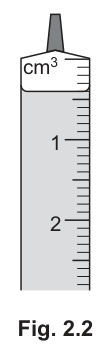
Record the volume of oxygen produced in measurement 2 with the blue filter in Table 2.1.
Answer
0.4
0.4
Walkthrough
The student measures the volume of oxygen collected in the syringe. In Fig. 2.2, the syringe is shown with its scale. The liquid level is at the mark, but because the syringe is inverted and the gas bubble is at the blocked top end, the volume of gas collected is read as the space from the zero mark at the top down to the liquid level. The mark scheme accepts as the volume of oxygen produced in this measurement. Record this value in the table.
Key Takeaways
When reading gas volume from an inverted syringe or measuring cylinder, ensure you are reading the volume of the gas space, not the liquid level, and align your eye with the meniscus.
Common Mistakes
Reading the liquid level () as the volume of gas instead of the gas volume (). Failing to record the value to the correct number of decimal places (one decimal place, matching the other entries in the table).
Things to Be Careful About
The mark scheme requires exactly . Ensure the value is recorded in the correct column of Table 2.1. Units are already provided in the table header, so only the number is needed.
Calculate the mean volume of oxygen produced with the blue filter, and record it in Table 2.1.
Answer
0.5
0.5
Walkthrough
The mean is calculated by adding the two measurements and dividing by two:
Record in the mean column for the blue filter row.
Key Takeaways
A mean smooths out random errors in repeated measurements. Always show the calculation or at least the final value to the appropriate number of decimal places as given in the data.
Common Mistakes
Forgetting to add the two measurements before dividing. Carrying forward an error from part (a)(i) is allowed (ecf), so if a student read instead of , they would still get the mark for the mean calculation if they correctly averaged and to get (though the scheme expects based on the correct reading).
Things to Be Careful About
The mean should be given to one decimal place to match the precision of the raw data ( and ). Record it in the correct cell of the table.
Using the mean value, calculate the rate of photosynthesis per minute when no filter was used.
______
Working
Answer
0.12
0.12 cm^3/min
Walkthrough
The question asks for the rate of photosynthesis per minute when no filter was used. From Table 2.1, the mean volume of gas collected with no filter is in minutes.
Key Takeaways
Rate is always change in quantity divided by change in time. Ensure the units match what the question asks for (per minute, not per ten minutes).
Common Mistakes
Forgetting to divide by the time and just writing . Using the wrong mean value (e.g., using the blue filter mean). Not including the correct units ( or ).
Things to Be Careful About
The mark scheme accepts or . Write the final answer clearly with units if not provided in the answer line. The answer line has a blank, so just the number and units are needed.
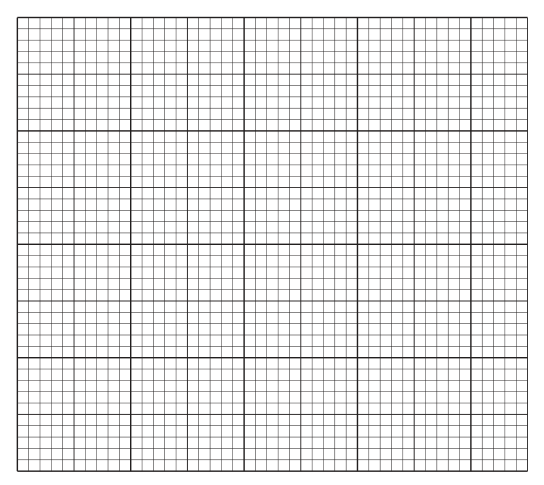
Construct a bar chart on the grid to show the mean volume of gas collected with no filter and with the different coloured filters.
Answer
See diagram
Walkthrough
A bar chart is used to display categorical data (types of light filter) against a numerical variable (volume of gas). The x-axis represents the independent variable (filter type: no filter, red, green, blue). The y-axis represents the dependent variable (mean volume of gas collected / ).
- Axes: Draw the x-axis and y-axis. Label the x-axis "filter" or "colour of light". Label the y-axis "mean volume of gas / " or "volume of oxygen / ".
- Scale: Choose a linear scale for the y-axis that uses at least half the grid in both directions. The maximum value is , so a scale from to or to with or intervals is appropriate. Ensure the scale starts at .
- Bars: Draw four bars of equal width, equally spaced, and not touching. The heights should correspond to the mean values: (no filter), (red), (green), (blue). Label the bars centrally with the filter type if not on the axis.
Key Takeaways
Bar charts must have fully labelled axes with units, a linear scale starting at zero, and bars that do not touch. The bars represent discrete categories.
Common Mistakes
Using a continuous line graph instead of bars. Forgetting to label the axes with units. Starting the y-axis scale at a value other than . Making bars touch each other. Not using at least half the grid.
Things to Be Careful About
The mark scheme awards marks for: axes fully labelled + bars labelled centrally; linear scale for volume + value at origin + at least half of grid used; mean values plotted correctly; all bars ruled and of equal width + equal spacing + bars not touching. Ensure the bars are drawn with a sharp pencil and ruled lines only, no shading.
Use the data given and the bar chart to state one conclusion that can be made from the results of this investigation.
______
Answer
Green light results in the lowest rate of photosynthesis; or: different colours of light cause different rates of photosynthesis; or: no filter (white/normal light) results in the highest rate of photosynthesis.
Green light gives the lowest rate of photosynthesis.
Walkthrough
Look at the mean volumes: no filter (), red (), green (), blue (). The volume of oxygen is an indicator of the rate of photosynthesis. Green light gives the smallest volume, so it supports the lowest rate. Alternatively, the rates are all different, so colour affects the rate. No filter (white light) gives the highest volume.
Key Takeaways
A conclusion must directly answer the aim of the investigation using the data. State a relationship or comparison supported by the numbers.
Common Mistakes
Saying 'green light is bad for plants' (too vague). Forgetting to mention 'rate' or 'photosynthesis'. Stating a trend without referring to the specific data (e.g., 'light affects photosynthesis' is too generic; 'green light gives the lowest rate' is specific and scored).
Things to Be Careful About
Any one valid conclusion from the data is accepted. The mark scheme gives examples: 'green light least photosynthesis', 'different colours caused different rates', 'no filter most photosynthesis'. Ensure the conclusion is justified by the data shown.
Plan an investigation that you could do to determine the effect of light intensity on the rate of photosynthesis, using the apparatus shown in Fig. 2.1.
Answer
- Use at least three different light intensities (e.g., place the lamp at distances of 10 cm, 20 cm, and 30 cm from the jar).
- Keep the same plant (or same species and size of plant) in the jar.
- Keep the temperature constant (e.g., use a water bath or keep the room temperature stable) and use the same concentration of sodium hydrogencarbonate solution.
- Refill the syringe with sodium hydrogencarbonate solution (or reset the syringe to zero) before each measurement at a new light intensity.
- Allow time for the plant to adjust (equilibrate) to the new light intensity before taking readings.
- Measure the volume of oxygen produced in the syringe over a fixed length of time (e.g., 10 minutes) for each light intensity.
- Repeat the measurements and calculate a mean for each light intensity.
See working
Walkthrough
The aim is to investigate the effect of light intensity on the rate of photosynthesis. The independent variable is light intensity, which can be changed by varying the distance of the lamp from the apparatus. The dependent variable is the rate of photosynthesis, measured by the volume of oxygen collected in a set time.
To ensure a fair test, control variables must be kept constant: the plant (same species, size, health), temperature (use a heat shield or water bath, as lamps produce heat), concentration of carbon dioxide source (sodium hydrogencarbonate solution), and time of measurement.
The method should specify at least three different light intensities (e.g., three different distances). For each intensity, allow the plant to equilibrate, refill the syringe to reset the volume, and measure the gas produced over a fixed time. Repeat to get a mean.
Key Takeaways
A good experimental plan identifies the independent and dependent variables, lists at least three values for the independent variable, controls all other variables, and describes how measurements will be taken and repeated.
Common Mistakes
Forgetting to control temperature (a major confounding variable when using lamps). Not specifying how light intensity is changed (e.g., just saying 'change the light' is not enough; say 'change the distance'). Forgetting to repeat the experiment or calculate a mean. Not mentioning refilling the syringe or allowing time to equilibrate.
Things to Be Careful About
The mark scheme awards marks for: at least three different light intensities; method for achieving them (distance/bulb/dimmer); same plant; same temperature/same concentration; syringe refilled for each; allow time to adjust; measure volume for same time. Any six of these score 6 marks. Ensure the method is clear and logical.
Fig. 3.1 shows photographs of a male and a female of an insect species. Both the male and female insects are green in colour.
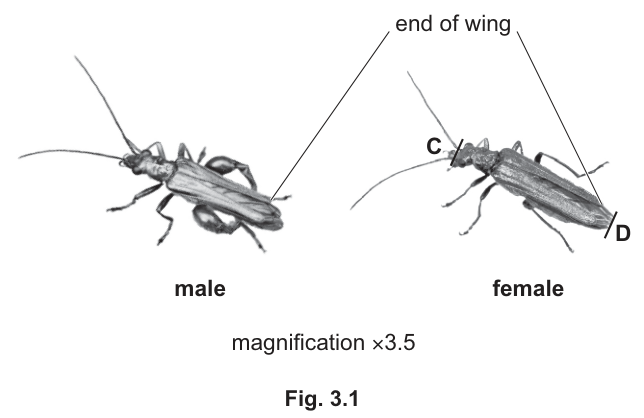
Answer
The male has thicker / swollen hind femora (back legs) than the female.
The male has thicker / swollen hind legs (femora) than the female.
Walkthrough
Look at the two photographs side by side and find a feature that clearly differs. The most obvious is the hind legs: in the male the thighs (hind femora) are noticeably thick and swollen, while in the female they are slender. The abdomen also differs — the female's abdomen is longer and wider, extending beyond the wings, whereas the male's is shorter and more slender.
Whichever feature you choose, the mark scheme insists the statement be comparative — you must say which insect has the bigger/thicker/longer version of the feature, not just name the feature. 'The male has swollen back legs' scores; 'the male has back legs' does not.
Key Takeaways
- When comparing two specimens, always state the direction of the difference ('larger than', 'shorter than'), not just the feature itself.
- Sexual dimorphism (males and females of one species looking different) is often shown in leg or abdomen shape in insects.
Common Mistakes
- Writing a non-comparative answer such as 'the male has swollen femora' without saying the female's are not — the mark scheme states 'answers must be comparative'.
- Naming a colour difference: both insects are green, so colour cannot be used here.
- Describing a feature that is actually the same in both insects.
Things to Be Careful About
- Give only ONE difference — extra incorrect statements can lose the mark.
- Use the correct term 'femora' or say 'thighs / upper part of the back legs' if unsure of the technical word.
In the space below, make a large drawing of the male insect as it appears in Fig. 3.1.
Answer
A large drawing of the male insect from Fig. 3.1:
Large pencil drawing of the male insect, at least 75 mm long, drawn with clear continuous lines, no shading, six legs with double lines to at least the first joint, swollen hind femora, two antennae and two separate wing cases shorter than the abdomen.
Walkthrough
This is a biological drawing task worth 4 marks, and the marks are awarded for conventions as much as for content:
-
Line quality (part of mark 1): draw with a sharp pencil using clear, continuous single lines. Never use shading, stippling (dots) or cross-hatching — these are explicitly penalised in biological drawing. Draw the insect in the same orientation as the photograph (head to the left, as printed).
-
Size (mark 2): the drawing must be at least long measured from the tip of the head to the tip of the abdomen. That is roughly three-quarters of the width of an A4 page, so draw BIG. Measure your drawing before you finish.
-
Legs (mark 3): all six legs must be shown, each drawn with a double line at least as far as the first joint. The hind femora (the thick thighs) must be drawn swollen, because that is the distinguishing feature of this male.
-
Head and wings (mark 4): two antennae attached to the head, and two wing cases that are clearly separate from each other and visibly shorter than the abdomen — matching what the photograph shows.
Draw only what you can see, in the correct proportions. Do not add labels unless asked — this question asks for the drawing only.
Key Takeaways
- Biological drawings are judged on technique: continuous lines, no shading, large size, correct proportions.
- Legs, tubes and walls are drawn with double lines.
- Always check whether a minimum size is stated and measure your drawing against it.
Common Mistakes
- Shading or stippling to show the dark body — always rejected.
- Drawing too small; below loses the size mark outright.
- Drawing legs as single lines, or omitting one of the six legs.
- Drawing the wing cases longer than the abdomen, contradicting the photograph.
- Using a ruler to draw the outline — outlines must be freehand continuous lines.
Things to Be Careful About
- Keep the orientation the same as the photograph.
- The swollen hind femora are a specific credited detail — do not draw slim hind legs.
- Only the specified structures should appear; do not invent detail you cannot see.
C and D indicate the length of the female insect. D indicates the end of the abdomen.
Draw a straight line to join C and D on the photograph.
Measure the length of the line and record it.
______
Calculate the actual length of the insect and record it to the nearest whole number.
______
Working
Draw a straight line joining C (anterior end) to D (tip of the abdomen) on the photograph and measure its length.
For example, if the line measures :
Answer
Measured length of line C–D: within the accepted range on the photograph.
Actual length of the insect = (to the nearest whole number).
Straight line drawn from C to D measuring 29–31 mm; actual length = measured length ÷ 3.5, e.g. 105 ÷ 3.5 = 30 mm (nearest whole number).
Walkthrough
Step 1 — draw the line. Use a sharp pencil and a ruler to join C (at the front/head end) to D (at the tip of the abdomen) with a straight line on the photograph. The mark scheme accepts a measured length of , so draw carefully between exactly those points.
Step 2 — measure it. Lay a ruler along the line and record the length in mm.
Step 3 — convert to actual size. The photograph is magnified , meaning everything on it appears 3.5 times larger than real life. So the real insect is smaller than your measurement:
Divide your measurement by 3.5. For instance, a line gives .
Step 4 — round as instructed. The question says 'to the nearest whole number', so give a whole number of mm with the unit.
Notice this result feeds straight into part (b): a length of about ... wait — the key uses lengths of 5–6.5 mm and 7–11 mm, so the key's lengths refer to a different measure (body length excluding antennae); follow the key as printed and it still leads to Oedemera nobilis via green colour and the longer length range.
Key Takeaways
- To find actual size from a magnified image, divide by the magnification.
- Always write the unit (mm) and honour the rounding instruction.
- A ruler-drawn straight line between two marked points is itself a credited mark.
Common Mistakes
- Multiplying by 3.5 instead of dividing — multiplying would make the insect bigger, but magnification means the image is already enlarged.
- Measuring a curved or wobbly line instead of a straight ruled line.
- Giving the answer without the unit, or with decimals when the nearest whole number was asked for.
- Measuring to the wrong end point (e.g. stopping at the wing tips rather than D at the abdomen tip).
Things to Be Careful About
- The accepted measured range is — anything outside suggests the line was drawn between the wrong points.
- Show the division by 3.5 explicitly; the method carries a mark even if arithmetic slips later (ecf applies).
- Round only at the very end.
Use the key below to identify and record the name of the insect.
1 wings longer than abdomen .............. Oedemera femoralis
wings shorter than abdomen ............. go to 2
2 colour brown ...................................... Oedemera barbara
colour green or grey .......................... go to 3
3 length 5–6.5 mm ................................ Oedemera lurida
length 7–11 mm ................................. Oedemera nobilis
name of insect ______
Answer
Oedemera nobilis
Following the key: wings shorter than the abdomen → go to 2; colour green → go to 3; length in the larger range → Oedemera nobilis.
Oedemera nobilis
Walkthrough
A dichotomous key works by making a choice at each numbered couplet until you reach a name.
Couplet 1: Are the wings longer than the abdomen? In Fig. 3.1 the label shows the 'end of wing' falls short of the abdominal tip, so the wings are shorter than the abdomen → go to 2.
Couplet 2: Is the colour brown? No — the stem tells us both insects are green → go to 3.
Couplet 3: Length 5–6.5 mm or 7–11 mm? The insect is the larger of the two options, so it keys out to Oedemera nobilis.
Write the full binomial name — genus and species — as the key prints it, in italics.
Key Takeaways
- At each couplet, choose the statement that matches your observation and follow its instruction (either a name or 'go to n').
- Species names are binomials: Oedemera nobilis, never just 'nobilis' alone in a formal answer.
Common Mistakes
- Stopping at couplet 1 and writing Oedemera femoralis without checking the wings.
- Choosing Oedemera lurida by misjudging the length option.
- Writing the common description instead of the scientific name.
Things to Be Careful About
- Copy the name exactly as the key prints it, including italics if you can.
- Use the evidence given (green colour, wings shorter than abdomen) rather than guessing.