Biology 5090/41 — October/November 2024
Cambridge O-Level · Alternative to Practical · worked solutions for every part, with the mark scheme
Topics Experimental Contexts · Analysis, Conclusions and Evaluation · Microscopy and Biological Drawing · Planning Experiments and Investigations · Use of Techniques, Apparatus and Materials · Observations and Measurements
Yeast breaks down sugar (glucose) to provide energy for growth and reproduction by respiring anaerobically:
glucose carbon dioxide + alcohol
Sugar is used in human food to make it taste sweet. Too much sugar in the diet can cause diseases. Sugar substitutes are available which taste as sweet as sugar.
A student decided to investigate whether yeast can use a sugar substitute for respiration.
Three test-tubes were set up as shown in Table 1.1.
Table 1.1
| contents | mixture in the test-tubes | ||
|---|---|---|---|
| distilled water / | 15 | 15 | 15 |
| yeast / | 1 | 1 | 1 |
| test substance | sugar | sugar substitute | no addition |
The three test-tubes were labelled so that they could be identified.
State the labels that you would use on the three test-tubes.
test-tube containing sugar: ______
test-tube containing sugar substitute: ______
test-tube with no addition: ______
Answer
test-tube containing sugar: A
test-tube containing sugar substitute: B
test-tube with no addition: C
Any three different labels, e.g. A, B, C (or 1, 2, 3)
Walkthrough
The only requirement is that each test-tube can be told apart from the others. Any three different letters or numbers work — A, B, C or 1, 2, 3. Writing the contents in full ('sugar', 'sugar substitute', 'no addition') is also acceptable, but short letters or numbers are quicker and less likely to smudge.
Key Takeaways
Every test-tube in an investigation must be labelled so results can be matched to the correct tube later.
Common Mistakes
Using the same label on more than one tube, or leaving the tubes unlabelled and relying on memory.
Things to Be Careful About
The mark scheme accepts 'suitable different letters / numbers' — the key word is different: all three labels must be distinct.
A stirring rod was used to mix the contents of each test-tube.
Explain why it was important to clean the stirring rod after using it in each test-tube.
______
Answer
To prevent transfer of sugar (or sugar substitute) from one test-tube to the next, which would contaminate the other mixtures and affect the results.
To prevent transfer of sugar/sugar substitute between test-tubes (contamination).
Walkthrough
If the same stirring rod is moved from the sugar tube to the sugar-substitute tube without cleaning, traces of sugar come with it. The sugar-substitute tube would then contain a little sugar, so any bubbling there could not be attributed to the substitute alone — the comparison between tubes would be invalid. Cleaning the rod between tubes keeps each tube's contents exactly as planned.
Key Takeaways
Cleaning shared apparatus between samples prevents cross-contamination, which would make the results of different conditions impossible to compare.
Common Mistakes
Writing vague answers such as 'to keep it clean' or 'for accuracy' without naming what is transferred (sugar or sugar substitute) and what it would affect (the other test-tubes).
Things to Be Careful About
The mark scheme wants the transferred substance named: 'prevent transfer of sugar/sugar substitute to other test-tubes'.
The level of the mixtures in each test-tube was marked with a water-resistant marker. This was the starting level.
When the yeast respires, it produces bubbles of gas that are trapped in the mixture, making the level of the mixture rise up the test-tube.
The student used a large beaker as a water-bath to control the temperature of the test-tubes in this investigation. The temperature of the water at the beginning was . The aim was to maintain this temperature throughout the investigation by adding hot or cold water.
The three test-tubes were placed in the water-bath, and a timer was started. At 5 minutes, 10 minutes and 15 minutes, the distances moved by the mixtures from the starting levels were measured and recorded. The temperature of the water-bath was also recorded.
Fig. 1.1 shows the lower parts of the test-tubes at 5 minutes and the water-bath thermometer reading at 5 minutes.
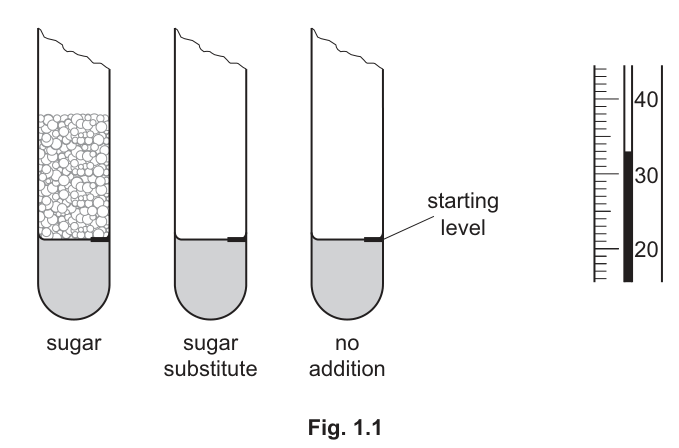
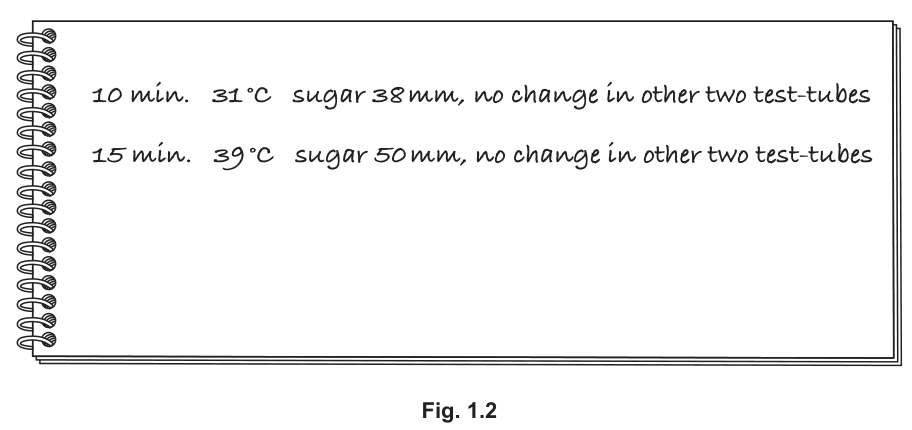
Fig. 1.2 shows the results for 10 and 15 minutes recorded in the student's notebook.
Complete Table 1.2:
- Complete the headings.
- Using Fig. 1.1, measure the distances moved by the yeast mixtures from the starting levels in the three test-tubes and record them. Read the temperature shown on the water-bath thermometer in Fig. 1.1 and record it.
- Use the information in Fig. 1.2 to complete Table 1.2.
Table 1.2
| ______ | ______ | temperature of water-bath / | ||
|---|---|---|---|---|
| sugar | sugar substitute | no addition | ||
| 5 | ||||
| 10 | ||||
| 15 |
Answer
| time / minutes | distance moved above starting level, sugar / mm | distance moved above starting level, sugar substitute / mm | distance moved above starting level, no addition / mm | temperature of water-bath / |
|---|---|---|---|---|
| 5 | 22 | 0 | 0 | 33 |
| 10 | 38 | 0 | 0 | 31 |
| 15 | 50 | 0 | 0 | 39 |
Completed Table 1.2: headings 'time / minutes' and 'distance (of yeast mixture above start level) / mm'; 5 min: 22, 0, 0, 33 °C; 10 min: 38, 0, 0, 31 °C; 15 min: 50, 0, 0, 39 °C
Walkthrough
The table needs two things: correct headings and the data.
Headings. The first column is the independent variable — the time readings were taken — so it is headed 'time / minutes'. The next three columns record what was measured: the distance the mixture rose above the starting level, in mm, one column per tube. The last column is the water-bath temperature in °C. Units go in the headings, not in the cells — that is the 5090 convention and it is a separate marking point.
Data at 5 minutes. From Fig. 1.1, only the sugar tube shows a rise; measuring the froth above the starting level gives about 22 mm (the scheme accepts 21–23). The other two tubes are at the starting level, so 0. The thermometer reads 33 °C — note the meniscus sits just below the 35 °C starting temperature, showing the bath has already cooled.
Data at 10 and 15 minutes. Fig. 1.2 gives these directly: at 10 minutes, 31 °C and 38 mm for sugar with no change in the other tubes; at 15 minutes, 39 °C and 50 mm for sugar, again no change in the others.
Key Takeaways
Tables need the variable and its unit in the heading; units are never repeated in every cell. Readings from a printed diagram are accepted within a tolerance (here 21–23 mm).
Common Mistakes
Putting units (mm, °C, min) inside the table cells instead of the headings; forgetting the '0' readings for the two tubes that showed no change; misreading the thermometer as 35 °C (the starting temperature) instead of 33 °C; measuring the whole froth column instead of the distance above the starting level.
Things to Be Careful About
The measurement at 5 minutes is credited as 21–23 mm — measure from the starting-level mark to the top of the froth in the sugar tube. The heading must name the measurement ('distance of yeast mixture above start level') with '/ mm'.
Explain how the test-tube with no addition acted as a control in this investigation.
______
Answer
The tube with no addition contained everything except a test substance, so it showed that yeast alone (with no sugar or substitute) does not produce gas — allowing a comparison to see the effect of the sugar and the sugar substitute.
It allows a comparison, to see the effect of the sugar / sugar substitute.
Walkthrough
A control is a set-up identical to the experimental tubes except for the factor being tested. Here the 'no addition' tube has water and yeast but no sugar and no substitute. If gas had appeared in that tube, it would show the bubbling was caused by something other than the added substance — the yeast alone, or contamination. Because nothing happened in it, any rise in the sugar tube can be attributed to the sugar. The control therefore provides the baseline against which the other tubes are compared.
Key Takeaways
A control shows what happens when the factor being investigated is absent, so the effect of that factor can be identified by comparison.
Common Mistakes
Saying only 'it is a control' or 'to compare' without saying what is being compared or why; claiming it proves yeast is alive (that is not what this control tests).
Things to Be Careful About
The mark scheme's accepted answer is 'so that a comparison can be made' or 'to see the effect of sugar / sugar substitute' — the comparison idea must be explicit.
Answer
Yeast can respire using sugar but cannot use the sugar substitute for respiration.
Yeast can only respire using sugar; yeast cannot use the sugar substitute to respire.
Walkthrough
The evidence: the sugar tube produced gas (the mixture rose 22, then 38, then 50 mm), while the sugar-substitute tube and the control showed no change at all. Gas production is the sign of anaerobic respiration (carbon dioxide bubbles). So yeast respires sugar but not the substitute — the substitute cannot replace sugar as a respiratory substrate for yeast.
Key Takeaways
A conclusion must follow directly from the pattern in the data: only the sugar tube bubbled, so only sugar was respired.
Common Mistakes
Writing a general statement such as 'yeast respires sugar' without addressing the substitute — the investigation was specifically about whether yeast can use the substitute, so the conclusion must mention it.
Things to Be Careful About
The mark scheme wants both halves of the comparison: yeast respire using sugar AND cannot use the substitute.
Use the information in Fig. 1.1 and Fig. 1.2 to evaluate the student's control of the water-bath temperature.
______
Answer
The temperature was poorly controlled — it fluctuated (33 °C, 31 °C, 39 °C) instead of staying constant at 35 °C.
Poorly / not well controlled — the temperature fluctuated and was not constant.
Walkthrough
The aim was to maintain 35 °C throughout. The recorded temperatures were 33 °C at 5 minutes, 31 °C at 10 minutes and 39 °C at 15 minutes — a swing of 8 degrees. The temperature was therefore not kept constant: it is a '+' mark, so the judgement ('poor / not well controlled') AND the evidence ('it fluctuated / was not constant') are both needed.
Key Takeaways
Evaluating a controlled variable means comparing the recorded values against the intended value and describing how they deviated.
Common Mistakes
Giving only the judgement ('it was bad') without the evidence, or only the evidence ('it was 33, 31, 39 °C') without the judgement — both halves are required for the mark.
Things to Be Careful About
This is a '+' mark: poor control + temperature fluctuations / not constant. Either half alone scores zero.
Answer
Too much hot water was added to the water-bath.
(Too much) hot water was added.
Walkthrough
The temperature had dropped to 31 °C by 10 minutes, so the student added hot water to bring it back up. By 15 minutes it read 39 °C — 4 degrees above the target of 35 °C. The only way the temperature could overshoot is that more hot water was added than needed. (The student's method was to add hot or cold water to adjust the temperature; the overshoot means the hot-water addition was too large.)
Key Takeaways
When a controlled variable overshoots its target, look at the adjustment mechanism: too much of the correcting agent was applied.
Common Mistakes
Suggesting the yeast heated the water (the heat released by respiration in three small test-tubes could not raise a large beaker of water by 8 °C); suggesting the thermometer was faulty without reason.
Things to Be Careful About
The mark scheme's answer is simply '(too much) hot water added' — keep the answer tied to the method described in the stem.
The yeast's activity could also have been measured by recording any increase in the volume of the mixtures in the test-tubes.
Fig. 1.3 shows a test-tube with sugar, yeast and distilled water as seen from above. The distance above the marked starting level in this test-tube after 10 minutes was .
The line between A and B indicates the diameter of the mixture within the test-tube.
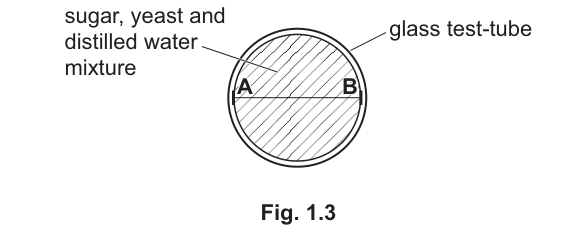
Measure and record the length of the line between A and B.
diameter of mixture within test-tube = ______
Calculate the increase in volume of the mixture in this test-tube after 10 minutes.
Use 3.14 as the value of . Give your answer to 1 decimal place.
Show your working.
volume increase = ______
Working
Diameter measured between A and B =
Answer
diameter of mixture within test-tube =
volume increase =
diameter = 2.2 cm (accept 2.1–2.3); volume increase = 14.4 cm³
Walkthrough
The rising mixture fills the tube as a cylinder, so the increase in volume is the volume of a cylinder of height 3.8 cm (the rise above the starting level) and diameter equal to the internal diameter AB.
Step 1 — measure the diameter. Using a ruler on Fig. 1.3, the line AB measures 2.2 cm (the scheme accepts 2.1–2.3 cm).
Step 2 — find the radius. The formula uses the radius, so halve the diameter: 2.2 ÷ 2 = 1.1 cm. Forgetting this step is the commonest error — using the diameter directly in gives an answer four times too large.
Step 3 — apply the formula.
Step 4 — round. The question asks for 1 decimal place, so the answer is 14.4 cm³.
Key Takeaways
Volume of a cylinder: . Always halve a measured diameter before squaring, use the value of π the question gives (here 3.14), and round only at the end to the precision asked for.
Common Mistakes
Using the diameter instead of the radius in the formula; squaring wrongly (, not 2.2); rounding too early and losing precision; forgetting the unit cm³; giving more or fewer decimal places than the 1 d.p. requested.
Things to Be Careful About
The scheme accepts the diameter as 2.1–2.3 cm and credits the radius 'once anywhere in a calculation' — so even if your measured diameter differs slightly, a correctly computed answer from your own diameter scores. The answer line takes precedence, so the final value on the line must be 14.4 (or the value consistent with your measurement, ecf).
The apparatus used in this investigation is shown in Fig. 1.1. Suggest a piece of apparatus that could have been used in this investigation to directly measure the volume of the mixture. Describe how you would determine the increase in volume at each time interval using this apparatus.
apparatus = ______
determination of increase in volume = ______
Answer
apparatus = graduated measuring cylinders (used instead of the test-tubes)
determination of increase in volume = read the starting volume, then read the volume at each time interval and subtract the starting volume from it.
Graduated measuring cylinders; subtract the starting volume from the volume at each time interval.
Walkthrough
The investigation measured the rise of the mixture indirectly by marking a level on a test-tube. To measure volume directly, the tubes could be replaced with graduated measuring cylinders, which have a printed scale in cm³. The method: record the volume of the mixture at the start, then at each time interval (5, 10, 15 minutes) read the new volume from the scale. The increase at each interval is the new reading minus the starting volume — the subtraction is what turns readings into 'increase in volume'.
Key Takeaways
A graduated measuring cylinder measures volume directly; a change in volume is always found by subtracting the initial value from the later value.
Common Mistakes
Naming a beaker or conical flask (not graduated finely enough); describing only 'read the volume' without the subtraction against the starting volume, which is the second marking point.
Things to Be Careful About
Both marks are needed: the apparatus (graduated measuring cylinder) AND the method (subtract starting volume from each later reading). Naming the apparatus alone scores one mark.
When organisms respire aerobically they use oxygen and produce carbon dioxide.
Some students investigated the rate at which germinating seeds respired, using the apparatus in Fig. 2.1.
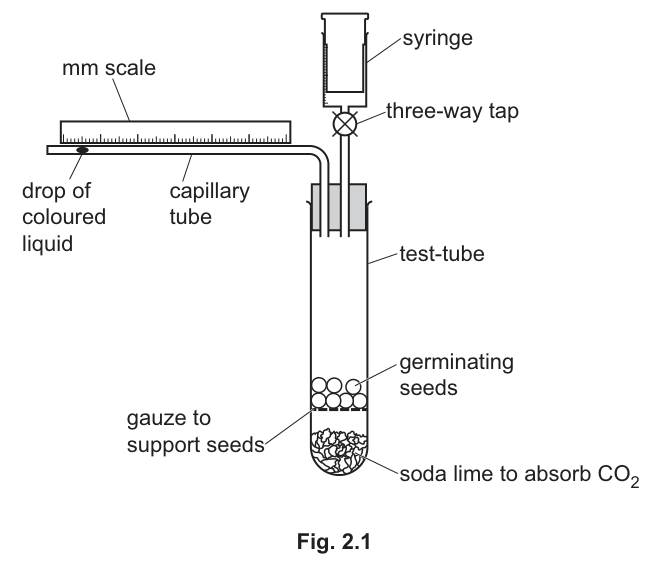
Carbon dioxide produced by the germinating seeds was absorbed by the soda lime. As oxygen was used the volume of gas in the apparatus reduced and the drop of coloured liquid moved along the capillary tube towards the seeds.
The students moved the drop of coloured liquid in the capillary tube to the beginning of the scale () by opening the three-way tap and using the syringe to carefully push air into the apparatus. They then closed the tap.
This was the start position for the drop of coloured liquid. Its position on the scale was recorded over the next four minutes. The movement of the drop of coloured liquid indicates the rate of respiration of the seeds.
The students' results are shown in Table 2.1.
Table 2.1
| time / minutes | position of drop of coloured liquid / |
|---|---|
| 0 | 0 |
| 1 | 18 |
| 2 | 36 |
| 3 | 54 |
| 4 | 72 |
Construct a line graph of the data in Table 2.1 on the grid. The values for the end points of the axes are shown on the grid. Draw a straight line of best-fit to connect the points.
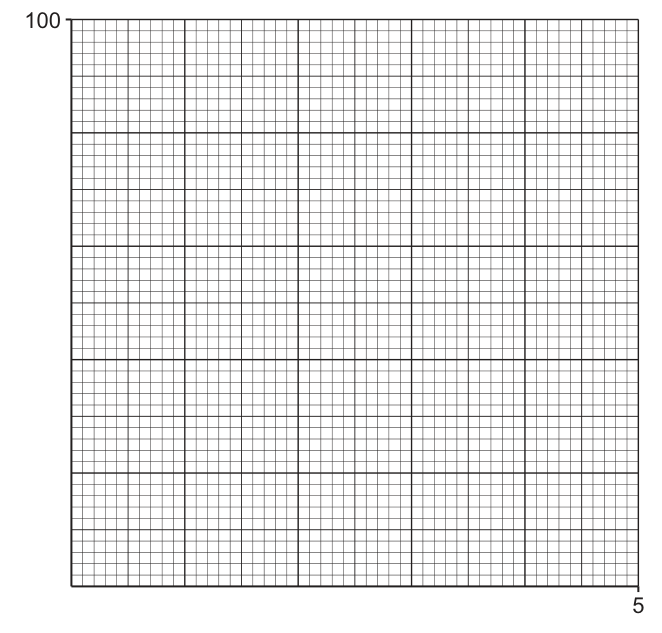
Answer
- x-axis: time / minutes; y-axis: position of drop of coloured liquid / mm
- linear scales: 0 to 5 on the x-axis, 0 to 100 on the y-axis, with 0 at the origin
- points plotted at (0,0), (1,18), (2,36), (3,54), (4,72), each marked with a small cross
- a single straight ruled line drawn through all five points
See working
Walkthrough
The data in Table 2.1 are a continuous independent variable (time) against a continuous dependent variable (position of the drop), so the correct presentation is a line graph, not a bar chart. Time always goes on the x-axis. The grid already gives the end points: 5 minutes on the x-axis and 100 mm on the y-axis, so a scale of 1 small square = 0.1 minutes and 1 small square = 1 mm (or 2 mm per large square) fills the grid neatly. Both axes must be labelled with the quantity AND its unit — 'time / minutes' and 'position of drop of coloured liquid / mm' — following the 5090 slash convention. The origin must carry a 0 on both axes. Each point is plotted with a small, neat cross (or a dot with a circle round it), positioned to within half a small square. Because the drop moves at a constant rate (18 mm each minute), all five points lie exactly on one straight line, so a single straight ruled line through them is the line of best fit — no curve, no joining dot-to-dot with a broken line.
Key Takeaways
- Line graphs are for continuous data; time goes on the x-axis.
- Axis labels need the quantity and the unit, written as 'quantity / unit'.
- Scales must be linear, easy to read, and use at least half the grid.
- Points are marked with crosses or encircled dots; a best-fit line is drawn with a ruler through the points.
Common Mistakes
- Omitting the unit from an axis label ('time' alone loses the mark).
- Starting a scale at a value other than 0 at the origin, or using an awkward scale such as 3 squares per minute.
- Joining the points dot-to-dot freehand instead of drawing one straight ruled line.
- Plotting points as large blobs instead of precise crosses.
Things to Be Careful About
- The grid end points are printed (5 and 100) — your scales must end exactly there.
- Check each plotted point against the table before drawing the line; one mis-plotted point costs a mark.
- Use a sharp pencil and a ruler for the line of best fit.
Use your graph to predict the position of the drop of coloured liquid at 5 minutes. Show your working on the graph.
position = ______
Working
Extend the ruled line of best fit beyond the last plotted point (4, 72) up to 5 minutes and read off the y-value.
Answer
position = 90 mm
90 mm (accept 89–91 mm)
Walkthrough
The drop moves 18 mm every minute, so at 5 minutes it should have moved 5 × 18 = 90 mm. On the graph this is found by extending (extrapolating) the straight line of best fit one more minute past the last plotted point at (4, 72) and reading where it crosses the 5-minute gridline: 90 mm. The mark scheme awards one mark for showing the extrapolation on the graph (dashed continuation or the line extended) and one mark for the value, accepting 89–91 mm to allow for small plotting inaccuracies.
Key Takeaways
- Extrapolation means extending the line of best fit beyond the plotted data to predict a value.
- A constant rate gives a straight line, so extrapolation is reliable here.
- Show the construction on the graph — the working is part of the answer.
Common Mistakes
- Reading the value at 4 minutes (72 mm) instead of extrapolating to 5 minutes.
- Extrapolating with a freehand curve instead of continuing the ruled straight line.
- Not showing the extension on the graph, losing the working mark.
Things to Be Careful About
- The accepted range is 90 ± 1 mm, so plot carefully; a badly drawn line can push you outside it.
- Extrapolation is only valid because the line is straight — never extrapolate a curve far beyond the data.
Use the result at 4 minutes in Table 2.1 to calculate the rate of movement of the drop of coloured liquid caused by the respiration of the seeds.
rate of movement = ______
Working
Answer
rate of movement = 18 mm / minute
18 mm / minute
Walkthrough
A rate is always 'something per unit time'. The question tells you to use the 4-minute result: the drop has moved 72 mm in 4 minutes, so the rate is 72 ÷ 4 = 18 mm per minute. The mark scheme awards one mark for the number 18 and one mark for the unit mm / minute — so the unit is not optional decoration, it is a whole mark. Note that this is also the gradient of the line in (a)(i), which is why the graph was a straight line.
Key Takeaways
- rate = distance (or change) ÷ time.
- A rate must always carry a unit; on 5090 the unit is often a separate mark.
- The rate of a straight-line graph equals its gradient.
Common Mistakes
- Writing just '18' with no unit, losing a mark.
- Dividing the wrong way (4 ÷ 72).
- Writing the unit as 'mm' alone instead of 'mm / minute'.
Things to Be Careful About
- Use the 4-minute value as instructed, not the 1-minute value (although here the rate is constant so the answer is the same).
- Write the unit in the slash form the paper uses: mm / minute.
Plan an investigation to determine the effect of temperature on the rate of respiration in germinating seeds. Use the apparatus in Fig. 2.1 in your plan.
Answer
- Set up the respirometer as in Fig. 2.1 with germinating seeds.
- Place the apparatus in a water-bath at a chosen temperature (e.g. ); use at least three temperatures below (e.g. , , , ).
- Leave the apparatus in the water-bath for several minutes so the seeds and air reach that temperature before measurements are taken.
- Use the syringe and three-way tap to move the drop of coloured liquid to 0 mm on the scale, then close the tap.
- Record the position of the drop on the scale every minute (or after a fixed time) for several minutes.
- Use the same mass / number of seeds at the same stage of germination at each temperature.
- Repeat at each temperature and calculate a mean distance moved.
- Calculate the rate of movement (mm per minute) at each temperature.
- Conclusion: the rate of respiration increases as temperature increases (up to an optimum).
See working
Walkthrough
This is the classic planning question: you are given the apparatus and must design an investigation in which temperature is the independent variable and the rate of movement of the drop (which indicates the rate of respiration) is the dependent variable. The mark scheme lists nine creditable points for six marks, so you should aim to cover every category:
- Range of the independent variable: at least three temperatures, all below 70 °C (above that the enzymes in the seeds would denature and the apparatus could be damaged).
- How to control temperature: a water-bath, because water transfers heat evenly and its temperature can be set and maintained.
- Equilibration: the apparatus must be left to come to the water-bath temperature before you start timing, otherwise the air inside expands or contracts and gives a false initial movement of the drop.
- Zeroing the drop: use the syringe and three-way tap exactly as the students did, so every reading starts from 0 mm.
- Measuring the dependent variable: record the distance the drop moves with time, or after a fixed time — this is what lets you calculate a rate.
- Controlled variables: the same mass or number of seeds, at the same stage of germination, at every temperature; anything else that changes oxygen use would confound the results.
- Reliability: repeat each temperature and calculate a mean.
- Processing: calculate a rate (mm per minute) for each temperature so temperatures can be compared.
- Conclusion: state what the results would show — respiration rate rises with temperature (enzymes work faster as temperature increases, up to an optimum).
Key Takeaways
- A good plan names the independent variable (temperature), the dependent variable (rate of movement of the drop) and the key controlled variables (seeds).
- A water-bath is the standard way to control temperature in 5090 practicals.
- Equilibration time before starting is a frequently credited, frequently forgotten point.
- Repeats and a mean, and calculating a rate, are the standard reliability and processing points.
Common Mistakes
- Using only one or two temperatures — the scheme requires at least three.
- Choosing temperatures at or above 70 °C, where enzymes denature.
- Forgetting to let the apparatus reach the water-bath temperature before starting.
- Changing the number or mass of seeds between temperatures.
- Writing 'repeat for accuracy' without saying what to do with the repeats (calculate a mean).
- Describing the apparatus instead of describing the method.
Things to Be Careful About
- The scheme says 'any six from' nine points, so extra valid points give you margin, but vague points score nothing.
- State the temperatures as actual values, not just 'different temperatures'.
- The conclusion must be stated explicitly — it is a separate mark.
- Keep the method as a numbered sequence a candidate could actually follow.
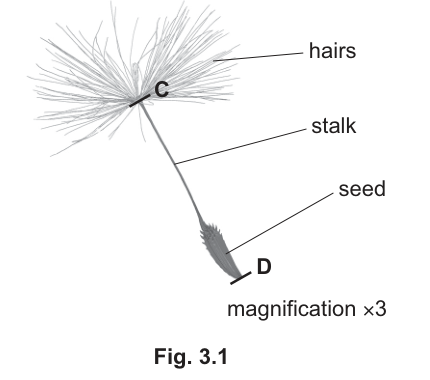
Fig. 3.1 shows the whole of a one-seeded fruit of a dandelion flower. A single dandelion flowerhead can produce up to 200 of these one-seeded fruits. The mass of a single fruit is .
Answer
Large drawing of the whole dandelion fruit, at least 80 mm from top of seed to base of hairs, drawn with sharp, clear, continuous lines and no shading, with the stalk as a double line longer than the seed, the seed tapered and delimited with double-lined hooks on its upper half only.
Walkthrough
The examiner is marking how you draw, not just what you draw. Four separate creditable points appear in the mark scheme:
- Overall quality — the whole fruit must be present, drawn with a sharp pencil in clear, continuous lines, with no shading, stippling or cross-hatching anywhere. Biological drawings use single lines to show boundaries; tone is never added.
- Size — the drawing must be at least 80 mm long from the top of the seed to the base of the hairs. Measure with a ruler before you start and plan the space.
- Proportions — the stalk must be drawn as a double line (two parallel lines, because it is a tube-like structure) running all the way to the top, and it must be clearly longer than the seed, as in Fig. 3.1.
- Detail — the seed must be delimited (its outline clearly closed off from the stalk) and tapered, with the small hooks (barbs) drawn with double lines, and the hooks present only on the top half of the seed, exactly as the photograph shows.
Key Takeaways
- A biological drawing is a line drawing: sharp pencil, continuous lines, no shading, no ruled lines.
- Size requirements are always a specific minimum — check it before drawing.
- Tubes, stalks and cell walls are drawn with double lines.
- Draw only what is asked for, in the correct proportions and orientation, and include exactly the detail the question names.
Common Mistakes
- Shading or stippling the seed to show it is dark — this loses the quality mark.
- Drawing the stalk as a single line — the scheme requires a double line.
- Drawing hooks all over the seed — they are only on the top half.
- Drawing too small — under 80 mm loses a mark outright.
- Breaking the outline into sketchy, repeated strokes instead of one continuous line.
Things to Be Careful About
- The scheme gives four separate points; each is a mark, so satisfy all four, not just 'a nice drawing'.
- Keep the orientation the same as Fig. 3.1 (hairs at the top, seed at the bottom).
- Do not add labels unless asked — this part asks for the drawing only.
The lines C and D indicate the total length of the seed and stalk. Draw a straight line on Fig. 3.1 to join C and D. Measure the length of the line and record it.
______
Calculate the actual length of the seed and stalk and record it to the nearest whole number.
______
Working
Length of line C–D on Fig. 3.1 = 36 mm (accept 35–37 mm)
Answer
Length of line C–D = 36 mm
Actual length of seed and stalk = 12 mm
36 mm measured on the figure (accept 35–37 mm); actual length 12 mm
Walkthrough
The figure is printed at a magnification of , meaning the image is three times larger than the real fruit. First draw a straight line joining C (top of the stalk, at the base of the hairs) to D (bottom of the seed) and measure it with a ruler in mm — a correct measurement is between 35 and 37 mm. Then undo the magnification by dividing by 3:
Using 36 mm: . The question asks for the answer to the nearest whole number, so no decimals.
Key Takeaways
- Magnification means image size = 3 × actual size, so actual size = image size ÷ 3.
- Always state the unit (mm) for both the measurement and the calculated answer.
- Round only at the end, and only to the precision asked for.
Common Mistakes
- Multiplying by 3 instead of dividing — that would give 108 mm, far too big for a dandelion fruit.
- Omitting the unit 'mm' on either blank.
- Giving a decimal answer when the question says 'to the nearest whole number'.
- Measuring a curved or slanted path instead of one straight line from C to D.
Things to Be Careful About
- The mark scheme accepts 35–37 mm for the measurement, so a slightly different ruler reading still scores — but it must be in mm.
- The calculation mark is awarded for the correct division of the candidate's own measurement by 3 (error carried forward applies), so show the working.
Identify two features of this fruit that show it is adapted for dispersal by wind. Explain your answers.
- ______
- ______
Answer
- The fruit has a low mass / is light and small, so it is easily carried by the wind.
- The fruit has a pappus of hairs, which increases the surface area and acts like a parachute, so the fruit glides and stays airborne for longer.
- Low mass/light — easily carried by wind. 2. Hairs — increase surface area / act like a parachute, helping it glide.
Walkthrough
Each mark needs a feature plus its explanation — the '+' in the mark scheme means both halves are required for the one mark.
- Feature 1: low mass. The fruit has a mass of only 0.0005 g, so it is very light. A light object is easily picked up and carried by even a gentle breeze, so it can travel far from the parent plant.
- Feature 2: the hairs (pappus). The umbrella of fine hairs at the top greatly increases the surface area exposed to the air and acts like a parachute. This increases air resistance, so the fruit falls slowly and glides, giving the wind more time and distance to carry it.
This is wind dispersal: the adaptations increase the chance the seed lands away from the parent, reducing competition for light, water and mineral ions.
Key Takeaways
- An adaptation answer must pair the structure with its function — 'hairs' alone scores nothing without 'increase surface area / parachute / glide'.
- Wind-dispersed fruits are typically light with a large surface area.
Common Mistakes
- Naming the feature without the explanation (or vice versa) — each mark needs both halves.
- Saying the hairs 'make it fly' without the parachute / surface-area idea.
- Describing animal dispersal features (hooks for fur) — the hooks here are tiny barbs, not animal-dispersal hooks, and the question asks for wind dispersal.
Things to Be Careful About
- Give exactly two features — the numbered lines ask for two.
- Use the figure: the hairs and the tiny mass (0.0005 g) are the evidence given in the stem.