Biology 5090/31 — October/November 2024
Cambridge O-Level · Practical Test · worked solutions for every part, with the mark scheme
Topics Experimental Contexts · Analysis, Conclusions and Evaluation · Microscopy and Biological Drawing · Planning Experiments and Investigations · Use of Techniques, Apparatus and Materials · Observations and Measurements
Yeast breaks down sugar (glucose) to provide energy for growth and reproduction by respiring anaerobically:
glucose carbon dioxide + alcohol
Sugar is used in human food to make it taste sweet. Too much sugar in the diet can cause diseases. Sugar substitutes are available which taste as sweet as sugar.
You are going to investigate whether yeast can use a sugar substitute for respiration.
You are provided with three portions of dried yeast, of sugar, of sugar substitute, distilled water and three large test-tubes.
Read through the following procedure carefully and decide how to label your test-tubes.
Do not carry out the procedure yet.
- Add of distilled water to each of the three large test-tubes.
- Use the beaker or similar container as a water-bath to keep the test-tubes at a temperature of between and throughout this investigation. Put your hand up when you require hot water. You are supplied with a container labelled 'cold water' to help control the temperature.
- Add of sugar to the test-tube you have labelled.
- Use the stirring rod to stir this to dissolve the sugar.
- Clean the stirring rod.
- Add of sugar substitute to another test-tube you have labelled.
- Use the stirring rod to stir this to dissolve the sugar substitute.
- Add of yeast to each of the three test-tubes.
- Use the stirring rod to mix the yeast with the liquid in each test-tube for 30 seconds, cleaning it between use in each test-tube.
- Mark the level of the top of the mixture on the outside of each test-tube. This will be the starting level.
Label your three test-tubes. State the labels that you have used.
test-tube containing sugar: ______
test-tube containing sugar substitute: ______
test-tube with no addition: ______
Answer
test-tube containing sugar: S
test-tube containing sugar substitute: SS
test-tube with no addition: W
Any three different labels, e.g. S, SS and W (one per test-tube)
Walkthrough
The procedure asks you to decide how to label your test-tubes before starting. Any clear, different letters or numbers are acceptable — the only requirement is that each tube is identifiable. A sensible choice is S for sugar, SS for sugar substitute and W for the water-only tube, since these are short and unambiguous.
Key Takeaways
Every tube in a comparative investigation must be labelled so that results can be attributed to the correct sample.
Common Mistakes
Using the same label or no label at all; writing descriptions too long to fit on a tube.
Things to Be Careful About
The mark scheme accepts 'suitable different letters / numbers' — any distinct system scores, as long as the three labels differ.
Explain why it is important to clean the stirring rod after using it in each test-tube.
______
Answer
To prevent transfer of sugar / sugar substitute from one test-tube to another, which would contaminate the other mixtures.
To prevent transfer of sugar / sugar substitute to the other test-tubes
Walkthrough
The stirring rod goes into the sugar tube first. If it is not cleaned, traces of sugar stick to it and are carried into the sugar-substitute tube and the water tube. Then the 'sugar substitute' tube would contain some sugar too, and the control tube would no longer be sugar-free — the comparison between the three tubes would be invalid.
Key Takeaways
Cleaning shared apparatus between samples prevents cross-contamination and keeps each test valid.
Common Mistakes
Writing vague answers such as 'to keep it clean' or 'for accuracy' without naming what is transferred (sugar or sugar substitute).
Things to Be Careful About
The mark scheme wants the transfer of sugar / sugar substitute named specifically — 'to avoid contamination' alone may not score the full idea.
Now carry out the procedure. Place your test-tubes in the water-bath and immediately start your timer.
If the yeast in the mixtures respires, it will produce bubbles of gas that will be trapped in the mixture, making it rise up the test-tube.
Measure the distance that the yeast mixtures have moved from the marked starting levels at 5 minutes, 10 minutes and 15 minutes and record them, together with the temperature of the water in the water-bath, in Table 1.1.
Table 1.1
| time / minutes | distance of yeast mixture above starting level / : sugar | distance of yeast mixture above starting level / : sugar substitute | distance of yeast mixture above starting level / : no addition | temperature of water-bath / |
|---|---|---|---|---|
| 5 | ||||
| 10 | ||||
| 15 |
Answer
Record your own readings in Table 1.1. A scoring table looks like this (example values — your own readings are credited):
| time / minutes | distance above starting level / mm : sugar | distance above starting level / mm : sugar substitute | distance above starting level / mm : no addition | temperature of water-bath / °C |
|---|---|---|---|---|
| 5 | 4 | 0 | 0 | 40 |
| 10 | 9 | 1 | 0 | 40 |
| 15 | 15 | 1 | 0 | 40 |
Requirements for the marks:
- three temperature readings, all between and ;
- the sugar column at 15 minutes greater than at 5 minutes;
- no (or very small) increase in the sugar substitute column;
- no (or very small) increase in the no-addition column;
- all data recorded in the table, with no units written inside the cells (units are in the column headings).
Candidate's own readings: three temperatures within 35–45 °C, sugar rising over time, negligible rise for sugar substitute and no addition, all recorded in the table with units only in the headings
Walkthrough
This part is marked on what you actually observe and how you record it. Yeast respires the sugar anaerobically, producing carbon dioxide; the bubbles of gas are trapped in the mixture and make it rise, so the sugar tube should show a clear increase from 5 to 15 minutes. Yeast cannot use the sugar substitute, and the water-only tube has no substrate at all, so both of those columns should show no rise, or at most a very small one. The water-bath temperature must be kept between and — warm enough for yeast enzymes to work quickly, but not so hot that they denature — and all three of your temperature readings must fall in that range. Finally, the units (mm and °C) belong in the column headings only; writing them in every cell breaks table convention and loses a mark.
Key Takeaways
- Anaerobic respiration of yeast: glucose → carbon dioxide + alcohol; the gas causes the rise.
- A control with no substrate shows what happens without the variable being tested.
- Tables carry units in the headings, not in the cells.
Common Mistakes
Writing 'mm' in every data cell; recording temperatures outside the 35–45 °C range; showing a rise in the sugar-substitute tube that contradicts the expected biology; leaving cells blank.
Things to Be Careful About
The mark scheme checks internal consistency: your conclusion in (a)(v) must match the results you record here. Keep the temperature constant and within range throughout — use the cold water to bring it back down if it climbs.
Explain how the test-tube with no addition acted as a control in your investigation.
______
Answer
The test-tube with no addition acted as a control so that a comparison could be made — it shows what happens with no sugar or sugar substitute present, i.e. the effect of the sugar / sugar substitute itself.
So that a comparison can be made / to see the effect of the sugar or sugar substitute
Walkthrough
A control is a set-up that is identical to the experimental tubes except that the factor being investigated is missing. Here the control tube has yeast and water but no sugar and no sugar substitute. Any rise in that tube would show that the yeast, the water or the temperature alone causes a rise; because it shows (almost) no rise, any rise in the sugar tube can be attributed to the sugar being respired. The control therefore provides the baseline against which the other two tubes are compared.
Key Takeaways
A control isolates the effect of the independent variable by removing it while keeping everything else the same.
Common Mistakes
Saying the control 'proves the experiment worked' or 'makes it fair' without saying what it is compared against.
Things to Be Careful About
The mark scheme accepts 'so that a comparison can be made' or 'to see the effect of sugar / sugar substitute' — the idea of comparison is the credited point.
Answer
Yeast can only respire using sugar — it cannot use the sugar substitute for respiration.
Yeast can respire using sugar but cannot use the sugar substitute to respire
Walkthrough
Your results should show a clear rise in the sugar tube but little or no rise in the sugar-substitute tube. The rise is caused by carbon dioxide from anaerobic respiration, so a rise means the yeast is respiring that substance. Since only the sugar tube rises, the conclusion is that yeast can respire sugar but cannot respire the sugar substitute. The mark scheme explicitly checks that your conclusion is consistent with the results you recorded in Table 1.1.
Key Takeaways
A conclusion must be justified by the data: gas production (rise in the mixture) is the evidence of respiration here.
Common Mistakes
Concluding 'yeast respires sugar' only, without saying anything about the sugar substitute; or giving a conclusion that contradicts your own table.
Things to Be Careful About
State the conclusion for both substances — the comparison is the point of the investigation.
Describe one source of error in your investigation and explain how it might have affected your results.
source of error = ______
effect on results = ______
Answer
source of error = it was difficult to mix all of the yeast / sugar completely into solution in each test-tube
effect on results = the amounts of yeast and sugar actually in solution differed between test-tubes, so the rises measured may not be comparable / the results may not be valid
Difficult to completely mix all the yeast/sugar into solution, so results may not be comparable / valid
Walkthrough
The mark scheme names the accepted error: incomplete mixing of the yeast and sugar into the solution. If some yeast or sugar stays stuck at the bottom of a tube, the effective concentrations differ between tubes. Since the height the mixture rises depends on how much respiration happens, tubes that were mixed differently cannot be fairly compared — the results may not be comparable or valid. Note that the mark scheme ignores water-bath temperature as an answer here (it was already credited elsewhere) and rejects vague 'human error' answers.
Key Takeaways
A good source-of-error answer names the specific step that went wrong and links it to a specific effect on the data, not just 'the results would be wrong'.
Common Mistakes
Writing 'human error', 'mistakes in measuring' or 'temperature of the water-bath' — these are ignored or rejected by the scheme; giving an error with no effect, or an effect with no named error.
Things to Be Careful About
Both lines must be completed and linked: the effect should follow logically from the error named.
In a similar investigation, the yeast's activity was measured by recording any increase in the volume of the mixtures in the test-tubes.
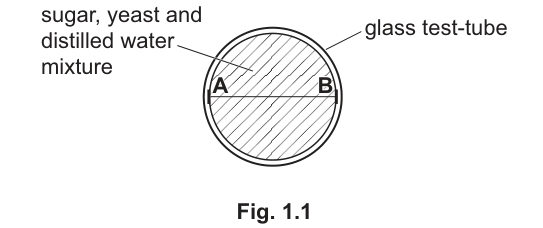
Fig. 1.1 shows a test-tube with sugar, yeast and distilled water mixture as seen from above.
The line between A and B indicates the diameter of the mixture within the test-tube.
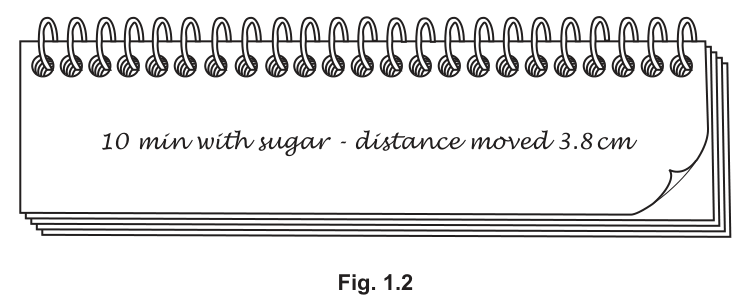
In this investigation a different mass of sugar was used. Fig. 1.2 shows a result recorded in a student's notebook.
Measure and record the length of the line between A and B.
diameter of mixture within test-tube = ______
Calculate the increase in volume of the mixture in this test-tube after 10 minutes.
Use 3.14 as the value of . Give your answer to 1 decimal place.
Show your working.
volume increase = ______
Working
Measured diameter of the mixture between A and B =
Treating the risen mixture as a cylinder:
Answer
diameter of mixture within test-tube =
volume increase =
diameter = 2.2 cm; volume increase = 14.4 cm³
Walkthrough
First measure the line AB on Fig. 1.1 with a ruler — the accepted measurement is (values from to are accepted). The radius is half the diameter: . The mixture that has risen up the tube is a cylinder: its cross-sectional area is and its height is the distance moved, from the student's notebook in Fig. 1.2. So the increase in volume is , which rounds to to 1 decimal place. The question insists you show the working — the substitution line itself carries a mark.
Key Takeaways
- Volume of a cylinder = .
- Radius = diameter ÷ 2 — forgetting this halves the final answer.
- Use the value of π given in the question (3.14) and round only at the end, to the precision asked for.
Common Mistakes
Using the diameter instead of the radius in (giving about 57.7 instead of 14.4); forgetting to square the radius; rounding too early; omitting the working line.
Things to Be Careful About
The answer must be given to 1 decimal place with the unit . The mark scheme accepts the formula written out with no numbers as evidence of method, and accepts the correct radius once it appears anywhere in the calculation.
Suggest a piece of apparatus that could have been used in this investigation to directly measure the volume of the mixture. Describe how you would determine the increase in volume at each time interval using this apparatus.
apparatus = ______
determination of increase in volume = ______
Answer
apparatus = graduated measuring cylinders (used instead of test-tubes)
determination of increase in volume = read the starting volume of the mixture, then read the volume at each time interval and subtract the starting volume from the volume at each time interval
Graduated measuring cylinders; subtract the starting volume from the volume at each time interval
Walkthrough
Measuring cylinders have a graduated scale printed on them, so the volume of liquid inside can be read directly — unlike a plain test-tube, where volume had to be worked out from a measured height and diameter. If the yeast mixtures are set up in measuring cylinders, you simply read the volume of the mixture at the start and again at each time interval; the increase in volume at each interval is the reading at that time minus the starting volume.
Key Takeaways
Graduated apparatus (measuring cylinders, syringes, burettes) allows direct volume readings; a change in volume is always found by subtraction from the initial value.
Common Mistakes
Naming a beaker or conical flask (not graduated precisely enough); describing how to read the cylinder but not how to get the increase (the subtraction step is a separate mark).
Things to Be Careful About
Both lines are needed: the apparatus mark and the determination-of-increase mark are scored separately.
When organisms respire aerobically they use oxygen and produce carbon dioxide.
Some students investigated the rate at which germinating seeds respired, using the apparatus in Fig. 2.1.
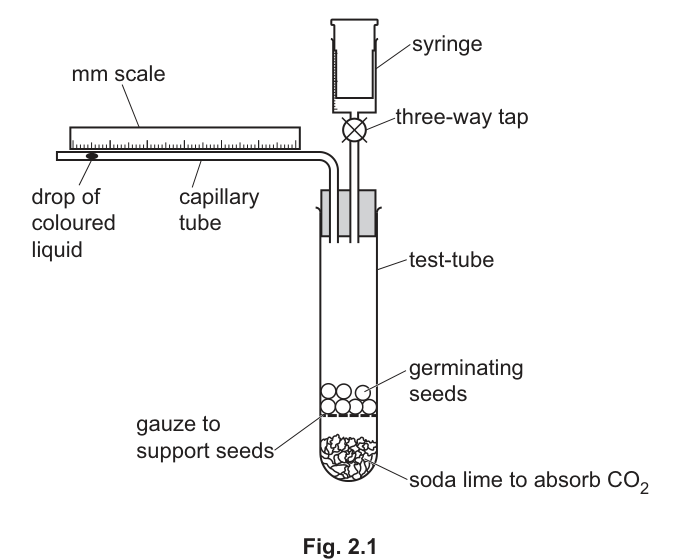
Carbon dioxide produced by the germinating seeds was absorbed by the soda lime. As oxygen was used the volume of gas in the apparatus reduced and the drop of coloured liquid moved along the capillary tube towards the seeds.
The students moved the drop of coloured liquid in the capillary tube to the beginning of the scale () by opening the three-way tap and using the syringe to carefully push air into the apparatus. They then closed the tap.
This was the starting position for the drop of coloured liquid. Its position on the scale was recorded over the next four minutes. The movement of the drop of coloured liquid indicates the rate of respiration of the seeds.
The students' results are shown in Table 2.1.
Table 2.1
| time / minutes | position of drop of coloured liquid / |
|---|---|
| 0 | 0 |
| 1 | 18 |
| 2 | 36 |
| 3 | 54 |
| 4 | 72 |
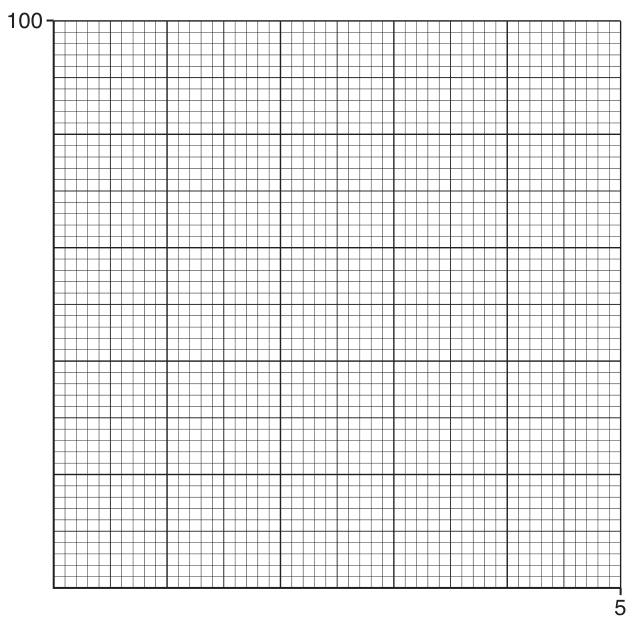
Construct a line graph of the data in Table 2.1 on the grid. The values for the end points of the axes are shown on the grid. Draw a straight line of best-fit to connect the points.
Answer
- x-axis: time / minutes, linear scale 0 to 5; y-axis: position of drop of coloured liquid / mm, linear scale 0 to 100.
- Five points plotted at (0, 0), (1, 18), (2, 36), (3, 54), (4, 72), each marked with a small cross.
- A single straight ruled line drawn through all five points.
Line graph of position of drop against time with fully labelled axes, five correctly plotted points and a straight ruled line of best fit
Walkthrough
The data in Table 2.1 give the position of the coloured drop at each minute. Time is the independent variable so it goes on the x-axis, and the position of the drop is the dependent variable on the y-axis. The grid end points are printed as 5 on the x-axis and 100 on the y-axis, so use linear scales starting at 0 at the origin: 1 minute per large division on the x-axis and 20 mm per large division on the y-axis works neatly. Plot each of the five pairs of values as a small, neat cross — never a dot left unmarked or a large blob. Because the drop moves the same distance each minute (18 mm per minute), the points lie on a straight line, so a single straight ruled line through all five points is the line of best fit. Every axis needs a full label naming the quantity AND its unit: 'time / minutes' and 'position of drop of coloured liquid / mm'.
Key Takeaways
- On a graph the independent variable (what was changed, here time) goes on the x-axis and the dependent variable (what was measured) on the y-axis.
- Axes must be labelled with the quantity and its unit, in the slash form 5090 uses (time / minutes).
- Points are plotted as small crosses or encircled dots, and a line of best fit may be ruled straight if the points are linear.
Common Mistakes
- Omitting the unit from an axis label — 'time' alone does not score the labelling mark; it must be 'time / minutes'.
- Using a non-linear scale or one that does not start at 0 at the origin.
- Joining the points dot-to-dot with a zig-zag instead of drawing one straight ruled line — the scheme wants a 'single straight ruled line through all points'.
- Plotting points as large dots or leaving them unmarked so they cannot be checked.
Things to Be Careful About
- Both axes must be FULLY labelled including units — that is one whole mark.
- The scale must be linear with a value at the origin of both axes — another whole mark.
- Use the printed end points (5 and 100); do not rescale the grid.
- Plot all five points, including (0, 0).
Use your graph to predict the position of the drop of coloured liquid at 5 minutes. Show your working on the graph.
position = ______
Working
Extend the straight line of best fit beyond the last plotted point (4 minutes, 72 mm) up to 5 minutes, using a ruled line, and read across to the y-axis with construction lines.
Answer
position = 90 mm
90 mm
Walkthrough
The question says 'predict', which means go beyond the measured data — extrapolation. Because the points lie on a straight line rising 18 mm each minute, extending the line one more minute to 5 minutes gives 72 + 18 = 90 mm. On the graph you show this by ruling the line of best fit onwards to the 5-minute position and drawing construction lines (dashed lines are fine) from 5 on the x-axis up to the line and across to the y-axis, so the examiner can see where your reading came from. The mark scheme accepts 90 ± 1 mm, so 89, 90 or 91 all score.
Key Takeaways
- Extrapolation means extending the line of best fit beyond the plotted points to predict a value.
- Show construction lines on the graph so the reading can be checked.
- A linear trend lets you predict reliably; a curved trend would not.
Common Mistakes
- Reading from a curve or a dot-to-dot join rather than the ruled straight line.
- Forgetting to show the extrapolation and construction lines on the graph — that is a separate mark from the value.
- Giving an answer outside the accepted 89–91 mm range, usually from misreading the scale.
Things to Be Careful About
- The mark scheme explicitly wants the line 'extrapolated on graph' — the working must be visible on the grid, not done mentally.
- The unit mm is already printed on the answer line, but the value must be within 90 ± 1.
Use the result at 4 minutes in Table 2.1 to calculate the rate of movement of the drop of coloured liquid caused by the respiration of the seeds.
rate of movement = ______
Working
Answer
rate of movement = 18 mm per minute
18 mm per minute
Walkthrough
A rate is always 'how much per unit time'. The question tells you to use the 4-minute result: the drop moved 72 mm in 4 minutes, so divide 72 by 4 to get 18. The unit follows automatically from the division — mm divided by minutes gives mm per minute — and the mark scheme awards a separate mark for the unit, so '18' alone loses half the credit. Note the drop moves at a constant rate (18 mm every minute in the table), which is why the graph was a straight line.
Key Takeaways
- rate = distance (or change) ÷ time.
- A rate answer is incomplete without its unit; here mm per minute.
- Using the 4-minute total gives the same rate as any single minute because the movement is uniform.
Common Mistakes
- Giving 18 with no unit — the unit is a separate mark.
- Writing the unit as 'mm' or 'minutes' instead of 'mm per minute'.
- Dividing by the wrong time (e.g. using 1 minute's data with the 4-minute distance).
Things to Be Careful About
- The mark scheme accepts 'mm / minute' — the slash form. Write the unit exactly in that style.
- Use the result at 4 minutes as instructed; other pairs of values happen to give the same answer here, but follow the instruction.
Plan an investigation to determine the effect of temperature on the rate of respiration in germinating seeds. Use the apparatus in Fig. 2.1 in your plan.
Answer
- Place the respirometer (Fig. 2.1) with germinating seeds in a water-bath at a chosen temperature, e.g. .
- Use at least three temperatures, e.g. , and (all below ).
- At each temperature, allow time for the apparatus and seeds to come to the temperature of the water-bath before taking measurements.
- Use the syringe and three-way tap to move the drop of coloured liquid to at the beginning of the scale, then close the tap.
- Record the distance moved by the drop on the scale with time (or the distance moved after a fixed time).
- Keep the seeds the same: same mass / number of seeds and same stage of germination at each temperature.
- Repeat at each temperature and calculate a mean distance moved.
- Calculate the rate of movement of the drop (mm per minute) for each temperature and compare.
- Conclusion: state how rate of respiration changes with temperature (e.g. rate increases with temperature up to an optimum).
See working — a plan using a water-bath at three or more temperatures below 70 °C, with temperature equilibration, resetting the drop, timed measurements, controlled seed mass/stage, repeats with a mean, calculated rates and a stated conclusion
Walkthrough
This is the classic 6-mark planning question: the mark scheme lists nine creditable points and you need any six, so aim to cover every category. The independent variable is temperature — you must name at least three values, and they must be below because above that the enzymes in the seeds would denature and respiration would stop, making the results meaningless. A water-bath is how you control and set the temperature. A key practical detail: the apparatus and seeds must be given time to reach the water-bath temperature before you start timing, otherwise the early readings are taken at the wrong temperature. Then follow the same procedure as the original experiment — reset the drop to 0 mm with the syringe and three-way tap, and record how far it moves with time. The controlled variables are the seeds themselves: same mass or number, same stage of germination, because more seeds or more active seeds respire faster regardless of temperature. Repeats and a mean improve reliability, and calculating a rate for each temperature lets you compare them fairly. Finally, state a conclusion — the expected pattern is that the rate rises with temperature up to an optimum, because enzyme-controlled respiration speeds up as molecules gain kinetic energy.
Key Takeaways
- A full plan names the independent variable with at least three values, the dependent variable and how it is measured, the controlled variables, the procedure, repeats with a mean, and a conclusion.
- Temperatures must stay below about because enzymes denature above their optimum.
- A water-bath is the standard way to set and maintain a temperature in plant/seed experiments.
- Rate = distance moved by the drop ÷ time, in mm per minute.
Common Mistakes
- Suggesting only two temperatures, or temperatures at or above — the scheme explicitly requires at least three below .
- Omitting the equilibration step (letting the apparatus come to temperature before measuring) — this is a separate mark.
- Forgetting to reset the drop to the start of the scale at each temperature.
- Naming 'temperature' as a controlled variable by mistake — it is the independent variable here.
- Giving vague reliability answers like 'to be more accurate' instead of 'repeat and calculate a mean'.
- Stopping at the results without stating a conclusion — the conclusion is its own mark.
Things to Be Careful About
- Write the plan as a short numbered method a candidate could follow, not as prose.
- Use the apparatus in Fig. 2.1 — the water-bath surrounds the test-tube; the syringe, three-way tap, capillary tube and scale are already part of the set-up.
- 'Same seeds / mass / number of seeds / stage of germination' — any one of these controlled variables scores, but you must state it explicitly.
- Nine points are listed for six marks, so extra correct points are your insurance; cover as many categories as you can.
Fig. 3.1 shows the whole of a one-seeded fruit of a dandelion flower. A single dandelion flowerhead can produce up to 200 of these one-seeded fruits. The mass of a single fruit is .
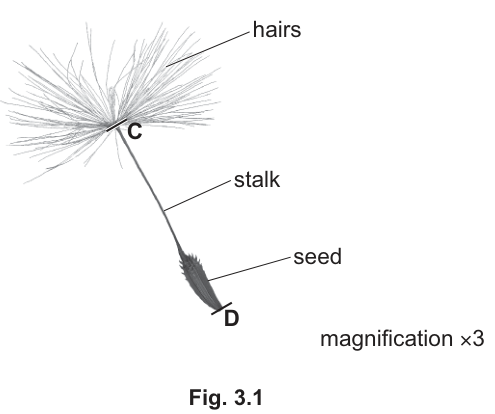
Answer
Large pencil drawing of the whole dandelion fruit, at least 80 mm from top of stalk to base of seed, with the parachute of hairs, a double-lined stalk longer than the seed, and a delimited tapered seed with double-lined hooks on the top half only.
Walkthrough
This is a classic 'make a large drawing' mark block, and most of the marks are for HOW you draw, not WHAT you draw.
- Line quality (1 mark). Use a sharp HB pencil and draw one clear, continuous outline. Never sketch in a series of small strokes, never go over lines, and never use shading, stippling or cross-hatching — biological drawings show structure with lines only.
- Size (1 mark). The scheme demands a minimum length of 80 mm for the stalk plus seed. Measure with a ruler before you commit: a drawing that is too small loses the mark outright, and 'large' means filling the space provided.
- Proportions (1 mark). The stalk must be drawn as a DOUBLE line (two parallel lines, because a real stalk is a three-dimensional tube) and it must be clearly LONGER than the seed, matching the photograph. The parachute of fine hairs radiates from the top of the stalk.
- Detail (1 mark). The seed must be delimited (a clear outline showing where it begins and ends) and tapered towards the base. The small hooks on the seed are drawn with double lines, and they appear only on the TOP half of the seed — copying them onto the whole seed loses the detail mark.
Key Takeaways
- A biological drawing is a line drawing: sharp pencil, continuous lines, no shading.
- 'Large' is always a stated minimum size — check it with a ruler.
- Tubes and stalks are drawn with double lines; single lines are for flat surfaces.
- Copy only the detail the scheme names, in the right place — extra or misplaced detail can cost the mark.
Common Mistakes
- Shading or stippling the seed to show it is dark — this loses the line-quality mark.
- Drawing the stalk as a single line — the scheme requires a double line.
- Making the seed longer than the stalk — proportions must match Fig. 3.1.
- Drawing hooks over the whole seed — the scheme specifies hooks only on the top half.
- A drawing under 80 mm — the size mark is lost entirely.
Things to Be Careful About
- The scheme joins requirements with '+': 'seed delimited and tapered + hooks drawn with double lines + hooks only on top half' is ONE mark needing all three elements.
- Draw the whole fruit including the parachute of hairs, since the question says 'the whole fruit'.
- Keep the drawing in the same orientation as the figure (hairs at the top, seed pointing down).
The lines C and D indicate the total length of the seed and stalk. Draw a straight line on Fig. 3.1 to join C and D. Measure the length of the line and record it.
______
Calculate the actual length of the seed and stalk and record it to the nearest whole number.
______
Working
Draw a straight line on Fig. 3.1 joining C to D and measure it with a ruler.
Answer
Measured length of line C to D = 36 mm
Actual length of the seed and stalk = 12 mm
12 mm (measured line 35–37 mm, divided by magnification 3, to the nearest whole number)
Walkthrough
The figure is magnified ×3, so everything in it is three times bigger than in real life. To get the real length you must divide by the magnification, not multiply.
- Draw the line. Use a ruler to draw one straight line from C (the base of the hairs) to D (the base of the seed). The scheme requires the line to be straight — a bent line following the stalk would not score.
- Measure it. Any value in the accepted range 35–37 mm scores. Your own printout may differ slightly, so measure your own figure.
- Divide by the magnification.
- Round to the nearest whole number as the question demands — the answer line ends in 'mm' with no decimals requested.
Key Takeaways
- actual size = image size ÷ magnification; magnification = image size ÷ actual size.
- The magnification is printed on the figure — always look for it before calculating.
- Draw construction lines exactly as instructed (straight, between the named points).
Common Mistakes
- Multiplying by 3 instead of dividing — that gives 108 mm, which is impossible for a dandelion fruit.
- Drawing a curved line following the stalk instead of a straight line between C and D.
- Giving a decimal answer (12.0 mm) when the question asks for the nearest whole number.
- Forgetting the unit mm.
Things to Be Careful About
- The mark scheme accepts a measured line of 35–37 mm; any value in that range divided correctly by 3 scores.
- The scheme awards the marks as: line drawn + measurement in mm; the division shown; the correct whole-number answer. Show all three steps.
- ecf applies: if your measurement is slightly off but you divide it correctly by 3, you can still earn the later marks.
Identify two features of this fruit that show it is adapted for dispersal by wind. Explain your answers.
- ______
- ______
Answer
- The fruit has a very low mass (it is light and small), so it is easily carried by the wind.
- It has a parachute of fine hairs, which increases the surface area and acts like a parachute so the fruit glides and stays airborne for longer.
Low mass so easily carried by wind; hairs increase surface area / act as a parachute to help it glide
Walkthrough
Wind dispersal works by keeping a fruit airborne so the wind can carry it away from the parent plant. Two features of the dandelion fruit do this:
- Low mass. The fruit weighs only 0.0005 g. The lighter an object is, the more easily air currents can pick it up and carry it — so the tiny mass is the adaptation, and 'easily carried by the wind' is the explanation.
- The hairy parachute. The crown of fine hairs at the top of the stalk greatly increases the surface area presented to the air and acts like a parachute, slowing the fall so the fruit glides and drifts on the breeze rather than dropping straight down.
Notice the mark scheme joins each feature to its explanation with '+': naming the feature alone does not score — you must say what it does.
Key Takeaways
- Adaptation questions need the structure AND its function: feature + effect.
- Wind-dispersed fruits are typically light with a large surface area (parachutes, wings).
Common Mistakes
- Writing only 'it has hairs' or 'it is light' without the explanation — each mark needs both halves.
- Saying the hairs 'catch the wind' without linking to surface area or the parachute effect.
- Describing animal dispersal features (hooks for fur) — the hooks on this seed are minor; the dispersal adaptation asked for is the wind one.
Things to Be Careful About
- Give exactly two features, as the question asks for two numbered answers.
- Use the data given: the mass 0.0005 g supports the 'low mass' point — quoting it strengthens the answer.
- 'Increase surface area' and 'act like a parachute' are the scheme's accepted explanations for the hairs; either scores.