Biology 5090/22 — October/November 2024
Cambridge O-Level · Theory · worked solutions for every part, with the mark scheme
Topics Classification · Coordination and Control · Disease and Immunity · Biological Molecules · Sexual Reproduction in Humans · Transport in Humans · +8 more
Use the dichotomous key in Fig. 1.1 to identify the five main vertebrate groups, A, B, C, D and E.
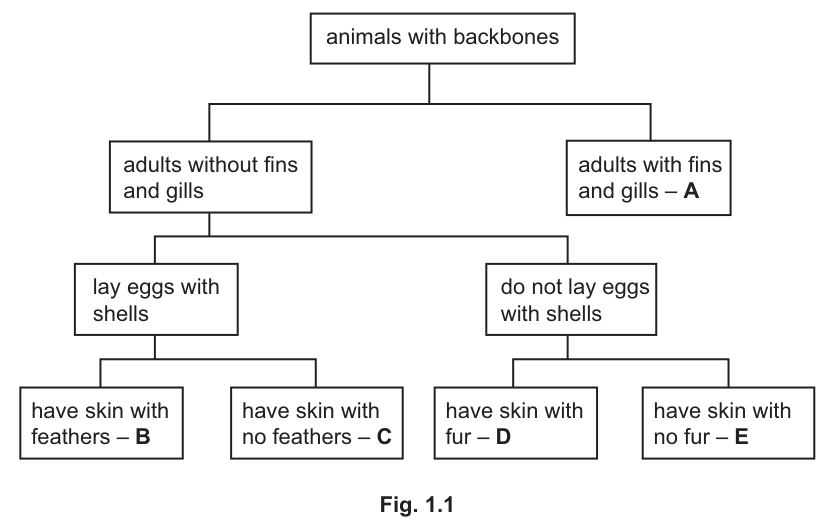
Complete Table 1.1.
Table 1.1
| letter in key | name of vertebrate group |
|---|---|
| A | |
| B | |
| C | |
| D | |
| E |
Answer
| letter in key | name of vertebrate group |
|---|---|
| A | fish |
| B | birds |
| C | reptiles |
| D | mammals |
| E | amphibians |
A: fish, B: birds, C: reptiles, D: mammals, E: amphibians
Walkthrough
The question provides a dichotomous key (Fig. 1.1) starting with "animals with backbones" (vertebrates). We follow the branches from top to bottom, matching the characteristics to identify each group A–E.
- Start at "animals with backbones". The first split is between "adults with fins and gills" and "adults without fins and gills". Group A is the one with fins and gills, which is fish.
- For the remaining groups (adults without fins and gills), the next split is between "lay eggs with shells" and "do not lay eggs with shells".
- Following "lay eggs with shells", we split again based on skin covering: "have skin with feathers" gives group B, which is birds. "have skin with no feathers" gives group C, which is reptiles.
- Following "do not lay eggs with shells", we split based on skin covering: "have skin with fur" gives group D, which is mammals. "have skin with no fur" gives group E, which is amphibians.
Key Takeaways
- A dichotomous key uses a series of paired choices to identify organisms step by step.
- The five main vertebrate groups are fish, amphibians, reptiles, birds, and mammals, distinguished by features such as gills vs lungs, skin covering (scales, feathers, fur, moist skin), and egg type.
Common Mistakes
- Confusing reptiles and amphibians: reptiles lay eggs with leathery or hard shells on land, while amphibians lay jelly-like eggs in water and have moist skin without fur or feathers.
- Confusing birds and reptiles: both lay eggs with shells, but birds have feathers while reptiles have scales (no feathers).
- Misspelling group names (e.g., "mammals" instead of "mammal", "amphibians" instead of "amphibian"). The mark scheme requires the plural group names.
Things to Be Careful About
- Follow the key strictly from top to bottom. Do not skip steps.
- Ensure the names of the vertebrate groups are spelled correctly and in the plural form as required by the table header "name of vertebrate group".
- "fish" is the correct plural group name (singular is also fish), while "birds", "reptiles", "mammals", and "amphibians" are standard plural group names.
A virus is a type of pathogen.
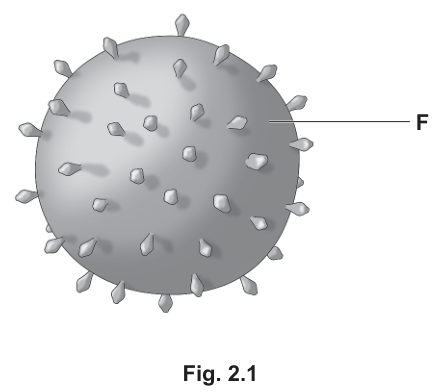
Fig. 2.1 shows the external structure of a virus.
Answer
protein coat
protein coat
Walkthrough
The question asks to identify component F in the diagram of a virus. Viruses have a simple structure consisting of genetic material (DNA or RNA) surrounded by a protective outer layer. In the diagram, F points to the main spherical body of the virus, which is the protein coat (also called the capsid). The spike-like structures extending from the surface are glycoproteins used for attachment to host cells, but F is pointing to the coat itself.
Key Takeaways
A virus is not a cell. It has no cytoplasm, organelles, or cell membrane. Its basic structure is always genetic material (DNA or RNA) enclosed in a protein coat (capsid). Some viruses also have an outer lipid envelope and surface glycoprotein spikes.
Common Mistakes
- Writing "capsid" instead of "protein coat". While technically correct in university biology, Cambridge O Level (5090) specifically expects the term protein coat as printed in the mark scheme.
- Pointing to a spike and calling it the protein coat. The spikes are glycoproteins; the main sphere is the protein coat.
Things to Be Careful About
Always match the mark scheme's exact wording. The scheme awards the mark for protein coat; avoid vague terms like "shell" or "outer layer". If the label had pointed to the interior, the answer would be genetic material, DNA, or RNA.
Answer
genetic material (or DNA / RNA)
genetic material
Walkthrough
Fig. 2.1 shows the external structure of a virus. We have just identified the protein coat. The other essential component of a virus is its genetic material, which can be either DNA or RNA (single-stranded or double-stranded). This genetic material is located inside the protein coat and is not visible in an external diagram like Fig. 2.1.
Key Takeaways
All viruses contain two main components: a protein coat (capsid) and genetic material (DNA or RNA). The genetic material carries the instructions for making new virus particles once inside a host cell.
Common Mistakes
- Writing "nucleus" or "nucleic acid". Viruses do not have a nucleus. While genetic material is a nucleic acid, the mark scheme specifically accepts genetic material, DNA, or RNA.
- Suggesting "organelles" or "ribosomes". Viruses have no organelles; they hijack the host cell's ribosomes to make viral proteins.
Things to Be Careful About
The question asks for a component not shown in the figure. Since the figure is an external diagram, any internal component is a valid answer. Stick to the simplest, most direct answer: genetic material.
Pathogens may be transmitted to humans either by direct contact or indirectly.
List two of the human body’s barriers to the entry of pathogens.
- ______
- ______
Answer
- skin (or epidermis)
- mucus (or hairs in nose / nostrils, or stomach acid)
skin and mucus
Walkthrough
The question asks for two barriers that prevent pathogens from entering the body. These are part of the non-specific immune system (innate immunity) and include both physical and chemical barriers.
From memory, the main barriers are:
- Skin (epidermis): An intact, tough, waterproof physical barrier.
- Hairs in the nose / nostrils: Trap dust and pathogens from inhaled air.
- Mucus: Produced by goblet cells in the respiratory tract; traps pathogens.
- Stomach acid (hydrochloric acid): A chemical barrier that kills many pathogens swallowed with food.
- Tears and saliva: Contain lysozyme, an enzyme that breaks down bacterial cell walls.
- Ear wax: Traps dust and pathogens in the ear canal.
Any two of these will score the marks.
Key Takeaways
The body has first-line (non-specific) defences that prevent pathogens from entering. These are always present and do not require prior exposure to a specific pathogen. They include physical barriers (skin, hairs), chemical barriers (acid, lysozyme), and trapping mechanisms (mucus, wax).
Common Mistakes
- Writing "white blood cells" or "antibodies". These are part of the second-line (specific) immune response, which acts after a pathogen has already entered the body.
- Writing "fever" or "inflammation". These are internal responses to infection, not barriers to entry.
- Writing "hand washing" or "vaccination". These are external preventative actions, not body barriers.
Things to Be Careful About
The command word is List, so simply writing two correct items is sufficient; no explanation is needed. Ensure the items are actual body barriers (e.g., "skin" not "wearing clothes"). The mark scheme accepts skin / epidermis, hairs + in nose / nostrils, mucus, and stomach acid.
If a virus is able to pass through the body’s barriers, an immune response takes place.
Antibodies are produced during this immune response.
Name four chemical elements that will always be present in an antibody molecule.
______ ______ ______ ______
Answer
carbon, hydrogen, oxygen, nitrogen
carbon, hydrogen, oxygen, nitrogen
Walkthrough
Antibodies are proteins (specifically, globular proteins called immunoglobulins). To name the elements in an antibody, we need to recall the elemental composition of proteins.
All proteins are made of amino acids. Every amino acid contains:
- Carbon (C)
- Hydrogen (H)
- Oxygen (O)
- Nitrogen (N)
Many amino acids (like cysteine and methionine) also contain Sulfur (S), which allows disulfide bonds to form and stabilise the protein's 3D shape.
The question asks for four elements. The four universal elements in all proteins are C, H, O, N. Including sulfur is also correct and will score, but C, H, O, N are the essential four.
Key Takeaways
- Carbohydrates: C, H, O
- Lipids: C, H, O (some phospholipids also have P and N)
- Proteins: C, H, O, N (+ S in some)
- DNA: C, H, O, N, P
Antibodies are proteins, so they contain C, H, O, N, and often S.
Common Mistakes
- Writing "phosphorus" or "P". Phosphorus is found in DNA, RNA, ATP, and phospholipids, but not in the standard amino acids that make up antibodies.
- Writing "calcium" or "iron". These are mineral ions, not elements that make up the organic molecule itself.
- Forgetting nitrogen. Nitrogen is the key element that distinguishes proteins from carbohydrates and lipids.
Things to Be Careful About
The mark scheme awards 2 marks for all four correct, and 1 mark for three correct. You must name exactly four elements. The five acceptable elements are carbon, hydrogen, oxygen, nitrogen, sulfur. Choose the four most universal ones (C, H, O, N) to be safe.
Explain how the structure and function of an antibody molecule are important in an immune response.
Answer
- Pathogens have antigens on their surface.
- Antibodies are specific to these antigens.
- The antibody has a complementary shape (or structure) to the antigen.
- The antibody binds to the antigen, forming an antibody-antigen complex.
- This marks the pathogen for destruction, clumps pathogens together, or allows them to be engulfed by phagocytes (macrophages).
Working
| Point | Explanation |
|---|---|
| 1 | Pathogens possess antigens |
| 2 | Antibodies are specific |
| 3 | Complementary shape / fits antigen |
| 4 | Binds to antigen / complex formed |
| 5 | Destroys / marks / clumps / engulfed by phagocytes |
See working
Walkthrough
This is a 5-mark explanation question. We need to describe how an antibody's structure enables its function in the immune response. Let's break it down step-by-step:
Step 1: The target.
Pathogens (viruses, bacteria) have foreign proteins on their surface called antigens. These act as identifiers that the immune system recognises as non-self.
Step 2: Specificity.
B lymphocytes produce antibodies that are specific to a particular antigen. Each antibody is designed to target only one type of pathogen.
Step 3: Structure.
The antibody molecule has a Y-shape with an antigen-binding site at the tip of each arm. This site has a complementary shape (or structure) to the specific antigen, like a lock and key.
Step 4: Binding.
Because of this complementary shape, the antibody binds to the antigen, forming an antibody-antigen complex.
Step 5: Consequence (Function).
Once bound, the antibody neutralises the pathogen in several ways:
- It can directly destroy the pathogen (e.g., by disrupting its cell membrane or blocking its ability to enter cells).
- It marks the pathogen (opsonisation), making it easier for phagocytes to recognise and engulf it.
- It causes pathogens to clump together (agglutination), which also aids engulfment by phagocytes.
Any five of these linked points will score full marks.
Key Takeaways
Antibodies are Y-shaped proteins with a specific antigen-binding site. Their function relies on the lock-and-key relationship between the antibody's shape and the pathogen's antigen. Binding leads to neutralisation, clumping, or marking for phagocytosis.
Common Mistakes
- Saying "antibodies kill all pathogens". Antibodies are specific; they only bind to the antigen they were made against.
- Forgetting to mention antigens. The explanation must start with the pathogen having antigens for the antibody to bind to.
- Saying "antibodies destroy bacteria" without explaining how (e.g., by marking them for phagocytes, clumping them, or forming a complex). The mark scheme requires the mechanism (binding, marking, clumping, engulfment).
- Writing "antibodies eat the pathogen". Antibodies do not engulf pathogens; phagocytes (macrophages) do. Antibodies mark them for engulfment.
Things to Be Careful About
The mark scheme awards marks for specific connections:
- MP2 (specific) and MP3 (complementary shape) must be in connection to antigen or antibody.
- You need five distinct points. Don't just say "it binds and destroys"; break it down: binds to antigen -> forms complex -> marks/clumps -> engulfed by phagocytes.
- Use the term antibody-antigen complex if possible, as it is a precise 5090 term.
The average length of pregnancy in an adult human is 40 weeks.
A human mother may give birth to her baby before the end of the usual length of pregnancy. This is known as a premature birth.
Suggest why babies born prematurely are at higher risk of developing some infectious diseases than babies born after 40 weeks of pregnancy.
Answer
Babies born prematurely have not had enough time to receive antibodies from the mother across the placenta. As a result, they have fewer antibodies (less passive immunity) and are more vulnerable to infections.
See working
Walkthrough
The question asks why premature babies are at higher risk of infectious diseases. We need to link the length of pregnancy to the baby's immune defences.
During a normal 40-week pregnancy, the mother's immune system produces antibodies against various pathogens. These maternal antibodies can cross the placenta and enter the baby's bloodstream. This gives the baby passive immunity (immunity provided by another individual) before birth and for several months after birth.
If a baby is born prematurely (before 40 weeks), this transfer of antibodies across the placenta has not had enough time to occur. Therefore, the baby is born with fewer antibodies and lacks the passive immunity that would normally protect them in the first few weeks of life.
Key Takeaways
- Passive immunity is the transfer of antibodies from mother to baby.
- Antibodies cross the placenta during pregnancy.
- A full-term baby (40 weeks) receives a good supply of maternal antibodies; a premature baby does not.
- Passive immunity is temporary; the baby must eventually produce its own antibodies through active immunity (e.g., via vaccination or natural infection).
Common Mistakes
- Saying "the baby's immune system is not fully developed". While true, the mark scheme specifically looks for the link to antibodies and the placenta. The primary reason for increased infection risk in the weeks after birth is the lack of transferred maternal antibodies.
- Writing "the baby hasn't been vaccinated". Vaccination is an active immunity measure and is not the primary reason for increased risk specifically due to prematurity in the context of maternal transfer.
- Forgetting to mention across the placenta. The mark scheme accepts "across placenta" as a key point.
Things to Be Careful About
The mark scheme awards 2 marks for:
- fewer antibodies (or less passive immunity)
- across placenta (or from mother / transfer during pregnancy)
Make sure both ideas are present: the baby has fewer antibodies because they haven't been transferred across the placenta yet. Don't just write "fewer antibodies"; explain why.
Suggest one action that a mother can take to protect her premature baby from infection in the weeks after birth.
Answer
breast feed the baby (or vaccinate the child / mother)
breast feed the baby
Walkthrough
The question asks for one action a mother can take to protect her premature baby from infection after birth. Since the baby missed out on maternal antibodies crossing the placenta, the mother needs to provide them another way.
Breast milk (colostrum and mature milk) contains antibodies (specifically IgA) that are passed to the baby through breastfeeding. This provides the baby with passive immunity in the gut and respiratory tract, protecting against infections in the weeks after birth.
Alternatively, the mother can ensure the baby is vaccinated according to the immunisation schedule, though this takes time to build active immunity. The most direct and immediate source of antibodies for a newborn is breast milk.
Key Takeaways
- Breast milk contains maternal antibodies, providing passive immunity to the baby after birth.
- Colostrum (the first milk) is particularly rich in antibodies and is crucial for newborn immunity.
- Vaccination provides active immunity but takes time to develop; breast milk provides immediate passive immunity.
Common Mistakes
- Writing "keep the baby in a sterile room". While this reduces exposure, it doesn't provide biological protection (antibodies) and is not the accepted mark scheme answer.
- Writing "give the baby antibiotics". Antibiotics treat bacterial infections; they do not protect against viruses or provide immunity.
- Writing "wash hands". This is a general hygiene practice, not a direct protective action for the baby's immune system.
Things to Be Careful About
The command word is Suggest, so any reasonable action that provides immunity or reduces infection risk is acceptable. The mark scheme specifically accepts breast feeding or vaccinate child. Stick to these to guarantee the mark. Ensure the action is something the mother can take (e.g., "breast feed" not "the hospital vaccinate").
Use words from the list to complete the paragraph.
platelets glucagon pancreas plasma
liver sucrose endocrine
pituitary insulin glycogen
Glucose is transported in solution by the component of blood called ______ . If the concentration of glucose in the blood increases above normal, the hormone ______ is released into the blood by an ______ gland called the ______ . This hormone promotes the removal of glucose from the blood and its conversion into the chemical ______ .
Answer
Glucose is transported in solution by the component of blood called plasma. If the concentration of glucose in the blood increases above normal, the hormone insulin is released into the blood by an endocrine gland called the pancreas. This hormone promotes the removal of glucose from the blood and its conversion into the chemical glycogen.
plasma; insulin; endocrine; pancreas; glycogen
Walkthrough
This is a gap-fill using a word list, so every blank must be filled with one of the nine words given — no outside vocabulary is needed.
-
First blank: glucose is dissolved in the liquid part of blood. Blood has cells (red cells, white cells, platelets) suspended in plasma, which is the straw-coloured fluid that transports dissolved substances such as glucose, amino acids, urea and carbon dioxide. 'Platelets' is the distractor here — platelets are cell fragments for clotting, not transport.
-
Second blank: when blood glucose rises above normal, the body must lower it. The hormone that does this is insulin. (Its partner, glucagon, raises blood glucose when it is too low — a classic trap.)
-
Third blank: insulin is made by a ductless gland that secretes hormones directly into the blood — an endocrine gland. This contrasts with exocrine glands (like salivary glands), which release their products through ducts.
-
Fourth blank: the specific endocrine gland is the pancreas — its islets secrete insulin (from beta cells) and glucagon (from alpha cells). The pituitary is also endocrine but controls other hormones, not blood glucose.
-
Fifth blank: insulin makes liver (and muscle) cells take up glucose and convert it to the storage carbohydrate glycogen. Sucrose is a table sugar found in food, not a storage product of animals.
Key Takeaways
- Plasma is the transport medium of blood for dissolved substances.
- Insulin lowers blood glucose: it promotes uptake of glucose and conversion to glycogen in the liver.
- Insulin is secreted by the endocrine tissue of the pancreas directly into the blood.
- Glucagon does the opposite job — raising blood glucose by converting glycogen back to glucose.
Common Mistakes
- Writing glucagon instead of insulin — glucagon raises blood glucose, it does not remove glucose from the blood.
- Writing pituitary instead of pancreas — both are endocrine glands, but only the pancreas controls blood glucose.
- Writing sucrose instead of glycogen — sucrose is a dietary sugar; glycogen is the animal storage carbohydrate.
- Confusing endocrine with exocrine — endocrine glands are ductless and release hormones into the blood.
- Using a word not on the list (e.g. 'blood' or 'liver') — the instruction says to use words from the list only.
Things to Be Careful About
- Each blank scores exactly one mark, so all five must be filled — leaving one blank costs a mark even if the rest are right.
- Use each word once; there are nine words for five blanks, so several are deliberate distractors (platelets, glucagon, pituitary, sucrose, liver).
- Spell 'glycogen' correctly — 'glucagon' is a different hormone entirely.
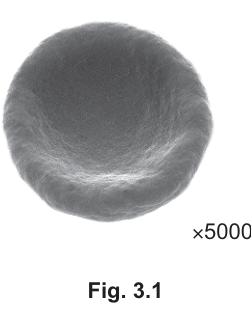
Fig. 3.1 is a photomicrograph of a type of blood cell.
Answer
Red blood cell / erythrocyte
red blood cell
Walkthrough
The photomicrograph shows a single cell at magnification with a smooth, rounded outline and a characteristic dimpled appearance — this is the biconcave disc shape of a red blood cell (erythrocyte). No nucleus is visible, which fits: mature red blood cells lose their nucleus to make more room for haemoglobin. White blood cells would look very different — larger, often irregular or lobed, with a visible nucleus — and platelets are tiny fragments, far smaller than this cell.
Key Takeaways
- Red blood cells are biconcave discs with no nucleus, packed with haemoglobin.
- The biconcave shape gives a large surface area to volume ratio for oxygen diffusion and flexibility to squeeze through capillaries.
- Either name is accepted: red blood cell or erythrocyte.
Common Mistakes
- Calling it a white blood cell — white cells have nuclei and are less regular in shape.
- Calling it a platelet — platelets are much smaller fragments.
- Spelling 'erythrocyte' incorrectly if choosing that alternative.
Things to Be Careful About
- One mark only — give just the name, nothing else needed.
- Both 'red blood cell' and 'erythrocyte' score; pick whichever you can spell confidently.
If the concentration of glucose in the blood increases above normal and is not controlled, this can result in changes to some cells of this type. They may:
- lose their specialised shape
- become less flexible
- stick together with many other cells of the same type.
Suggest and explain how these changes will affect the body.
Answer
- The biconcave shape is lost, so the surface area available for absorbing oxygen is reduced.
- The cells become less able to fit through narrow capillaries.
- The cells stick together, so clotting may occur, blocking blood vessels.
- Less oxygen is absorbed, carried and supplied to tissues (by haemoglobin).
- Therefore less aerobic respiration takes place in body cells.
- So less energy is released for the body's activities.
See working — any five linked effects: reduced surface area, less able to fit through capillaries, clotting, less oxygen carried by haemoglobin, less aerobic respiration, less energy released.
Walkthrough
The question gives you three changes to red blood cells in uncontrolled high blood glucose (as happens in diabetes) and asks you to suggest and explain how they affect the body. The mark scheme lists seven points and asks for five, so build a logical chain:
-
Loss of specialised shape → reduced surface area. A red blood cell's biconcave disc shape exists to maximise surface area for oxygen to diffuse across. If the cell swells and loses that shape, the surface area falls, so less oxygen can be absorbed.
-
Less flexible → cannot fit through capillaries. Capillaries are extremely narrow — often barely wider than a red blood cell. Healthy red cells are flexible and fold slightly to squeeze through. Stiff, swollen cells get stuck, so oxygen delivery to those tissues fails.
-
Sticking together → clotting. Cells clumping together can trigger clot formation inside a vessel, blocking blood flow — dangerous if it happens in a small vessel supplying a vital organ.
-
Less oxygen supplied → less aerobic respiration. Haemoglobin in red blood cells carries oxygen to respiring tissues. With fewer working red cells delivering oxygen, body cells receive less oxygen, so the rate of aerobic respiration falls.
-
Less respiration → less energy. Aerobic respiration releases energy from glucose; with less of it, cells have less energy for their functions — muscle contraction, active transport, growth — so the person feels weak and tired.
Notice how the chain runs: shape → surface area → oxygen uptake → oxygen delivery → respiration → energy. Each link is a separate marking point, which is why five marks are available.
Key Takeaways
- Structure and function: the biconcave shape of red blood cells is an adaptation for maximum oxygen absorption and flexibility through capillaries.
- Oxygen is transported bound to haemoglobin in red blood cells.
- Aerobic respiration requires oxygen and releases energy from glucose — less oxygen means less energy released.
- Uncontrolled diabetes damages red blood cells, reducing oxygen delivery throughout the body.
Common Mistakes
- Stopping at 'less oxygen' without following the chain to respiration and energy — the last two marks sit in those links.
- Saying 'less respiration' without specifying aerobic respiration — anaerobic respiration does not need oxygen, so the precise word matters.
- Omitting haemoglobin — naming the molecule that carries oxygen earns its own point.
- Vague answers like 'the person gets sick' — each point must name a specific effect on a specific process.
- Giving more than five points is fine (extras are ignored), but giving fewer than five loses marks — aim for six to be safe.
Things to Be Careful About
- The command word is 'suggest and explain', so every effect needs its reason — an observation alone ('less oxygen') scores nothing without the consequence ('so less aerobic respiration').
- 'Suggest' signals you apply known biology to an unfamiliar context: use what you know about red blood cell structure and respiration, not memorised diabetes facts.
- Any five of the seven listed points score, so choose the clearest links and write them as complete cause-and-effect statements.
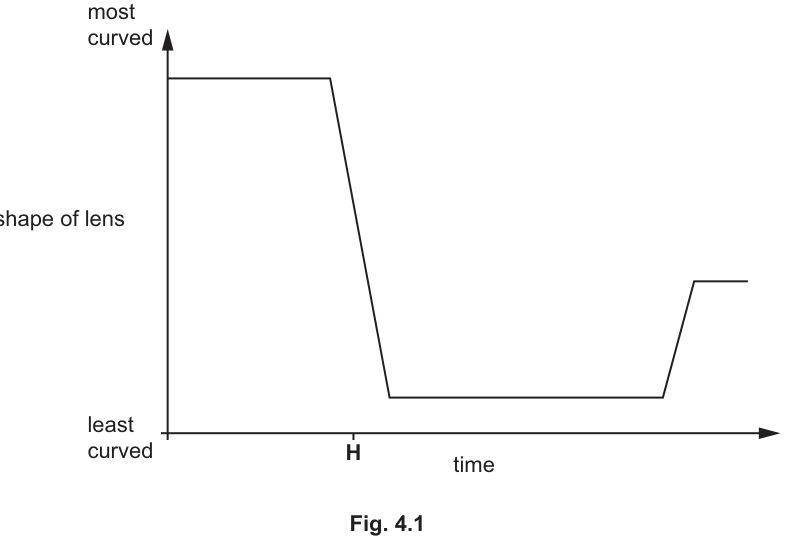
Fig. 4.1 shows changes in the curved shape of the lens of a person’s eye over time.
During the period of time shown in Fig. 4.1, the person carried out each of the following actions:
P read the words in a book
Q read the time on a wall clock
R looked out of a window at a bird high in the sky.
Identify in what order the person carried out actions P, Q and R.
Place the letters P, Q and R in the correct order below.
______ ______ ______
Answer
P → R → Q
P → R → Q
Walkthrough
The graph in Fig. 4.1 plots the curvature of the lens against time. The y-axis shows that a higher position means 'most curved' and a lower position means 'least curved'.
- Start of graph (most curved): The lens is most curved (thickest) to focus on a near object. Action P is reading a book, which is a near object. So P is first.
- At time H (drop to least curved): The lens becomes least curved (flattest) to focus on a very distant object. Action R is looking at a bird high in the sky, which is very far away (infinity). So R is second. This matches the drop to the bottom of the graph.
- End of graph (rise to intermediate level): The lens curvature increases to a level between 'most' and 'least'. This is for an object at a medium distance. Action Q is reading a wall clock. A clock is further away than a book but closer than a bird in the sky. So the lens is less curved than for the book but more curved than for the bird. Thus Q is last.
Correct order: P → R → Q.
Key Takeaways
- Near vision (accommodation): Ciliary muscles contract, suspensory ligaments relax, lens becomes more curved (thicker).
- Distant vision: Ciliary muscles relax, suspensory ligaments tighten, lens becomes less curved (flatter).
- The degree of curvature corresponds to the distance of the object: nearest = most curved, furthest = least curved.
Common Mistakes
- Assuming 'most curved' means looking at a distant object. (It's the opposite: a thicker lens bends light more for near objects).
- Confusing the order of Q and R. A wall clock is closer than a bird in the sky, so the lens for the clock is more curved than for the bird (intermediate vs least curved).
- Forgetting to include the arrows in the sequence.
Things to Be Careful About
- Read the y-axis carefully: 'most curved' is at the top, 'least curved' is at the bottom.
- Ensure the sequence matches the time axis (left to right).
- The mark scheme specifically asks for the letters P, R, Q in order.
At the time labelled H on Fig. 4.1, the shape of the lens is changing. Outline, with reference to named structures in the eye, how this change happens.
Answer
- The ciliary muscles relax.
- This causes the suspensory ligaments (or zonules) to tighten (become taut / under tension).
- The tension pulls on the lens, making it less curved (flatter).
(Note: The question asks for the change at H, where the lens goes from most curved to least curved. This is the transition from near to distant vision.)
Ciliary muscles relax; suspensory ligaments tighten/taut; lens becomes less curved.
Walkthrough
At time H, the graph shows the lens shape changing from 'most curved' to 'least curved'. This represents the eye adjusting from viewing a near object (the book, P) to a distant object (the bird, R).
- Ciliary Muscles: To flatten the lens for distant vision, the ciliary muscles must relax. (Contraction makes the lens rounder for near vision).
- Suspensory Ligaments: When the ciliary muscles relax, the ring they form gets larger (or rather, the tension on the ligaments changes). The suspensory ligaments (also called zonules of Zinn) become taut (tight / under tension).
- Lens Shape: The taut ligaments pull on the equator of the lens, pulling it flat. The lens becomes less curved (flatter).
Mark scheme points:
- Name: ciliary muscles.
- Action: relax.
- Name: suspensory ligaments.
- Action: tighten / become taut / under tension.
Key Takeaways
- Near object: Ciliary muscles contract → ligaments relax → lens thickens/more curved.
- Distant object: Ciliary muscles relax → ligaments tighten → lens thins/less curved.
Common Mistakes
- Saying 'ciliary muscles contract' when the lens is flattening. (Contraction makes it rounder).
- Forgetting to name the structures (ciliary muscles, suspensory ligaments). Just saying 'muscles relax' is not enough.
- Saying the ligaments 'relax' when the muscles relax. (They are linked: muscle relax = ligament tight).
- Using the term 'ciliary body' instead of 'ciliary muscles' (though often accepted, stick to the specific muscle name).
Things to Be Careful About
- The question asks to 'Outline, with reference to named structures'. You must name the ciliary muscles and suspensory ligaments.
- The change is at H, which is a drop in curvature (flattening). Ensure your explanation matches this direction (relax/tighten), not the reverse.
Fig. 4.2 shows a front view of the eye in dim light.
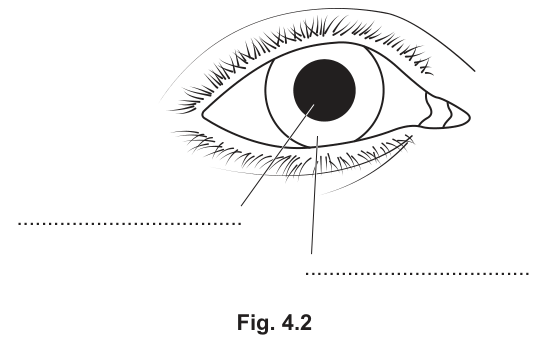
Complete the labels on Fig. 4.2 by naming the two parts of the eye indicated by the label lines.
Answer
- Top label line (pointing to the coloured part): Iris
- Bottom label line (pointing to the central black opening): Pupil
Top: Iris; Bottom: Pupil
Walkthrough
Fig. 4.2 shows a front view of the eye.
- The top label line points to the coloured ring of muscle surrounding the central opening. This is the iris.
- The bottom label line points to the black circular opening in the centre. This is the pupil.
In dim light, the pupil is dilated (large) to let in more light.
Key Takeaways
- Iris: Coloured part, contains muscles that control pupil size.
- Pupil: The hole in the centre that lets light in.
Common Mistakes
- Confusing the iris and the cornea. The cornea is the clear outer layer, not the coloured ring.
- Calling the pupil the 'black spot' instead of the pupil.
- Swapping the labels.
Things to Be Careful About
- Ensure labels match the lines. Top line = Iris, Bottom line = Pupil.
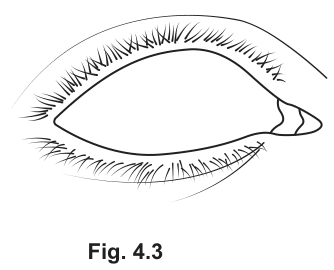
Answer
Drawing: Inside Fig. 4.3, draw the iris (a ring) and a much smaller pupil (a small circle in the centre).
- The iris should be drawn as a ring filling the space between the eyelids and the pupil.
- The pupil diameter should be significantly smaller than in Fig. 4.2 (constricted).
Drawing of eye with constricted (small) pupil.
Walkthrough
Fig. 4.3 is the outline of the eye in bright light.
- In bright light, the pupil reflex causes the pupil to constrict (get smaller) to reduce the amount of light entering the eye.
- The candidate must draw the iris (the coloured part) and the pupil.
- The pupil should be drawn as a small circle (small diameter) in the centre.
- The iris fills the rest of the space inside the eyelids.
Key Takeaways
- Bright light: Pupil constricts (gets smaller).
- Dim light: Pupil dilates (gets larger).
Common Mistakes
- Drawing the pupil larger (that's for dim light).
- Forgetting to draw the iris (just drawing a small black circle is often not enough; the iris needs to be shown as the structure controlling it, or at least the space filled). The mark scheme says 'pupil drawn smaller diameter'. Usually, drawing the iris ring is implied or required.
- Drawing the pupil in the wrong position (it should be central).
Things to Be Careful About
- The drawing must show a clear reduction in pupil size compared to Fig. 4.2.
- Use a sharp pencil, continuous lines, no shading (standard biological drawing rules).
State the type of nervous response that takes place when the eye changes its appearance from that in Fig. 4.2 to that in Fig. 4.3.
______
Answer
Reflex (or reflex action)
Reflex
Walkthrough
The change in pupil size in response to light is an automatic, involuntary response. It does not involve conscious thought. This is called a reflex (or reflex action).
Key Takeaways
- Reflexes are rapid, involuntary responses to stimuli.
- The pupil reflex is a classic example.
Common Mistakes
- Saying 'automatic' (though true, the biological term is reflex).
- Saying 'conscious' (it is involuntary).
- Saying 'hormonal' (it is nervous).
Things to Be Careful About
- Use the precise term 'reflex'.
Answer
- To protect the retina (or light receptors / rod and cone cells).
- From too much light (or high light intensity / bright light).
- (It also allows vision to occur rapidly / adjusts quickly).
(Any two points)
Protects retina from too much light.
Walkthrough
Why do pupils constrict in bright light?
- Protection: The retina contains light-sensitive cells (rods and cones). Too much light can damage these cells. The pupil restricts the amount of light entering.
- Prevent damage/saturation: 'Too much light' or 'high light intensity' can overwhelm the receptors or cause damage.
- Rapid response: The reflex is rapid, allowing immediate adjustment.
Mark scheme points:
- Protect.
- Rapidly (optional but good).
- Retina / rod cells / cone cells / light receptors.
- From too much light / high light intensity.
Key Takeaways
- The pupil regulates light intensity reaching the retina.
- Bright light -> small pupil -> less light -> protection.
Common Mistakes
- Saying 'to see better' (vague).
- Saying 'protect the eye' (too vague, specify retina/receptors).
- Saying 'to stop the light hurting' (not scientific enough).
Things to Be Careful About
- Must mention 'protect' and 'retina/receptors' and 'too much light'.
Fish are an important part of the balanced diet of many people, and fishing is a major source of employment in some countries.
Many people therefore believe that fish should be treated as a sustainable resource.
Answer
A sustainable resource is one that is produced as rapidly as it is removed, so it does not run out.
Produced as rapidly as it is removed; does not run out.
Walkthrough
The definition has two halves, and each half earns its own mark. First, the rate of replacement must match (or exceed) the rate at which the resource is used — for fish, this means enough herring survive and breed to replace those caught. Second, the consequence of that balance: the resource never runs out and can be used indefinitely.
Key Takeaways
- A sustainable resource is harvested no faster than it is replenished.
- Sustainability applies to any renewable resource — timber, fresh water, fish stocks.
Common Mistakes
- Writing only 'it does not run out' — that alone scores one mark; the rate-matching idea is needed for the other.
- Confusing 'sustainable' with 'renewable' without explaining the balance between use and replacement.
Things to Be Careful About
- Give both halves of the definition explicitly; 'produced as rapidly as it is removed' is the marking point, so use wording close to it.
The government of a country decided to set fishing quotas for herring fish between 2012 and 2020.
Fig. 5.1 shows the maximum number of tonnes of herring that the quota allowed to be caught each year.
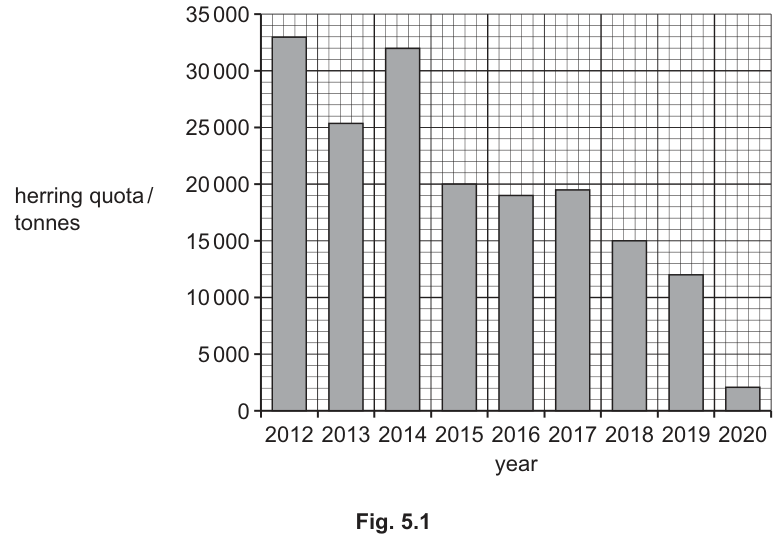
Using the information from Fig. 5.1, describe the trend in quota size and suggest explanations for this trend.
Answer
Description:
- The quota shows an overall decrease from about 33 000 tonnes in 2012 to only 2 000 tonnes in 2020 (with a temporary rise in 2014).
Explanations:
- Overfishing — too many herring were being caught, so the earlier quotas were set too high / were not sustainable.
- The quota was lowered the following year to compensate and allow stocks to recover.
- Fish were being caught before they could breed, so fewer young herring were produced.
- Natural factors such as more predators, disease or competition, or less prey, reduced the herring population.
Overall decrease in quota (e.g. ~33 000 tonnes in 2012 to ~2 000 tonnes in 2020); explained by overfishing / unsustainable quotas, lowering to compensate, fish caught before breeding, or natural causes (predators, disease, competition).
Walkthrough
First describe what the bars show. Read the first bar (~33 000 tonnes in 2012) and the last bar (~2 000 tonnes in 2020): the overall trend is a decrease, even though 2014 rises above 2013 — say 'overall' to cover that fluctuation. A data quote comparing two years earns a mark.
Then suggest why the government kept cutting the quota. The most likely reason is overfishing: catches under the early high quotas exceeded the rate at which herring replaced themselves, so the stock fell. Each year the government lowered the quota to compensate for the shrinking stock and let it recover. Another biological reason is that fishing removes fish before they have bred, so recruitment of young fish falls. Finally, natural factors — increased predation, disease, competition, or a fall in prey — could also reduce the population independently of fishing.
Note the mark scheme caps explanations at three marks, so description (2 marks) + best three explanations = 4 marks total.
Key Takeaways
- Describe trends with an overall statement plus supporting data quotes.
- Quotas are conservation tools: they are cut when stocks decline because previous removal rates were unsustainable.
- Population size depends on both human harvesting and natural factors (predation, disease, competition).
Common Mistakes
- Describing every year individually instead of giving the overall trend.
- Forgetting to quote data — the comparative quote is a separate mark.
- Giving more than three explanations when only three score.
- Saying 'fish are dying out' vaguely instead of naming overfishing or a specific cause.
Things to Be Careful About
- Use the word 'overall' since 2014 breaks the pattern.
- Quote actual values with units (tonnes) and years.
- Explanations must be biological reasons, not restatements of the graph.
Setting fishing quotas is one method used when trying to conserve fish stocks.
Explain how two other named methods can be used to conserve fish stocks.
name of method = ______
explanation
name of method = ______
explanation
Answer
| name of method | explanation |
|---|---|
| education | Teaching fishers and the public why conserving stocks matters makes them more likely to follow rules and fish sustainably. |
| closed seasons | Fishing is banned during the breeding season, so fish can reproduce and stocks recover. |
(Other acceptable pairs: protected areas — no fishing zones allow undisturbed breeding grounds; controlled net types / mesh size — larger mesh lets young fish escape so they can grow and breed; monitoring / enforcement — checking catches ensures quota limits are obeyed.)
Any two named methods (education, closed seasons, protected areas, net/mesh size control, monitoring/enforcement), each with a matched explanation.
Walkthrough
Quotas are only one tool. The syllabus expects you to know several others, and each must be paired with a correct explanation:
- Education — if people understand why stocks must be conserved, they voluntarily comply with regulations.
- Closed seasons — banning fishing during spawning lets adults breed and young fish grow, rebuilding the stock.
- Protected areas (marine reserves) — areas where no fishing occurs act as reservoirs of breeding fish that spread into fished waters.
- Net mesh size — larger holes let small, immature fish escape, so they survive to breed later.
- Monitoring and enforcement — patrols and catch records ensure quotas and rules are actually followed.
Each pair (method + matched explanation) earns 2 marks; you need two pairs for all four marks.
Key Takeaways
- Conservation methods work either by reducing the number caught, protecting breeding fish, or ensuring rules are followed.
- Always link the method to how it helps the stock — a bare name scores only half.
Common Mistakes
- Naming a method but leaving the explanation blank or generic ('to save fish').
- Repeating the quota idea — quotas are already given in the stem.
- Mismatching, e.g. saying mesh size stops overfishing by limiting total tonnage rather than letting young fish escape.
Things to Be Careful About
- Give exactly two methods, each with its own matched explanation.
- Make the mechanism explicit — the explanation mark depends on the biological effect on the fish stock.
Fish are a good source of lipids in the form of fish oil.
A student investigated the digestion of fish oil in the laboratory.
The student set up the two experiments shown in Fig. 5.2.
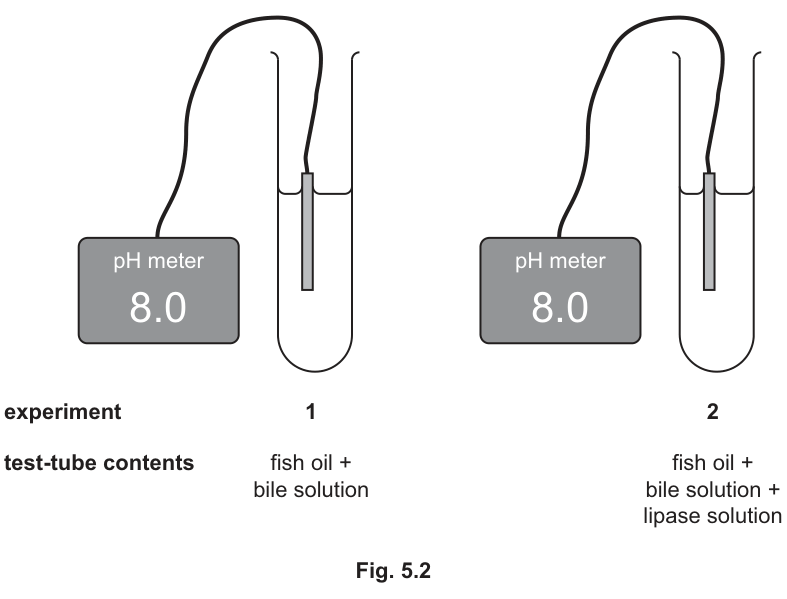
The student recorded the pH of the contents of each test-tube using a digital pH meter at the start of each experiment. Both meters recorded a pH of 8.0.
The student continued to monitor the readings on the pH meters for 30 minutes.
Use your knowledge of how lipids are digested to explain what you would expect to happen in each test-tube.
experiment 1
experiment 2
Answer
In both tubes: bile emulsifies the fish oil — it breaks large fat droplets into small ones, increasing the surface area for enzyme action.
Experiment 1 (fish oil + bile only):
- There is no lipase, so no digestion/breakdown of the lipid occurs.
- No fatty acids are produced, so the pH remains at 8.0.
Experiment 2 (fish oil + bile + lipase):
- Bile provides the optimum (alkaline) pH for lipase to work.
- Lipase digests the lipid into fatty acids and glycerol.
- The fatty acids lower the pH below 8.0, so the meter reading falls during the 30 minutes.
Both: bile emulsifies oil, increasing surface area. Experiment 1: no digestion, pH stays at 8.0. Experiment 2: lipase digests lipid into fatty acids + glycerol, so pH falls below 8.0 due to the fatty acids.
Walkthrough
Bile's job here is physical, not chemical: it emulsifies fat, breaking big oil droplets into many tiny ones. This greatly increases the surface area available for lipase to attack. Emulsification happens in both tubes because both contain bile.
In experiment 1 there is no enzyme. Bile alone does not chemically digest lipid, so nothing is broken down and no new substances appear. With no fatty acids formed, the pH stays exactly where it started, at 8.0.
In experiment 2, lipase is present. Bile keeps the mixture alkaline, which suits lipase (its optimum pH is around 8). Lipase hydrolyses the triglycerides in fish oil into fatty acids and glycerol. Fatty acids are acidic, so as they accumulate the pH drops below 8.0 — the digital meter would show a steady fall over the 30 minutes. This is why pH change is a classic way to follow lipase activity.
Key Takeaways
- Bile emulsifies fats (physical breakdown, increases surface area); it does not digest them chemically.
- Lipase: substrate = lipids/fats/oils; end-products = fatty acids + glycerol.
- Falling pH indicates fatty acid production, so pH meters can track lipase activity.
- Bile creates the alkaline conditions lipase needs.
Common Mistakes
- Saying bile 'digests' fat — it only emulsifies it; digestion is done by lipase.
- Forgetting glycerol alongside fatty acids as the end-products.
- Predicting a pH rise instead of a fall — fatty acids make the mixture more acidic.
- Claiming experiment 1's pH changes — without an enzyme, no fatty acids form.
- Omitting the surface-area point about emulsification, which is a separate mark.
Things to Be Careful About
- Structure your answer tube by tube, as the question asks.
- State the starting pH (8.0) and the direction of change (falls below 8.0) explicitly.
- Name the products precisely: 'fatty acids and glycerol', not just 'smaller molecules'.
Farmers in many countries, including the United States of America (USA), keep cows to produce milk.
This milk is then sold for human consumption.
Table 6.1 shows how the yearly average milk production per cow in the USA changed over a period of 60 years.
Table 6.1
| year | mass of milk produced per cow / per year |
|---|---|
| 1950 | 2250 |
| 1970 | 4500 |
| 1990 | 6750 |
| 2010 | 9400 |
Between the years 1970 and 2010, a farmer in the USA always had 250 cows producing milk on his farm.
Use the data in Table 6.1 to calculate the increase in milk production by 250 cows between the years 1970 and 2010.
Express your answer in standard form.
______
Working
Increase per cow between 1970 and 2010:
For 250 cows:
Answer
kg per year
Walkthrough
The table gives milk production per single cow in four different years. The question asks about a fixed herd of 250 cows, so there are two steps.
Step 1 — find how much more one cow produces in 2010 than in 1970: subtract the 1970 value from the 2010 value, kg per year per cow.
Step 2 — scale this up to the whole herd: kg per year.
Step 3 — express in standard form. Standard form means where is between 1 and 10. Move the decimal point six places left: kg per year.
Note that the mark scheme awards 2 marks for the unconverted figure of 1 225 000, so even if you forget standard form you still score most of the credit — but the third mark requires the conversion.
Key Takeaways
- Read both years' values carefully before subtracting; using the wrong pair of years loses everything downstream.
- Standard form places one non-zero digit before the decimal point; count the places moved to get the power of ten.
- Always attach the unit given on the answer line (kg per year).
Common Mistakes
- Subtracting in the wrong order or using 1950 instead of 1970 as the starting year.
- Forgetting to multiply by 250 and giving only 4900 — the mark scheme allows 1 mark for showing or 4900, but not full credit.
- Writing — that is not standard form because 12.25 is greater than 10.
- Omitting the unit 'kg per year'.
Things to Be Careful About
- The mark scheme says the response on the answer line takes precedence, so make sure your final written answer is the converted standard-form value, not the intermediate 1 225 000.
- Keep the multiplication sign in ; writing '1225e6' or '1.225E6' may not be credited.
- Round nothing here — 1.225 is exact.
One reason for the pattern shown by the data in Table 6.1 is the use by farmers of artificial selection to breed cows that produce more milk. This is an example of selective breeding.
Use this example to describe the main stages in the process of selective breeding.
Answer
- Farmers select cows with the greatest milk production and breed / cross them together.
- From the offspring, they again select those with increased milk production and breed these together.
- This selection and breeding is repeated over many generations, so milk yield increases over the years.
Select high-yielding cows and breed them; select offspring with high milk production and breed them; repeat over many generations.
Walkthrough
Selective breeding (artificial selection) is when humans choose which organisms breed, based on a desired characteristic, rather than leaving it to natural selection. The mark scheme credits any three of four points, so structure your answer around the cycle:
- Selection of parents — choose cows that already produce the most milk. The characteristic must be named in the context: increased milk production, not just 'the best cows'.
- Breeding — cross/reproduce the selected parents so their genes are passed on.
- Selection of offspring — from the offspring, pick those showing the greatest milk production and breed only these.
- Repetition — repeat the cycle over many generations (or many years). Each generation shifts the average yield upward, which is exactly the pattern in Table 6.1: 4500 kg in 1970 rising to 9400 kg in 2010.
Notice the '+' joins in the mark scheme: 'selection + of offspring with increased milk production' means naming the trait AND saying it is the offspring being selected — either half alone does not score that mark.
Key Takeaways
- Selective breeding = choose parents with desired trait → breed → select best offspring → repeat for generations.
- Always name the specific trait being selected for in the given context.
- The repetition across generations is what produces the gradual improvement seen in data tables like Table 6.1.
Common Mistakes
- Describing genetic modification instead of selective breeding — they are different processes; no genes are transferred between species here.
- Saying 'select the biggest cows' without naming milk production as the trait.
- Stopping after one round of breeding without mentioning repetition over generations — that loses the fourth listed point.
- Confusing natural selection with artificial selection: here humans do the choosing.
Things to Be Careful About
- Give exactly three points since the question asks for the main stages worth 3 marks; the scheme lists four options ('any three from'), so pick the clearest three.
- Use the word 'offspring' — selecting the original parents twice does not show you understand generational improvement.
Research has shown that 95% of cows used to produce milk in the USA are fed crop plants that have been produced by genetic modification.
These crop plants have been produced to provide the cows that eat them with additional vitamins.
Outline the stages in the genetic modification process used to produce these crop plants.
Answer
- Identify and select the gene / DNA responsible for vitamin production.
- Cut out the gene using enzymes.
- Insert the gene into a plasmid.
- Use the plasmid as a vector to introduce the gene into the cells of the crop plant, which are then grown into plants producing extra vitamins.
See working
Walkthrough
Genetic modification moves a useful gene from one organism into another. The crop plants here have been engineered to carry a gene giving extra vitamins, and the cows eat these crops. The standard sequence the syllabus expects:
- Select the gene — identify the DNA that codes for vitamin production. Naming the trait matters: 'select gene/DNA for production of vitamins' is the first marking point.
- Cut out the gene — enzymes cut the required section of DNA out of the donor organism's chromosome.
- Insert into a plasmid — a plasmid is a small ring of DNA found in bacteria. The gene is inserted into it. Note the '+' join: insertion AND plasmid together earn that mark.
- Use the plasmid as a vector — the plasmid carries (transfers) the gene into the cells of the crop plant. A vector is anything used to transfer DNA into another cell. The modified cells are then grown into whole crop plants.
Each step is a separate mark, so all four sentences are needed for all four marks.
Key Takeaways
- Gene transfer sequence: select gene → cut out → insert into plasmid → plasmid acts as vector to deliver the gene to the host organism.
- A plasmid is bacterial DNA used as a carrier (vector) of the new gene.
- The new gene must be described by its function (vitamin production), not just called 'a gene'.
Common Mistakes
- Omitting the plasmid entirely and saying the gene is 'put directly into the plant' — the vector step carries its own marks.
- Saying 'vector' without saying what it is or does — the scheme wants plasmid + as vector/to introduce the gene.
- Vague verbs like 'put the gene in' without mentioning cutting the gene out first.
- Not linking the gene to vitamins — an unnamed gene scores only partially.
Things to Be Careful About
- Two of the four marks use '+': 'insert gene + plasmid' and 'plasmid + as vector'. Both halves of each must appear.
- Keep the steps in logical order; examiners read outlines sequentially.
- Do not describe selective breeding here — this part is specifically about genetic modification.
Genetic modification has been used to change crop plants in other ways. One example of this is the production of crop plants that contain a chemical to make them resistant to insect pests.
Outline two potential risks of growing these crops.
Answer
- The insect-resistant chemical could kill beneficial insects such as pollinators, causing a decline in insect populations.
- The chemical could disrupt food chains / affect the wider ecosystem, e.g. reducing food for animals that eat the insects.
- The resistance gene could be transferred (by cross-pollination) to wild plants or other populations.
- There could be unknown long-term effects on the environment or on health.
See working
Walkthrough
These crops contain a chemical making them resistant to insect pests — insects feeding on the crops die. The question asks for potential risks, meaning reasoned possibilities, not proven facts. Any two of the following score:
- Harm to non-target insects — the chemical cannot distinguish pests from useful insects, so pollinators (bees) or other harmless insects may also be killed, reducing insect populations.
- Disruption of food chains and ecosystems — fewer insects means less food for insect-eating birds, frogs and other carnivores, so effects spread through the food web.
- Gene transfer — pollen carrying the resistance gene could fertilise wild relatives or neighbouring non-GM crops, spreading the gene into other populations where its effects are uncontrolled.
- Unknown long-term effects — the technology is relatively new, so unforeseen consequences on the environment or on people eating the crops cannot be ruled out.
This is a 'suggest'-style application task: take general principles (food webs, interdependence, gene flow) and apply them to the specific case of insect-resistant GM crops.
Key Takeaways
- Risks of GM crops fall into categories: harm to non-target organisms, disruption of food chains/ecosystems, gene escape to wild populations, unknown long-term effects.
- 'Potential risk' invites reasoned possibility — link each risk to a mechanism, not just a worry.
Common Mistakes
- Giving vague answers like 'it might be dangerous' with no mechanism — no mark without a reason.
- Listing advantages instead of risks, or repeating the same risk twice in different words (e.g. 'kills insects' and 'kills pests' — same point).
- Saying the crops will definitely cause harm — the question asks for potential risks, so hedge appropriately.
- Confusing this with risks of selective breeding — the risks asked about are specific to genetically modified insect-resistant crops.
Things to Be Careful About
- Exactly two risks are needed for 2 marks; give two distinct ones, not variations of one idea.
- Each risk should name what is affected (insects, food chain, other plant populations, long-term environment) — specificity earns the mark.
Compare each of these processes:
Answer
Both processes involve the movement of molecules / ions / particles.
| diffusion | active transport | |
|---|---|---|
| Direction | from a high to a low concentration, i.e. down the concentration gradient | from a low to a high concentration, i.e. against the concentration gradient |
| Energy | no energy required — movement is due to the kinetic energy of the particles | energy is required, supplied by respiration |
See working
Walkthrough
The question asks you to compare, so each point must name both processes. Start with the similarity: in both cases particles move — molecules or ions — so that shared feature earns a mark.
Then the differences. In diffusion, particles move because of their own kinetic energy: they are constantly in random motion and spread out until they are evenly distributed. This means the net movement is from where they are more concentrated to where they are less concentrated — down the concentration gradient. No energy from the cell is needed.
Active transport is the opposite. Carrier proteins in the membrane move particles from a low concentration to a high concentration — against the gradient. This cannot happen by kinetic energy alone, so the cell must supply energy from respiration. The mark scheme joins 'energy required' with 'respiration' using a plus sign, so both halves are needed for that one mark.
Key Takeaways
- Diffusion: kinetic energy, high to low concentration, no energy from the cell.
- Active transport: against the concentration gradient, requires energy from respiration.
- A comparison answer must pair both processes in each point.
Common Mistakes
- Writing 'diffusion is passive' without saying what drives it — the mark scheme wants kinetic energy.
- Saying active transport needs 'energy' but forgetting to name respiration as the source — the '+' in the scheme means both are required.
- Describing only one process and not comparing — each credited point must cover both sides.
- Confusing the direction: active transport goes low to high, not the reverse.
Things to Be Careful About
- Give exactly four points; the scheme lists more than four and awards 'any four from'.
- Use the exact terms 'concentration gradient' and 'respiration' — vague wording such as 'energy is used up' may not score.
- A small comparison table is a clean way to ensure both processes appear in every point.
Answer
| transpiration | translocation | |
|---|---|---|
| What moves | loss of water as vapour | movement of sucrose and amino acids |
| Where from | from the leaves | from a source to a sink |
| Tissue | through the xylem | in the phloem |
See working
Walkthrough
Both are transport processes in flowering plants, but they move different substances in different tissues.
Transpiration is the loss of water in the form of vapour — the '+' in the scheme means both 'water' and 'vapour' are needed; 'loss of water' alone does not score. The water evaporates from the mesophyll and diffuses out through the stomata, so it is lost mainly from the leaves, and it travels up the plant in the xylem.
Translocation is the movement of dissolved sucrose and amino acids — the scheme's '+' again requires both substances. It happens in the phloem, and the direction is from a source (where the substances are made or released, such as a photosynthesising leaf) to a sink (where they are used or stored, such as a root or a growing fruit). The scheme's '+' pairs 'from source' with 'to sink', so both terms must appear.
Key Takeaways
- Transpiration: water vapour, lost from leaves, xylem.
- Translocation: sucrose and amino acids, phloem, source to sink.
- Xylem carries water only upwards; phloem carries organic solutes in either direction.
Common Mistakes
- Saying transpiration is 'loss of water' without 'vapour' — the state of the water is the marking point.
- Naming only sucrose, or only amino acids, for translocation — the scheme requires both.
- Saying translocation goes 'up the plant' — its direction is source to sink, which can be downwards.
- Swapping the tissues: water in phloem or sucrose in xylem.
- Confusing transpiration with translocation because the names are similar.
Things to Be Careful About
- Four marks, 'any four from' — give exactly four clear points.
- Use the precise terms 'source' and 'sink'; 'from where it is made to where it is used' is AW but the named terms are safer.
- 'Loss of water + vapour' is one mark needing both words, as is 'sucrose + amino acids' and 'source + to sink'.
Answer
Both are plant growth responses, in which growth is towards or away from a stimulus.
- Phototropism: the stimulus is light.
- Gravitropism: the stimulus is gravity.
See working
Walkthrough
A tropism is a directional growth response of a plant to a stimulus. Both phototropism and gravitropism share this definition, so the two shared marks are: they are plant growth responses, and the growth is towards or away from the stimulus. The 'towards / away' phrasing matters — shoots show positive phototropism (grow towards light) and roots show positive gravitropism (grow towards gravity), so the response can be in either direction depending on the organ.
The remaining two marks simply name the stimulus for each: light for phototropism, gravity for gravitropism.
Key Takeaways
- A tropism = a plant growth response towards or away from a stimulus.
- Phototropism: stimulus is light (shoots grow towards it).
- Gravitropism: stimulus is gravity (roots grow towards it, shoots away).
Common Mistakes
- Describing the response of shoots only and forgetting that roots respond oppositely — hence the scheme's 'towards / away'.
- Writing 'phototropism is growth towards light' as the shared point — the shared point is the general definition, not one specific case.
- Saying 'the plant bends' instead of 'growth' — tropisms are growth responses, not movements of the whole plant.
- Mixing up which stimulus belongs to which tropism.
Things to Be Careful About
- Four marks from 'any four from': the two shared points plus the two stimuli.
- The word 'growth' must appear — a tropism is a growth response.
- Keep the answer short; no extra detail about auxin is needed for these four marks.