Biology 5090/42 — May/June 2024
Cambridge O-Level · Alternative to Practical · worked solutions for every part, with the mark scheme
Topics Experimental Contexts · Use of Techniques, Apparatus and Materials · Microscopy and Biological Drawing · Observations and Measurements · Analysis, Conclusions and Evaluation · Planning Experiments and Investigations
A student investigated the structure and nutrient content of a flower.
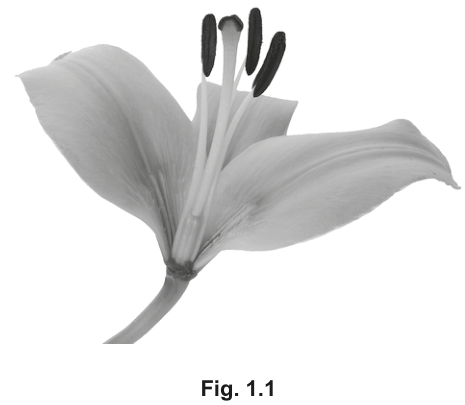
Fig. 1.1 shows the flower. Some petals have been removed so that the internal structure can be clearly seen.
Answer
Make a large drawing of the flower in Fig. 1.1 following these conventions:
- clear, clean, continuous lines drawn with a sharp pencil; no shading, stippling or cross-hatching anywhere and no ruled lines
- drawing at least 100 mm wide, in the correct orientation (flower attached to its stem as shown)
- three stamens drawn, at least one longer than the stigma, each filament drawn with a double line and each anther clearly delimited
- the style drawn with a double line, with a delimited stigma at its top
- three separate petals drawn, with all anthers and the stigma protruding above the petals
Large continuous-line drawing of the flower, at least 100 mm wide, showing three stamens (double-lined filaments, delimited anthers, one longer than the stigma), a double-lined style with delimited stigma, and three separate petals below them
Walkthrough
This is a biological drawing task, and on 5090 practical papers the marks are awarded as much for HOW you draw as for WHAT you draw. The mark scheme gives five separate points:
- Line quality — use a sharp HB pencil and draw one continuous, unbroken outline. Never sketch in short fuzzy strokes, and never shade, stipple (dot) or cross-hatch to show darkness. The anthers in Fig. 1.1 are dark, but in a biological drawing you show that only by drawing their outline, not by filling them in.
- Size and orientation — the drawing must be at least 100 mm wide (about half an A4 page) and in the same orientation as the photograph: stem at the bottom, flower opening upwards.
- Stamens — the male parts. Draw all three, each with a filament (the stalk) drawn as a DOUBLE line, because a filament is a tube-like structure and tubes are always drawn with two lines. Each anther must be clearly delimited — a closed shape at the tip of the filament. Notice that in Fig. 1.1 at least one stamen is longer than the stigma, so your drawing must show that too.
- Style and stigma — the female part in the centre. The style is also a tube, so double line it, and the stigma at its top must be a clearly closed shape.
- Petals — draw three separate petals (some were removed to reveal the internal parts, so three remain). The anthers and stigma must stick out ABOVE the petals, as in the photograph.
Key Takeaways
- Biological drawings use single continuous outlines, never shading.
- Tube-like structures (filaments, styles, stalks, vessels) are drawn with double lines.
- Every drawing task states a minimum size — measure it.
- Draw only what is asked for, in the correct proportion and orientation.
Common Mistakes
- Shading or stippling the dark anthers — this loses the line-quality mark outright.
- Drawing the flower too small (under 100 mm wide) or upside down.
- Drawing filaments and the style as single lines.
- Leaving anthers as open blobs instead of delimited (closed) shapes.
- Drawing petals so large that they cover the anthers and stigma.
Things to Be Careful About
- The mark scheme requires the drawing to be at least 100 mm wide — measure with a ruler before you start.
- "At least 1 stamen longer than stigma" is a specific credited detail from the photograph; check your drawing reproduces it.
- Use a sharp pencil throughout; a blunt pencil cannot produce clean continuous lines.
On your drawing, draw a line and label it P to show where pollen must land when pollination takes place.
Answer
Draw a label line to the top of the stigma and label it P.
Label line from P to the top of the stigma
Walkthrough
Pollination is the transfer of pollen from an anther to a stigma. The pollen grain must land on the receptive surface at the top of the stigma, so the label line for P must touch the very top of the stigma — not the style, not an anther. Label lines should be drawn with a ruler, touching the structure they name, with the label written outside the drawing.
Key Takeaways
- Pollination = pollen landing on the stigma.
- Label lines must touch the exact structure named.
Common Mistakes
- Pointing P at an anther (where pollen is made, not where it lands).
- Pointing P at the middle or base of the style instead of the top of the stigma.
Things to Be Careful About
- The mark scheme says "label line to top of stigma" — the line must end at the top of the stigma, and the label must read P.
The student tested two parts of the flower, A and B, for their nutrient content.
The student tested both parts with Benedict's solution, biuret reagent and iodine solution.
Answer
Draw a ruled table with these headers (cells left empty for the results):
| Test / reagent | Colour in part A | Colour in part B |
|---|---|---|
| Benedict's solution | ||
| biuret reagent | ||
| iodine solution |
Construction points credited:
- table drawn with ruled lines, all information written inside the table
- headers A and B each stated once only
- headers Benedict's, biuret and iodine each stated once only
- overarching headers naming the test/reagent and the colour/observation
Ruled table with columns for parts A and B and rows for Benedict's solution, biuret reagent and iodine solution, with overarching headers for the test and the colour observed
Walkthrough
This is a table-DESIGN mark, not a results mark — you draw the empty skeleton the student will fill in. The four credited points are all about construction:
- Ruled lines — use a ruler; every row and column is separated by a ruled line, and nothing is written outside the table.
- A and B stated once only — the two flower parts are the samples, so they head the two result columns, written once at the top.
- The three reagents stated once only — Benedict's solution, biuret reagent and iodine solution head the three rows.
- Overarching headers — the table needs column headings that say what each column contains: one for the test/reagent/solution and one for the colour/observation/result.
Key Takeaways
- A well-constructed table has headers for every column, each stated once.
- The independent variable (which reagent) forms the rows; the samples (A, B) form the columns — or the reverse, as long as headers are clear.
Common Mistakes
- Writing the reagent names in every row instead of once in the header.
- Leaving a column without a header, or writing results outside the ruled table.
- Forgetting an overarching header such as "Test" and "Colour observed".
Things to Be Careful About
- This part asks for the EMPTY table; the colours are recorded in part (b)(ii). Do not fill the cells in yet.
At the end of the tests, the student noted:
- part A tested positive with Benedict's solution and negative with biuret reagent and iodine solution
- part B tested positive with biuret reagent and iodine solution and negative with Benedict's solution.
In the table you have drawn, record the colours the student would have observed at the end of each test.
Answer
| Test / reagent | Colour in part A | Colour in part B |
|---|---|---|
| Benedict's solution | green / yellow / orange / red (positive) | blue (negative) |
| biuret reagent | blue (negative) | purple / lilac (positive) |
| iodine solution | brown / yellow (negative) | blue-black / black (positive) |
A: Benedict's green/yellow/orange/red, biuret blue, iodine brown/yellow; B: Benedict's blue, biuret purple/lilac, iodine blue-black
Walkthrough
The student's notes tell you which tests were positive and which were negative; your job is to translate each into the actual colour seen.
- Benedict's solution tests for reducing sugars. It starts blue; on heating with a reducing sugar it goes green, then yellow, then orange, then brick-red depending on the amount. Part A is positive, so any of green/yellow/orange/red scores. Part B is negative, so it stays blue.
- Biuret reagent tests for protein. It starts blue and turns purple/lilac/violet with protein. Part A is negative (stays blue); part B is positive (purple).
- Iodine solution tests for starch. It is brown/yellow and turns blue-black with starch. Part A is negative (stays brown/yellow); part B is positive (blue-black).
The key skill is giving the FINAL colour observed, not the colour change — the question asks what the student observed at the end of each test.
Key Takeaways
- Benedict's: blue → green/yellow/orange/brick-red on heating = reducing sugar present.
- Biuret: blue → purple/lilac = protein present.
- Iodine: brown/yellow → blue-black = starch present.
- A negative test shows the reagent's original colour.
Common Mistakes
- Writing "positive" or "present" instead of an actual colour — the question asks for colours.
- Giving the colour change ("blue to purple") when the final colour alone is asked for; either may be accepted but the final colour is safest.
- Saying Benedict's goes "brick-red" for a negative result, or forgetting Benedict's stays blue when no reducing sugar is present.
Things to Be Careful About
- One mark per reagent for the correct final colour. For Benedict's, any of green/yellow/orange/red scores for a positive result.
- Iodine's positive colour is blue-black, not just "black" or just "blue".
Answer
- part A: reducing sugar (e.g. glucose)
- part B: protein and starch
A = reducing sugar; B = protein and starch
Walkthrough
Each positive test names one nutrient:
- Part A gave a positive Benedict's test, so it contains a reducing sugar such as glucose or maltose. Its negative biuret and iodine tests rule out protein and starch.
- Part B gave positive biuret and iodine tests, so it contains protein and starch. Its negative Benedict's test rules out reducing sugars.
This is how food tests work as a set: each reagent is specific to one nutrient, so the pattern of positives and negatives uniquely identifies the nutrients present.
Key Takeaways
- Benedict's positive → reducing sugar; biuret positive → protein; iodine positive → starch.
- A negative test is also evidence — it rules a nutrient out.
Common Mistakes
- Writing "sugar" instead of "reducing sugar" — Benedict's solution only detects reducing sugars, so the precise term is needed.
- Naming "glucose" as the only acceptable answer — any reducing sugar (glucose, maltose) is correct.
- Forgetting that part B contains TWO nutrients, protein and starch, and giving only one.
Things to Be Careful About
- Three marks: one for A's reducing sugar, one each for B's protein and B's starch. Give all three statements.
Fig. 1.2 is a photomicrograph of a pollen grain.
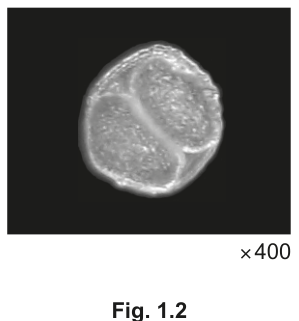
Measure and record the diameter of the pollen grain at its widest point.
diameter = ______
Answer
Measure across the pollen grain in Fig. 1.2 at its widest point with a ruler.
Any value in the accepted range 23–27 mm scores.
23–27 mm (any value in this range, measured at the widest point of the grain in Fig. 1.2)
Walkthrough
Place a ruler across the photomicrograph of the pollen grain in Fig. 1.2, passing through the centre so you measure the widest point — the diameter, not a chord. Read the distance in millimetres and record it with its unit. The mark scheme accepts 23–27 mm, because the exact printed size varies slightly between copies; any value inside that range scores.
Key Takeaways
- Measure the diameter through the centre at the widest point.
- Always attach the unit (mm) to a recorded measurement.
Common Mistakes
- Measuring a chord that misses the centre, giving a value smaller than the diameter.
- Omitting the unit "mm".
- Measuring the dark square frame rather than the grain itself.
Things to Be Careful About
- The answer line is printed with the unit mm, so your number must be in millimetres, not centimetres.
Calculate the diameter of the actual pollen grain and record your answer to 2 decimal places.
diameter of the actual pollen grain = ______
Working
Answer
diameter of the actual pollen grain = 0.06 mm
0.06 mm (using the measured diameter from (c)(i) ÷ 400, to 2 decimal places)
Walkthrough
The photomicrograph is magnified , so the image is 400 times larger than the real pollen grain. To find the real size, divide the measured image size by the magnification:
Using the example measurement of 25 mm from (c)(i): mm, which rounds to 0.06 mm at 2 decimal places. If your measurement in (c)(i) was different, ecf applies — divide YOUR value by 400 and round correctly.
The three marks are: (1) dividing your (c)(i) measurement by 400, (2) the answer correct to 2 decimal places, (3) the unit.
Key Takeaways
- actual size = image size ÷ magnification; magnification = image size ÷ actual size.
- "To 2 decimal places" is a marking point — rounding is rewarded, not optional.
- The unit must be stated and must match the unit of the measurement you divided.
Common Mistakes
- Multiplying by 400 instead of dividing (giving a huge number) — the image is larger than the object, so the object must be smaller than the image.
- Forgetting to round to 2 decimal places, or rounding too early.
- Omitting the unit.
Things to Be Careful About
- Use YOUR measured value from (c)(i); any value in the 23–27 mm range carried through correctly scores (ecf).
- The answer line in the question does not print a unit, so you must supply it: mm.
Fig. 1.3 is a photomicrograph of a pollen grain from a different species of plant.
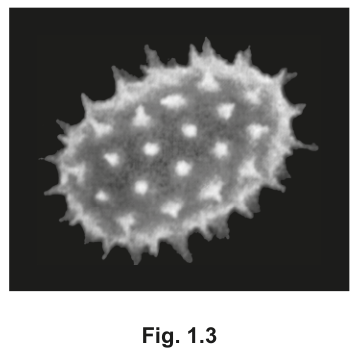
Describe two visible differences in the structure of the pollen grains in Fig. 1.2 and Fig. 1.3.
| Fig. 1.2 pollen grain | Fig. 1.3 pollen grain |
|---|---|
| 1 | |
| 2 |
Answer
| Fig. 1.2 pollen grain | Fig. 1.3 pollen grain | |
|---|---|---|
| 1 | round / circular in shape | oval |
| 2 | smooth surface, spikes absent | spiky surface, spikes present |
Fig. 1.2 is round with a smooth surface; Fig. 1.3 is oval with a spiky surface
Walkthrough
Compare the two photomicrographs feature by feature. The credited differences are:
- Shape — the Fig. 1.2 grain is round/circular; the Fig. 1.3 grain is oval (longer than it is wide).
- Surface — the Fig. 1.2 grain has a smooth surface with no spikes; the Fig. 1.3 grain is covered in spikes, giving a rough surface.
- (Also credited) Internal division — the Fig. 1.2 grain shows a visible internal division (the cleft/furrow); the Fig. 1.3 grain shows none.
You only need TWO differences, and each must be written as a paired comparison — one column describing Fig. 1.2, the other describing Fig. 1.3 for the same feature.
Key Takeaways
- A comparison must contrast the SAME feature in both specimens, side by side.
- Observable features of pollen grains include shape, surface texture (spines) and internal divisions.
Common Mistakes
- Describing both grains separately without pairing the features (e.g. "1.3 is spiky" with nothing in the 1.2 column).
- Writing about size — the images may be at different magnifications, so size is not a valid comparison unless magnifications are given and equal.
- Writing "different shape" without saying what each shape is.
Things to Be Careful About
- Give exactly two differences; the table has two numbered rows.
- Each row must have an entry in BOTH columns to score.
A student investigated the number of plants on a school field.
This was done by examining small samples of the field using a square frame measuring .
Fig. 2.1 shows the plants in one of these samples.
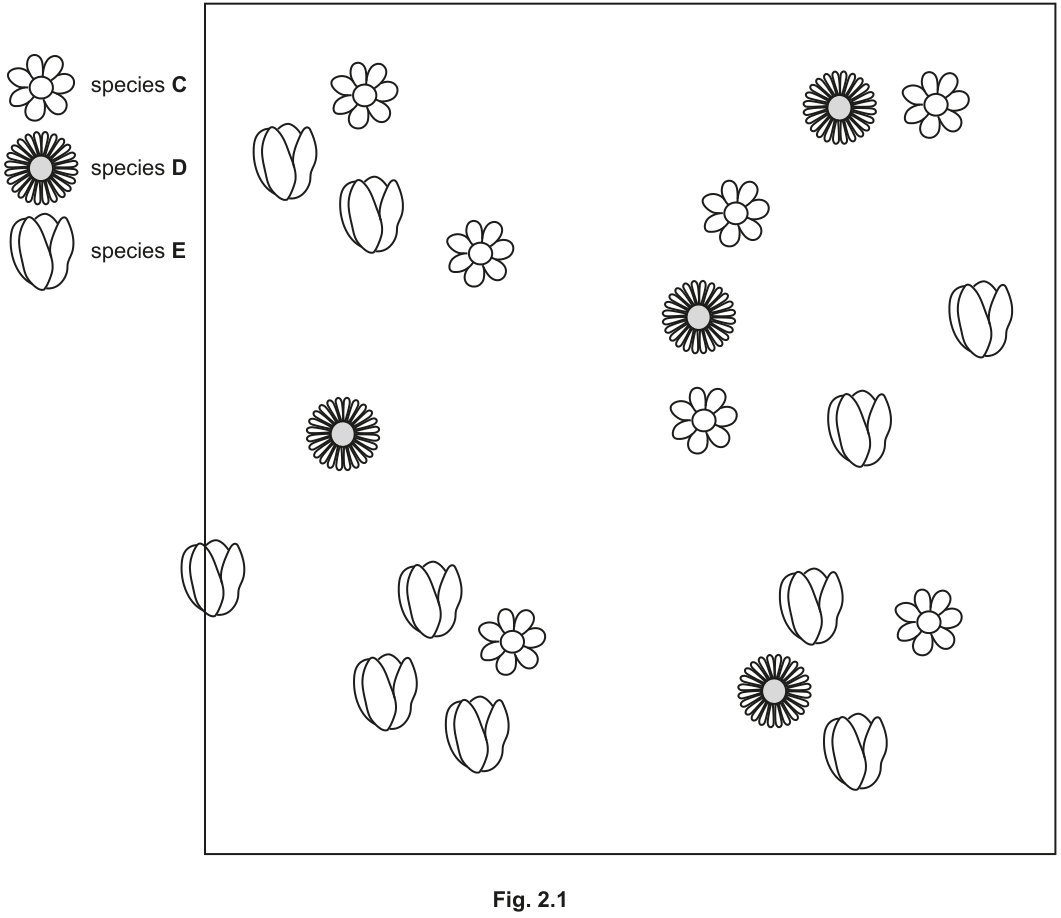
The sample contained three different plant species.
The student counted the number of plants of each of these species in this sample.
One plant was not fully within the square frame. Suggest and explain what you would do about this plant.
______
Answer
Exclude it because it is not fully within the square; you cannot count half an individual plant.
(Alternatively, include it if more than half of the plant is inside the square, for the same reason.)
Exclude it because it is not fully within the square / cannot count half an individual
Walkthrough
In quadrat sampling, a standard rule is needed for plants that cross the boundary of the frame. The most common convention is to exclude any individual that is not fully inside the quadrat. An alternative accepted convention is to include it if more than 50% of the plant is inside the frame. The mark scheme accepts either approach as long as the reason is given: you cannot scientifically count a fraction of an individual organism.
Key Takeaways
When using quadrats, always apply a consistent rule for boundary individuals to avoid bias. The simplest rule is to only count organisms fully within the frame.
Common Mistakes
Students often suggest including or excluding the plant without giving a reason, or they give a vague reason like "to be fair." The mark scheme specifically requires the reason: you cannot count half an individual, or it is not fully in the square.
Things to Be Careful About
Check the mark scheme for accepted alternatives. Both "include if >50%" and "exclude if not fully inside" score, but the reason must link to the impossibility of counting a fraction of an organism.
Count the number of plants of species E in Fig. 2.1, taking into account your answer to (a).
Record your answer in Table 2.1.
Table 2.1
| plant species | number of plants in the sample | estimated number of plants in the whole field |
|---|---|---|
| C | 7 | 5600 |
| D | 4 | 3200 |
| E |
Answer
| plant species | number of plants in the sample | estimated number of plants in the whole field |
|---|---|---|
| C | 7 | 5600 |
| D | 4 | 3200 |
| E | 9 (or 10) |
9 or 10
Walkthrough
Species E is represented by the tulip/leaf-like shapes in Fig. 2.1. Counting the fully enclosed symbols gives 9. The plant crossing the left boundary is the one addressed in part (a). Depending on the rule chosen in (a), the total is either 9 (if excluded) or 10 (if included).
Key Takeaways
Carefully identify the symbol for the target species and distinguish it from others. Remember to apply the boundary rule consistently.
Common Mistakes
Misidentifying the symbols for species E, or forgetting to account for the boundary plant entirely. Counting only the boundary plant or missing one of the fully enclosed ones.
Things to Be Careful About
The mark scheme accepts 9 or 10 based on the answer to (a). Ensure your count matches the rule you stated.
The whole field measured .
Use the sample in Fig. 2.1 to estimate the number of plants of species E in the whole field and record this value in Table 2.1.
Show your working.
Working
Area of whole field =
Area of one sample (quadrat) =
Number of samples =
Estimated number of species E = (or )
Answer
| plant species | number of plants in the sample | estimated number of plants in the whole field |
|---|---|---|
| C | 7 | 5600 |
| D | 4 | 3200 |
| E | 9 | 7200 |
(If 10 was counted in (b), the estimate is 8000.)
7200 (or 8000)
Walkthrough
To estimate the total population, first find how many quadrats fit into the whole field. Divide the total area by the quadrat area: samples. Then multiply this multiplier by the number of individuals counted in the sample (9 or 10). .
Key Takeaways
Population estimation from sampling uses the formula: .
Common Mistakes
Forgetting to calculate the area of the quadrat correctly (e.g., using instead of ), or multiplying the sample count by the total area directly instead of the number of samples.
Things to Be Careful About
Show all working clearly. The mark scheme awards one mark for identifying the 800 samples (or the area calculation) and one mark for the final correct estimate. Use the value from part (b) consistently.
Explain why the student counted the numbers of plants in samples of the field instead of counting the number of plants in the whole field.
______
Answer
Counting every plant in the whole field would be too time consuming and would make it more likely to make mistakes (or too difficult to keep an accurate tally).
Counting all plants would be too time consuming / more likely to make mistakes
Walkthrough
Total enumeration (counting every single individual) is only feasible for small areas or small populations. For a large field, it is impractical. Sampling provides a reasonable estimate much faster.
Key Takeaways
Sampling is used as a practical alternative to total counts when the population or area is too large.
Common Mistakes
Saying "it is too difficult" without elaborating, or suggesting that sampling is more accurate (sampling is an estimate, not necessarily more accurate than a total count if the total count is done perfectly).
Things to Be Careful About
Focus on the practical constraints: time, effort, and the likelihood of human error in keeping a tally over a large area.
Suggest two reasons why taking several samples would improve the accuracy of the estimate for the number of plants in the whole field.
-
______
-
______
Answer
-
Plants are not evenly distributed across the field, so a single sample may not be representative.
-
Taking several samples covers a larger proportion of the field, making the sample more representative and reducing the effect of random variation.
Plants are not evenly distributed; larger proportion of field is sampled / more representative
Walkthrough
A single quadrat might land in a patch with many plants or a patch with few. Taking multiple samples at random locations ensures that different areas are represented. This accounts for the natural clumping or uneven distribution of plants and gives a larger, more reliable dataset.
Key Takeaways
Random sampling and increasing sample size are key to reducing bias and improving the reliability of ecological estimates.
Common Mistakes
Saying "to make it more accurate" without explaining why. You must link the multiple samples to the uneven distribution of plants or the increased representativeness.
Things to Be Careful About
Give two distinct points. One should relate to the uneven distribution of organisms, and the other to the representativeness or size of the sample.
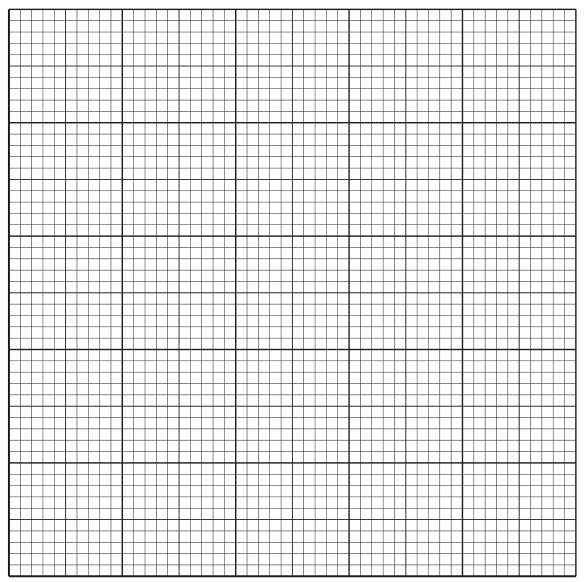
Use the data in Table 2.1 to construct a bar chart to show the estimated number of plants of species C, D and E in the whole field.
Answer
See diagram
Walkthrough
The bar chart must show the estimated number of plants for species C, D, and E. Use the values from Table 2.1: C = 5600, D = 3200, E = 7200 (or 8000).
Key Takeaways
Bar charts are used for categorical data (species). The y-axis is the numerical variable (number of plants), and the x-axis is the categorical variable (species).
Common Mistakes
Forgetting to label the axes with units, using a non-linear scale, or making the bars touch (bar charts for categorical data should have gaps between bars).
Things to Be Careful About
- Axes: Fully label both axes (e.g., "Number of plants" on the y-axis, "Plant species" on the x-axis).
- Scale: Use a linear scale that uses at least half the grid in both directions. Ensure the origin is 0.
- Bars: Draw bars with equal width, using ruled lines (no shading), and leave gaps between them.
- Values: Plot the correct heights for 5600, 3200, and 7200 (or 8000).
Plants can be provided with fertiliser to help them grow.
Some students were provided with germinated seeds of the same species in some shallow dishes and a 10% fertiliser solution. One dish is shown in Fig. 3.1.
The students had access to any other common laboratory apparatus.
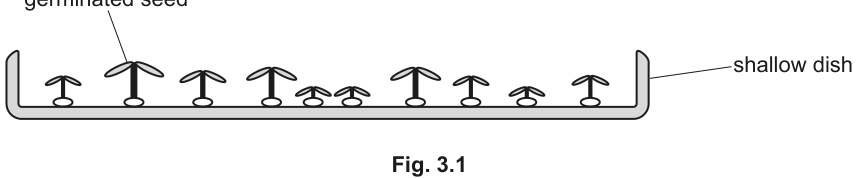
Plan an investigation the students could carry out to find the effect of different fertiliser concentrations on plant growth.
Answer
- Measure the height (or mass) of the plants at the start of the investigation and again after a set time period.
- Prepare at least three different fertiliser concentrations, all , and include a control with fertiliser (distilled water).
- Add the same volume of each fertiliser solution (and the control) to the dishes.
- Leave the plants for the same time period.
- Keep light intensity, temperature, and volume of water constant.
- Repeat the experiment at each concentration and calculate a mean.
- Compare the mean growth (height or mass) against the fertiliser concentration.
See working
Walkthrough
To plan an investigation into the effect of fertiliser concentration on plant growth, we must systematically address every element of experimental design: what we are changing, what we are measuring, what we are keeping constant, and how we will ensure the results are reliable.
- Define the dependent variable and how to measure it: The question asks for the effect on growth, not just final size. Growth is a change in size over time, so we must measure the height (or mass) of the plants at the start and at the end of the experiment, then calculate the difference. Measuring only at the end would give final size, which is not a valid measure of growth.
- Define the independent variable and its range: The independent variable is the fertiliser concentration. The students only have a solution, so they can only dilute it to make lower concentrations. The plan must use at least three different concentrations, all . A control with fertiliser (using distilled water) is also essential to show whether the fertiliser actually has an effect.
- Identify controlled variables: To ensure a fair test, any other factor that could affect plant growth must be kept constant. This includes the volume of liquid added to each dish, the time left for the plants to grow, light intensity, temperature, and carbon dioxide levels.
- Ensure reliability: Biological specimens vary, so a single plant per concentration is not enough. The plan must include repeats (e.g., multiple dishes per concentration) and state that a mean will be calculated.
- Data analysis: Finally, the plan must state how the results will be used: comparing the mean growth against the different fertiliser concentrations, typically by plotting a graph.
Key Takeaways
- A valid experimental plan must clearly define what is measured, how it is measured, the range of the independent variable, the controlled variables, and how reliability is achieved.
- "Growth" specifically requires a measurement at both the start and the end of the experiment to calculate the change.
- When given a stock solution (e.g., ), the candidate must recognise that they can only dilute it to create lower concentrations for the independent variable range.
Common Mistakes
- Measuring only at the end: Students often write "measure the height of the plants" without specifying that this must be done at the start as well. Without a starting measurement, you cannot calculate growth (change in size).
- Using concentrations : The question states the students have a solution. They cannot make a solution from it; they can only dilute it. Any concentration above is invalid.
- Omitting the control: Forgetting to include a fertiliser (distilled water) dish means there is no baseline to compare the fertilised plants against.
- Vague controlled variables: Writing "keep conditions the same" is not specific enough. The mark scheme requires named variables such as light intensity, temperature, or volume of water.
- Forgetting repeats: A plan with only one plant per concentration is not reliable and will not score the mark for repeats and means.
Things to Be Careful About
- Command word "Plan": The answer must be a structured method or a clear list of steps that a candidate could follow. It is not enough to just list variables; you must describe the procedure (e.g., "measure at start and end", "add same volume").
- Precision in controlled variables: When listing controlled variables, name them explicitly. "Volume of water" and "volume of fertiliser solution" are two different things; both must be controlled.
- Number of points: The mark scheme lists seven creditworthy points for six marks. Providing six clear, distinct points covering measurement, range, volume, time, controlled variables, and repeats is sufficient to earn full marks. Including the final data comparison step is good practice but not strictly required if the other six are present.
Answer
fertiliser concentration
fertiliser concentration
Walkthrough
The independent variable is the factor that the investigator deliberately changes or varies to observe its effect on the dependent variable. In this investigation, the students are testing the effect of different fertiliser concentrations on plant growth. Therefore, the fertiliser concentration is the independent variable.
Key Takeaways
- Independent variable: What you change.
- Dependent variable: What you measure (plant growth / height / mass).
- Controlled variables: What you keep the same (light, temperature, volume of water, etc.).
Common Mistakes
- Confusing independent and dependent variables: Students sometimes write "plant growth" or "height" as the independent variable. Remember: you change the fertiliser to see what happens to the plant growth. The thing you change is independent; the thing that responds is dependent.
- Overcomplicating the answer: The question simply asks to identify the variable. A short, precise answer is all that is required.
Things to Be Careful About
- Exact wording: The mark scheme accepts "fertiliser concentration". Writing just "fertiliser" might be marked incorrect because it does not specify that the concentration is what is being varied. Always be precise with terminology.