Biology 5090/41 — May/June 2024
Cambridge O-Level · Alternative to Practical · worked solutions for every part, with the mark scheme
Topics Experimental Contexts · Analysis, Conclusions and Evaluation · Observations and Measurements · Planning Experiments and Investigations · Use of Techniques, Apparatus and Materials · Microscopy and Biological Drawing
Respiration which releases energy from food in living organisms can be summarised by the following equation:
glucose + oxygen carbon dioxide + water
A student investigated the rate at which oxygen was used for respiration by some small animals. The apparatus shown in Fig. 1.1 was used.
The apparatus was sealed by closing the clip so that any changes in the volume of gases in the test-tube and capillary tube resulted in the drop of coloured liquid moving.
The rate at which the drop of coloured liquid moves is related to the rate of uptake of oxygen by the small animals.
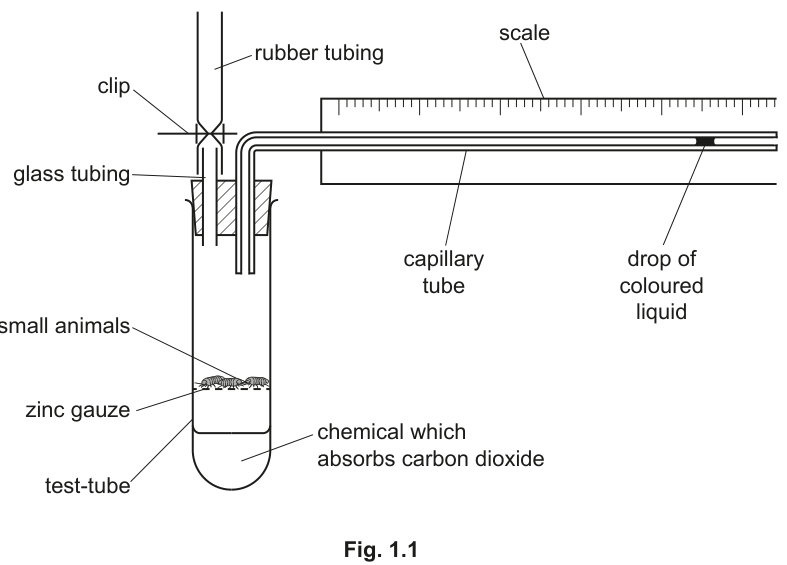
When the small animals in the test-tube respire they take in oxygen and produce carbon dioxide.
Answer
The carbon dioxide is absorbed by the chemical which absorbs carbon dioxide in the test-tube.
It is absorbed by the chemical (which absorbs carbon dioxide) in the test-tube.
Walkthrough
Fig. 1.1 labels a 'chemical which absorbs carbon dioxide' sitting at the bottom of the test-tube beneath the zinc gauze. The small animals respire: they take in oxygen and release carbon dioxide. The question asks what happens to that carbon dioxide — it does not build up in the tube, because it is absorbed by this chemical (a soda-lime type absorbent). This is essential to how a respirometer works: if carbon dioxide were not removed, the volume of gas would stay constant and the drop would not move.
Key Takeaways
- In a respirometer, an absorbent removes the carbon dioxide produced so that only oxygen uptake changes the gas volume.
- Always read apparatus diagrams carefully — the function of each component is often printed on the label.
Common Mistakes
- Writing 'the carbon dioxide is released into the air' or 'it dissolves' — the mark scheme wants absorption by the chemical.
- Saying the animals 'breathe out' the carbon dioxide without saying what happens to it inside the sealed apparatus.
Things to Be Careful About
- This is a 1-mark state question: one short sentence naming the chemical and its action is all that is needed.
Explain why the drop of coloured liquid moves along the capillary tube towards the small animals.
______
Answer
Oxygen is used up by the respiring animals and is not replaced by carbon dioxide because the carbon dioxide is absorbed by the chemical.
The overall volume of gas (and therefore the pressure) in the apparatus decreases, so the drop of coloured liquid moves towards the test-tube.
See working
Walkthrough
This is an explain question, so each point needs its reason. Step 1: the animals respire, taking in oxygen from the air in the sealed test-tube. Step 2: normally breathing out would replace that oxygen with carbon dioxide, keeping the volume constant — but here the carbon dioxide is absorbed by the chemical, so nothing replaces the oxygen. Step 3: with less gas in a sealed system, the total volume of gas falls and the pressure inside drops below atmospheric pressure. Step 4: the outside pressure pushes the coloured liquid drop along the capillary tube towards the region of lower pressure, i.e. towards the small animals. The direction of movement therefore directly measures the rate of oxygen uptake.
Key Takeaways
- A respirometer works because oxygen uptake minus carbon dioxide output determines the gas volume change; absorbing the carbon dioxide makes the change equal to oxygen uptake alone.
- Gas moves (or pushes liquid) from higher pressure towards lower pressure.
Common Mistakes
- The mark scheme rejects answers that only mention oxygen ('A if oxygen only mentioned') — you must also say why the volume/pressure decreases, i.e. no replacement by carbon dioxide.
- R references to 'amount' — talk about volume or pressure of gas, not amount.
- Saying the drop is 'sucked' by the animals, or that the animals pull the liquid — the cause is the pressure difference.
Things to Be Careful About
- Both halves are needed for full marks: (1) oxygen used and not replaced / carbon dioxide absorbed, plus (2) volume or pressure in the apparatus decreases.
At the start of the investigation the student read and recorded the starting position of the drop of coloured liquid against the scale. Then readings were taken every 10 minutes for 40 minutes. All readings were taken at the left side of the drop.
Fig. 1.2 shows the position of the drop at the start and after 40 minutes.
Complete Table 1.1 by inserting these readings.
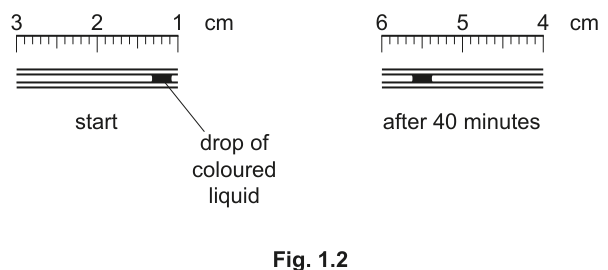
Table 1.1
| time/minutes | position of drop/cm |
|---|---|
| 0 | |
| 10 | 2.5 |
| 20 | 3.9 |
| 30 | 4.2 |
| 40 |
Answer
| time/minutes | position of drop/cm |
|---|---|
| 0 | 1.3 |
| 10 | 2.5 |
| 20 | 3.9 |
| 30 | 4.2 |
| 40 | 5.6 |
0 minutes: 1.3 cm; 40 minutes: 5.6 cm
Walkthrough
In Fig. 1.2 the scales run right to left (3, 2, 1 cm on the start diagram; 6, 5, 4 after 40 minutes), and readings are taken at the LEFT side of the drop as stated in the stem. On the start diagram the left edge of the drop sits just past the 1 cm mark, three tenths beyond it: 1.3 cm. After 40 minutes the left edge sits just past the 5 cm mark, six tenths beyond: 5.6 cm. Insert these into Table 1.1 alongside the given values.
Key Takeaways
- Note the direction a scale runs before reading it.
- Follow the instruction about which edge of the drop to read — here the left side.
Common Mistakes
- Reading the right-hand edge of the drop instead of the left, giving values like 1.1 and 5.4 — the scheme allows only 1 mark for those.
- Misreading the reversed scale direction.
Things to Be Careful About
- Record to one decimal place, matching the given entries (2.5, 3.9, 4.2).
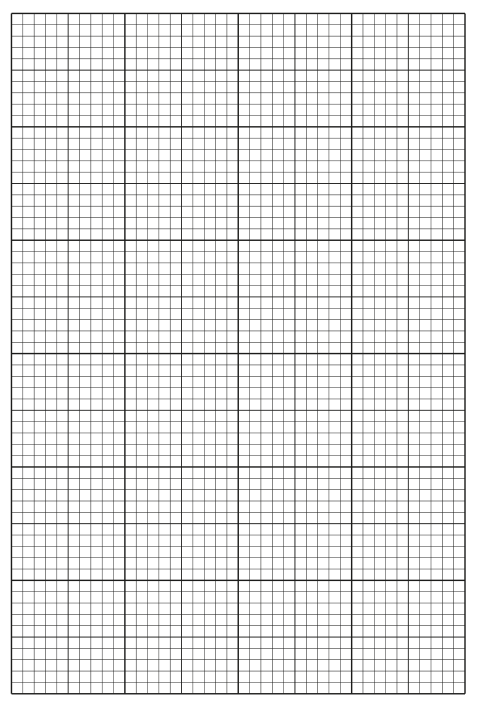
Construct a graph of the data in the completed Table 1.1 on the grid below. Join your plotted points with ruled, straight lines.
Answer
Draw time on the x-axis and position of drop/cm on the y-axis, both axes fully labelled with units. Use linear scales starting at the origin (time 0–40 minutes, position 0–6 cm) filling more than half the grid in each direction. Plot the five points (0, 1.3), (10, 2.5), (20, 3.9), (30, 4.2) and (40, 5.6) accurately, then join them with ruled straight lines between consecutive points, with no extrapolation beyond the plotted data.
Line graph of position of drop/cm against time/minutes with five correctly plotted points joined by ruled straight lines
Walkthrough
Graph construction on 5090 is marked point by point. First decide the variables: time is the independent variable, so it goes on the x-axis; position of drop is the dependent variable on the y-axis. Label BOTH axes fully including units — 'position of drop / cm' and 'time / minutes' (the scheme rejects just 'T'). Second, choose linear scales that start with a value at the origin and use at least half the grid in each direction: 0–40 minutes across and 0–6 cm up works well on the printed grid. Third, plot each of the five points precisely — within half a small square, with the line passing through the centre of each point. Fourth, join consecutive points with ruled straight lines (this paper's instruction); do not draw a smooth curve unless asked, and never extrapolate beyond the last point.
Key Takeaways
- Independent variable on x-axis, dependent on y-axis, both fully labelled with units.
- Scales must be linear, start at the origin, and fill at least half the grid.
- Plot accuracy is checked to half a small square.
Common Mistakes
- Swapping the axes or leaving units off the axis labels.
- Using awkward scales (e.g. 3 squares per 5 minutes) that make plotting error-prone.
- Extrapolating the line beyond 40 minutes or back before 0 minutes.
- Freehand lines — they must be ruled.
Things to Be Careful About
- The scheme accepts dots alone for plots but rejects anything over half a square out of position, and rejects a line not passing through the centre of a point.
Use your graph to estimate the position of the drop at 25 minutes.
Show your working on the graph.
position of drop at 25 minutes = ______
Answer
On the graph, draw a vertical ruled line up from 25 minutes on the x-axis until it meets the plotted line, then a horizontal ruled line across to the y-axis. Read off the value where it crosses the y-axis.
position of drop at 25 minutes = 4.05 cm
4.05 cm (accept a correct reading from the candidate's own graph)
Walkthrough
25 minutes lies between your plotted points at 20 and 30 minutes, so this is interpolation — reading a value from within the range of your own data, which is always acceptable (unlike extrapolation). Draw the construction lines on the graph itself, because 'show your working on the graph' is a marking point: a single vertical line from 25 minutes to the curve, then horizontally to the axis. Where the horizontal meets the y-axis gives the position. From the correct graph this is about 4.05 cm; the scheme accepts any correct reading from the candidate's own graph, since slight differences in plotting shift the interpolated value slightly.
Key Takeaways
- Interpolation = reading between plotted points; extrapolation = reading beyond them and is rejected.
- Construction lines drawn on the graph count as working and earn a mark.
Common Mistakes
- Reading from the wrong axis or misreading the scale.
- Not drawing the construction lines, losing the working mark.
- Omitting the unit 'cm', which is a separate mark.
Things to Be Careful About
- Three marks: correct value from the graph, working shown on the graph, correct unit.
Working
Answer
distance moved by the drop = 4.3 cm
4.3 cm
Walkthrough
The distance moved during the whole investigation is simply the final position minus the starting position: 5.6 cm − 1.3 cm = 4.3 cm. Because the drop only moves in one direction, no other correction is needed.
Key Takeaways
- Distance moved = final reading − initial reading.
Common Mistakes
- Subtracting the wrong way round or using intermediate readings such as the 20-minute value.
- Forgetting the unit cm.
Things to Be Careful About
- If you misread the table in (b)(i), the error carries forward (ecf): use YOUR values consistently here and in (c)(ii).
Calculate the rate of movement of the drop during the investigation in cm per minute.
Show your working.
rate of movement of drop = ______ cm per minute
Working
Rounded to 2 decimal places:
Answer
rate of movement of drop = 0.11 cm per minute
0.11 cm per minute (working shown)
Walkthrough
A rate is a quantity divided by time. Here the distance the drop moved (4.3 cm, from (c)(i)) divided by the total investigation time (40 minutes) gives 0.1075 cm per minute. The question asks for 2 decimal places, so round 0.1075 to 0.11. Always show the division as working — the scheme awards a separate mark for it.
Key Takeaways
- rate = distance ÷ time.
- Round only at the end, to the precision demanded.
Common Mistakes
- Dividing by 30 or another time interval instead of the full 40 minutes.
- Giving 0.1075 unrounded when 2 decimal places are asked for.
- No working shown — that loses a mark even with the right answer.
Things to Be Careful About
- The scheme gives ecf if you use your own (c)(i) distance, but there is NO ecf for an incorrect expression — the division must be set up correctly.
Answer
Repeating allows anomalous results (outliers) to be identified.
Repeats allow a mean to be calculated, making the results more reliable.
To identify anomalies/outliers and to make the results more reliable (e.g. by calculating a mean)
Walkthrough
Any single run of an experiment can give an unusual result — perhaps an animal was unusually active, or the clip leaked slightly. Repeating the investigation several times lets the student spot any result that does not fit the pattern (an anomaly or outlier) and calculate a mean from consistent results, which makes the conclusions more reliable. Reliability means the results are repeatable and trustworthy, not that they are 'accurate' — the mark scheme explicitly rejects references to accuracy, precision or validity here.
Key Takeaways
- Repeats → identify anomalies → mean → more reliable results.
- Know the difference between reliable (consistent, repeatable) and accurate (close to the true value).
Common Mistakes
- The scheme Ig 'to stop / avoid making errors' — too vague to score.
- R references to accuracy, precise and valid (e.g. 'in accurate and reliable') — use the word reliable.
- Giving only one of the two points.
Things to Be Careful About
- Two marks: name anomalies AND reliability. Say 'more reliable', not 'more accurate'.
Answer
Set up identical apparatus with no small animals in the test-tube (everything else the same).
Same apparatus but with no animals (or the animals replaced with something inert)
Walkthrough
A control checks that the result being measured is really due to the factor being investigated — here, the living animals. Run the identical apparatus, sealed in the same way, but with no animals inside. Any tiny movement of the drop in the control would show that something other than the animals' respiration (temperature change, leakage) is affecting the apparatus, so the control provides a baseline against which the experimental result is judged.
Key Takeaways
- A control is identical to the experiment except that the factor being tested (the living animals) is absent.
Common Mistakes
- Describing a repeat rather than a control.
- Changing other conditions as well — everything must stay the same except the removal of the animals.
Things to Be Careful About
- One mark: 'same apparatus, no animals' — the scheme also accepts replacing the animals with something inert.
Fig. 2.1 shows four arthropods.
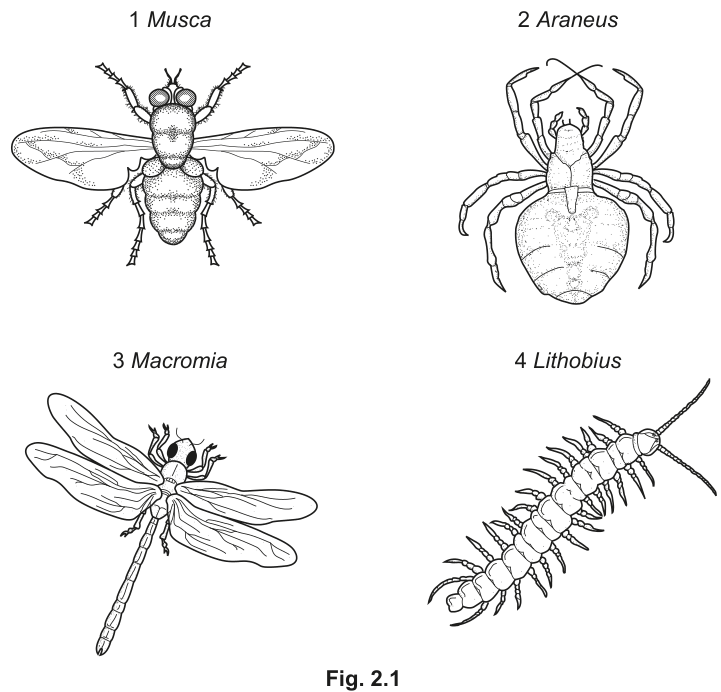
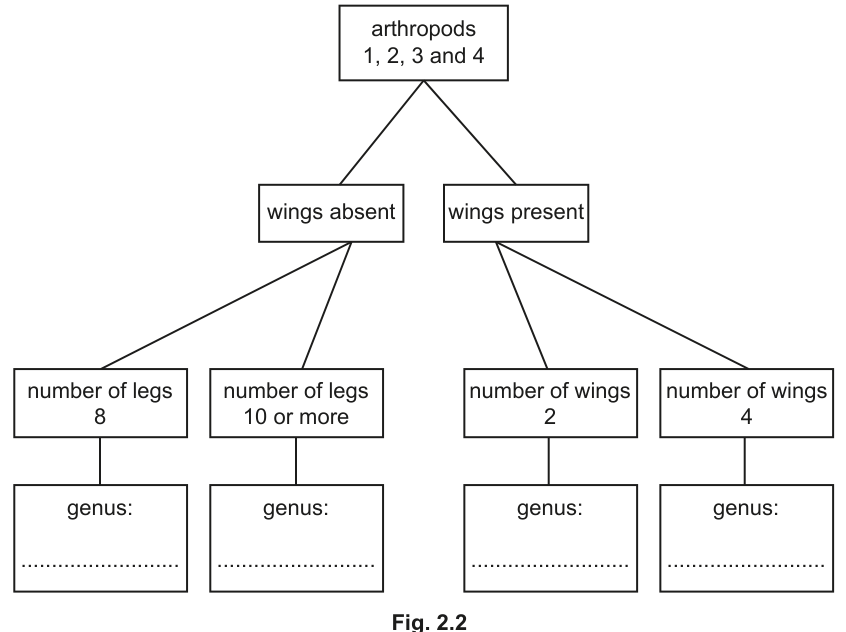
Use the key to identify each arthropod. Complete the key by writing one genus name in each of the four boxes.
Answer
| branch in key | genus |
|---|---|
| wings absent, number of legs 8 | Araneus |
| wings absent, number of legs 10 or more | Lithobius |
| wings present, number of wings 2 | Musca |
| wings present, number of wings 4 | Macromia |
Araneus, Lithobius, Musca, Macromia (in that key order)
Walkthrough
A dichotomous key splits the organisms into two groups at each step using one visible feature. Start at the top box containing all four arthropods. The first split is wings absent versus wings present. Look at Fig. 2.1: the spider (Araneus) and the centipede (Lithobius) have no wings; the housefly (Musca) has two wings; the dragonfly (Macromia) has four wings.
Follow the 'wings absent' branch next. It splits by number of legs: 8 versus 10 or more. The spider has exactly 8 legs, so it goes to Araneus. The centipede has very many pairs of legs — far more than 10 — so it goes to Lithobius.
On the 'wings present' branch, split by number of wings: 2 versus 4. The fly has one pair of wings = 2 wings, so Musca. The dragonfly has two pairs = 4 wings, so Macromia.
The mark scheme awards all three marks only for the complete correct order Araneus, Lithobius, Musca, Macromia.
Key Takeaways
- A dichotomous key works by successive either/or choices on observable features.
- Counting structures accurately (legs, wings) is the skill being tested — count carefully rather than guessing from overall appearance.
- Genus names are written with a capital first letter and underlined or italicised.
Common Mistakes
- Confusing the number of wings: a dragonfly's four wings are two pairs; counting 'pairs' instead of individual wings puts Musca and Macromia the wrong way round.
- Writing the names in the wrong boxes because the candidate matched by overall look ('that looks like a spider') without following the key's stated feature.
- Spelling the genus names incorrectly or failing to capitalise them.
Things to Be Careful About
- The mark scheme gives all three marks for the complete correct set — one wrong name can cost more than one mark, so check every count before writing.
- Use the features printed in the key (wings, then leg/wing number), not your own preferred features.
Describe a difference in one other feature, not used in the key, to distinguish between Araneus and Lithobius.
Araneus ______
Lithobius ______
Answer
Araneus: body divided into two parts (cephalothorax and abdomen); no antennae.
Lithobius: body made of many similar segments; has a pair of long antennae.
Any one difference not used in the key, e.g. Lithobius has antennae but Araneus does not
Walkthrough
The question asks for a difference in a feature NOT used in the key — so wings and numbers of legs are ruled out. Look at the drawings again for other visible differences:
- Lithobius clearly has a pair of long jointed antennae at the head end; Araneus has none.
- Lithobius has many similar body segments along its whole length; Araneus has a compact body of two distinct regions.
- Lithobius carries legs on almost every segment; Araneus has legs attached only to the front body region.
Any one of these differences, stated for both animals, earns the single mark.
Key Takeaways
- When asked for a feature 'not used in the key', you must avoid the key's own characters (wings, leg/wing counts).
- A good comparison names the feature in both organisms.
Common Mistakes
- Reusing a key feature such as 'number of legs is 8 vs many' — this scores nothing because it was used in the key.
- Describing only one organism instead of giving the contrast between the two.
- Naming an internal feature that cannot be seen in the drawing.
Things to Be Careful About
- The mark scheme accepts several alternatives (antennae, segmentation, shape, leg distribution, joints in the leg) — pick the clearest one you can actually see in Fig. 2.1.
Fig. 2.3 is a photograph of an immature arthropod that lives in water.
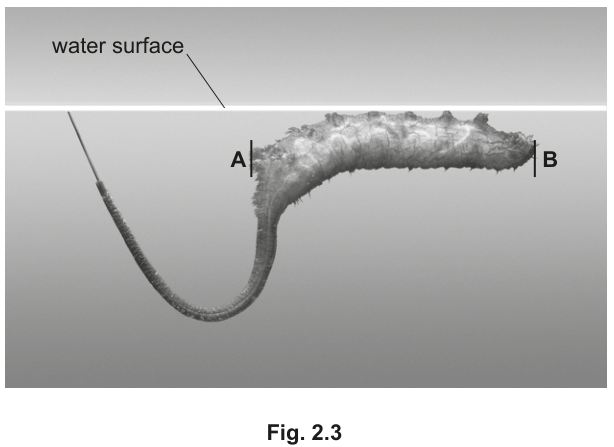
In the space below make a large drawing of the immature arthropod as it appears in the photograph.
Answer
Large clean pencil drawing of the immature arthropod, at least 75 mm long, horizontal, with unshaded continuous outlines, thin tapering tail closed off at the tip, prolegs/tube feet along the level part of the body, and tail aligned with the body
Walkthrough
This is a standard 5090 biological drawing task, and most of the marks are for HOW you draw, not artistic talent. Work through the mark scheme points:
- Orientation and line quality: draw the animal approximately horizontal, as in the photograph, using a sharp pencil in clear, clean, continuous lines. Never use shading, stippling or cross-hatching — this loses marks immediately.
- Size: the body must be at least 75 mm long. Measure your drawing against a ruler before you finish.
- Tail detail: the long breathing tube narrows towards its free end; draw it thinner at the end and close it off cleanly (a delimited tip), not left open or ragged.
- Prolegs / tube feet: along the straighter, level part of the body there are small projections — draw these in the correct positions.
- Alignment: the tail should continue in line with the curve/direction of the body as in the photograph, not stuck on at an odd angle.
Draw only what you can see, in the right proportions, and keep the outline smooth.
Key Takeaways
- Biological drawings are judged on conventions: sharp pencil, continuous lines, no shading, large size, correct proportions.
- Specific structural detail named by the mark scheme (here the delimited tail tip and the prolegs) carries dedicated marks.
Common Mistakes
- Shading or stippling to show texture — always rejected.
- Drawing too small; the 75 mm minimum is a marked point.
- Leaving the tail tip open or blobby instead of closing it off neatly.
- Omitting the small prolegs/tube feet along the body.
- Drawing the tail at the wrong angle relative to the body.
Things to Be Careful About
- Check the size with a ruler — 'large' means a stated minimum here, 75 mm.
- Keep the drawing horizontal like the photograph; a vertical or diagonal layout can lose the orientation point.
Draw a straight line to join A and B on the photograph in Fig. 2.3. This is the length of the body of the arthropod as it appears in the photograph. Measure and record this length.
______
Answer
Length AB measured with a ruler = (accepted range 49–51 mm)
49–51 mm (or 5 cm), measured with the unit stated
Walkthrough
Place a ruler so that zero (or a chosen reference mark) sits exactly on point A, read across to point B, and record the distance. On the printed photograph this comes to about 50 mm; the mark scheme accepts any value from 49 to 51 mm, or 5 cm. The unit must be written — a bare number loses the mark.
Key Takeaways
- Always state units with a measurement.
- Examiners allow a small tolerance band around the true value because print sizes vary.
Common Mistakes
- Recording the number without the unit.
- Measuring along the curved body instead of the straight line joining A and B.
- Reading carelessly so the value falls outside the accepted range.
Things to Be Careful About
- Draw the line with a ruler directly from A to B as instructed, then measure that line.
The length of the body of the actual arthropod is . Use this value to calculate the magnification of the photograph to 1 decimal place.
______
Working
Rounded to 1 decimal place:
Answer
×3.1
Walkthrough
Magnification compares the size of the image with the real object:
Both lengths must be in the same units. Your measurement from (b)(ii) is about 50 mm and the actual arthropod is given as 16 mm, so divide 50 by 16 = 3.125, which rounds to 3.1 at 1 decimal place. Because both values were in millimetres, the units cancel and magnification has no unit — it is written with a multiplication sign, . If your measurement was 49 mm you get 3.06 → 3.1; if 51 mm, 3.19 → 3.2. All these are accepted because they follow correctly from your own reading (error carried forward).
Key Takeaways
- Magnification = image size ÷ actual size, with matching units.
- Magnification is written as × followed by the number, never with a unit.
- Round only at the end, to the precision demanded.
Common Mistakes
- Dividing the wrong way up (16 ÷ 50 ≈ 0.32).
- Mixing units (measuring in cm but dividing by mm) — convert first.
- Giving the answer without the × sign, or leaving it unrounded at 3.125 when 1 decimal place was asked for.
Things to Be Careful About
- Use YOUR value from (b)(ii); the scheme credits the answer consistent with your own measurement (ecf).
- Write the final answer as , keeping the multiplication sign.
A student investigated the effect of exercise on their heart rate.
The student measured their heart rate when resting. They did this by sitting down and counting the number of heartbeats in 15 seconds and then multiplying that to get the number in 60 seconds.
The student then exercised for 10 minutes. After 10 minutes the student stopped exercising and measured their heart rate for the 3 minutes after stopping.
Table 3.1 shows some of their results.
Table 3.1
| time after exercise in minutes | heartbeats in 15 seconds | heartbeats per minute |
|---|---|---|
| 1 | 33 | 132 |
| 2 | 26 | 104 |
| 3 | 22 | |
| total number of heartbeats in 3 minutes: |
Working
Answer
Time 3: 88 heartbeats per minute.
Total number of heartbeats in 3 minutes: 324.
88 and 324
Walkthrough
The student counted heartbeats over 15 seconds and multiplied by 4 to express the rate per minute, because there are four 15-second periods in a minute. At time 3 the count was 22, so the rate per minute is . The final row asks for the total number of heartbeats across the whole 3 minutes after exercise, which is the sum of the three per-minute values: .
Key Takeaways
Converting a count over a fraction of a minute into a rate per minute, and summing rates to find a total. This is a routine calculation on the Alternative to Practical paper.
Common Mistakes
- Forgetting to multiply the 15-second count by 4.
- Adding the three 15-second counts instead of the three per-minute values for the total.
Things to Be Careful About
The missing value in the third row is 88 (not 22), and the total is the sum of the per-minute values (not the sum of the 15-second counts). Both marks are for arithmetic, so check the multiplication and the addition.
The student’s heart rate when resting was 68 heartbeats per minute.
Use this information and the data in the table to describe the changes in the student’s heart rate during this investigation.
______
Answer
Heart rate increases with exercise and decreases after exercise stops; it does not return to the resting value of 68 after 3 minutes.
Increases with exercise, decreases after; does not return to resting value after 3 minutes
Walkthrough
The resting rate is given as 68 beats per minute. The three readings after exercise are 132, 104 and 88 — all well above 68. The first marking point requires the observation that the heart rate increased with exercise and is now decreasing after exercise stopped. The second point requires the observation that after 3 minutes the rate (88) is still above the resting value of 68, so it has not returned to normal.
Key Takeaways
Reading a small table of results and comparing values against a baseline to describe a trend.
Common Mistakes
- Only saying "the heart rate decreases" without mentioning that it first increased with exercise.
- Saying the heart rate "returns to normal" when it is still above 68.
Things to Be Careful About
Both marking points must appear: the increase with exercise plus the decrease after, and the fact that it has not returned to the resting value after 3 minutes. Use the given resting value of 68 to support the comparison.
The time it takes for the heart rate to return to its normal resting rate after exercise depends on the person’s fitness. A fit person’s heart rate returns to normal in a shorter time.
Answer
- Measure each athlete's resting pulse rate before exercise: place a finger on the pulse at the wrist, count heartbeats for 15 seconds using a stopwatch, and multiply by 4 to give beats per minute.
- Both athletes perform the same type of exercise at the same intensity for the same length of time.
- After exercise, measure each athlete's pulse rate at fixed intervals (for example every minute) until it returns to the resting rate.
- Repeat the investigation at least three times for each athlete and calculate the mean pulse rate at each time.
- The fittest athlete is the one whose pulse rate returns to the resting rate in the shorter time.
See working
Walkthrough
This is a planning question worth 6 marks, and the mark scheme lists more points than the total, so aim to cover each category. First, describe how the pulse is measured: finger on the pulse, count beats for 15 seconds with a stopwatch, multiply by 4 to get beats per minute. Second, measure the resting pulse before exercise. Third, control the variables so the comparison is fair: both athletes do the same type and intensity of exercise for the same time, and ideally are the same age and gender. Fourth, take the pulse at fixed intervals after exercise. Fifth, repeat at least three times and calculate a mean for reliable results. The fittest athlete is the one whose pulse returns to the resting rate in the shorter time.
Key Takeaways
A good plan includes a clear method, a fair test with controlled variables, and repeats with a mean for reliability.
Common Mistakes
- Not controlling the exercise (different intensity or duration).
- Taking only a single measurement.
- Not measuring the resting rate before exercise.
- Giving a vague method such as "count the heartbeat" without the stopwatch and the step.
Things to Be Careful About
Cover the repeats and mean for reliability, and end by stating how the results answer the question (shorter recovery time = fitter). The mark scheme credits "same type/intensity of exercise", "same age/gender", "same time for exercise", and "pulse rate taken after exercise at fixed intervals" as separate points.
Answer
Heart / pulse rate (or the time for the pulse rate to return to the resting rate).
Heart / pulse rate
Walkthrough
The dependent variable is the one that is measured and changes as a result of the investigation. Here it is the heart/pulse rate, or alternatively the time it takes for the pulse rate to return to the resting rate.
Key Takeaways
Distinguishing the dependent variable (what you measure) from the independent variable (what you change) and the controlled variables (what you keep the same).
Common Mistakes
- Giving the independent variable (the exercise) or a controlled variable (age, gender, intensity).
Things to Be Careful About
Either "heart/pulse rate" or "time for pulse rate to return to resting" is accepted — give one of these.