Biology 5090/32 — May/June 2024
Cambridge O-Level · Practical Test · worked solutions for every part, with the mark scheme
Topics Experimental Contexts · Microscopy and Biological Drawing · Observations and Measurements · Use of Techniques, Apparatus and Materials · Analysis, Conclusions and Evaluation · Planning Experiments and Investigations
You are going to investigate the structure and nutrient content of a flower. You are provided with a flower and samples of substances A and B from a flower.
Carefully remove some petals from the flower so that you leave two petals that are next to each other.
Place the flower with two petals on the white tile. Ensure that the petals are resting on the tile so that you can see the internal parts of the flower clearly. Examine the flower carefully with a hand lens.
Make a large drawing of the two petals and the internal parts of the flower in the space below.
Answer
A large biological drawing showing two adjacent petals at the back, with the internal reproductive parts in front:
- Outline: Clear, clean, continuous single lines drawn with a sharp pencil. No shading, stippling, or cross-hatching anywhere.
- Size: At least 90 mm wide in either direction.
- Petals: Two petals drawn behind the internal parts.
- Stamens: Several stamens drawn. Each filament is drawn as a double line, with a clearly delimited anther at its tip. All anthers are positioned below the level of the stigma.
- Pistil: The style is drawn as a double line rising centrally to a stigma at the top.
Large labelled drawing of two petals and the internal parts of the flower
Walkthrough
The question asks for a large biological drawing of a flower with two petals retained. In the Practical Test, biological drawings are scored heavily on conventions as much as on content. We must ensure the drawing meets the size requirement, uses the correct line quality, and includes the specific structures named in the mark scheme.
- Line quality and size: The outline must be continuous, clean, and drawn with a sharp pencil. Shading is strictly rejected. The overall width must be at least 90 mm.
- Petals: Two adjacent petals must be drawn, typically shown at the back to reveal the internal parts.
- Stamens: These are the male parts. Each consists of a filament (drawn as a double line to represent the tube) and an anther at the tip (clearly delimited, often drawn as a small oval or capsule). They must be positioned below the stigma.
- Pistil (female part): The style is drawn as a double line rising to the stigma at the top. The stigma is where pollen lands.
Key Takeaways
Biological drawings require strict adherence to conventions: continuous sharp pencil lines, no shading, minimum size requirements, and double lines for walls/stalks. Structural detail (delimited anthers, style double line) is often the difference between scoring and losing marks.
Common Mistakes
- Using shading, stippling, or cross-hatching.
- Drawing lines that are not continuous or using a blunt pencil.
- Forgetting to draw the anthers as clearly delimited structures separate from the filament.
- Drawing the anthers above the level of the stigma.
- Not meeting the minimum size requirement (90 mm).
Things to Be Careful About
- The mark scheme explicitly rejects shading. Keep the drawing clean.
- Filaments and the style must be drawn with a double line to represent their tubular nature.
- Anthers must be delimited (clearly separated from the filament), not just a blob at the end of a single line.
- Ensure the drawing is at least 90 mm wide; measure it before finishing.
On your drawing, draw a line and label it P to show where pollen must land when pollination takes place.
Answer
Draw a straight label line from outside the drawing to the top of the stigma (the receptive tip of the style). Label the line P.
Label line from outside the drawing to the top of the stigma, labelled P
Walkthrough
Pollination is the transfer of pollen to the stigma. The question asks to label where pollen must land. This is the stigma, which is the receptive tip at the top of the style.
- Locate the stigma at the top of the central style in the drawing from (a)(i).
- Draw a single straight label line from outside the drawing boundary to the top of the stigma.
- Write the letter P at the end of the label line.
Key Takeaways
The stigma is the specific structure that receives pollen during pollination. Label lines must be straight, unbroken, and never cross each other or any drawn structures.
Common Mistakes
- Pointing the label line to the style or the ovary instead of the stigma.
- Using a curved or ruled line for the label.
- Forgetting to include the letter P.
Things to Be Careful About
- The label line must point to the top of the stigma, not the side or the style.
- Label lines must not touch the structures they are labelling except at the very tip where they indicate the structure.
You are going to test substances A and B for their nutrient content using Benedict's solution, biuret reagent and iodine solution.
Draw a table in which to record the results of your tests in the space below.
Answer
| Test / Reagent | Colour / Observation for Substance A | Colour / Observation for Substance B |
|---|---|---|
| Benedict's solution | ||
| Biuret reagent | ||
| Iodine solution |
Table construction requirements:
- All columns and rows drawn with ruled lines.
- All information (headers and data cells) written entirely within the table boundaries.
- Substances A and B stated once only as overarching column headers.
- Reagents (Benedict's, biuret, iodine) stated once only as row headers.
- Overarching headers naming the test/reagent and the colour/observation/results.
See working
Walkthrough
The candidate must design a table to record food test results. The mark scheme awards marks for table construction conventions, not just the content.
- Ruled lines: The table must have clear, ruled rows and columns. No information should be written outside the table boundaries.
- Headers: The substances being tested (A and B) must be column headers. The reagents used (Benedict's, biuret, iodine) must be row headers.
- Overarching headers: The columns need a main header like "Colour / Observation / Results" and the rows need a main header like "Test / Reagent / Solution".
Key Takeaways
Results tables in the Practical Test are marked on structure. All data must be inside the table, headers must be clear, and units or observation types must be specified.
Common Mistakes
- Writing headers or data outside the table lines.
- Forgetting overarching headers (e.g., just writing "A" and "B" without "Colour" or "Observation").
- Repeating substance names in every row instead of using a single column header.
Things to Be Careful About
- Ensure the table has enough rows and columns for all three reagents and two substances.
- Use ruled lines for the table; freehand wobbly lines may not score.
- The mark scheme accepts variations in header wording (e.g., "Test" vs "Reagent"), but the concept must be clear.
To carry out the tests, follow these instructions, making sure that you label the test-tubes so that you know which test is being done on which substance.
Raise your hand when you are ready to be supplied with hot water in your water-bath.
Measure and record the temperature of the water in the water-bath. ______
Answer
30 – 90 (any value within this inclusive range, with the unit )
Working
Benedict's test requires heating in a water-bath. The mark scheme specifies an acceptable temperature range for the water-bath to ensure the reaction proceeds without boiling off the reagent.
Answer
50 (example value within 30–90 )
30 – 90
Walkthrough
The question asks for the temperature of the water-bath used for the Benedict's test. This is a standard practical procedure.
- Range: The water-bath must be hot enough to drive the reaction but not boiling. The mark scheme accepts any temperature between 30 and 90 inclusive.
- Unit: The unit must be . Writing just a number without units will lose the mark.
Key Takeaways
Always include units when recording measurements. For food tests involving heating, a water-bath at 30–90 is standard.
Common Mistakes
- Forgetting the unit .
- Recording a temperature outside the 30–90 range (e.g., room temperature or boiling water at 100 ).
- Writing "degrees" instead of the symbol .
Things to Be Careful About
- The mark scheme explicitly requires the unit .
- Any value between 30 and 90 inclusive scores. Do not overthink this; just record a plausible water-bath temperature.
- Pour about depth of substance A into each of three clean test-tubes.
- Add about depth of Benedict's solution to one of these test-tubes and place it in your hot water-bath.
- Add about depth of biuret reagent to another one of these test-tubes and place it in the test-tube rack.
- Add a few drops of iodine solution to the third test-tube and place it in the test-tube rack.
- After five minutes observe these test-tubes and observe the colour of the solution at the end of each test.
- Repeat the above procedure with clean test-tubes and substance B. Raise your hand if you require more hot water. You do not need to record the temperature of the water again.
Record your observations in the table you have drawn in (b)(i).
Answer
| Test / Reagent | Colour / Observation for Substance A | Colour / Observation for Substance B |
|---|---|---|
| Benedict's solution | green / yellow / orange / brick-red | blue |
| Biuret reagent | blue | purple / lilac / violet |
| Iodine solution | brown / yellow | brown / yellow |
Explanation of results:
- Substance A: Benedict's test is positive (colour change to green/yellow/orange/red), indicating a reducing sugar. Biuret and iodine are negative (remain blue and brown/yellow).
- Substance B: Biuret test is positive (colour change to purple/lilac), indicating protein. Benedict's and iodine are negative (remain blue and brown/yellow).
See working
Walkthrough
The candidate must record the expected observations for food tests on substances A and B. Based on the mark scheme, Substance A tests positive for reducing sugar, and Substance B tests positive for protein.
- Benedict's test: Tests for reducing sugars. Positive result: blue green yellow orange brick-red precipitate (on heating). Negative result: remains blue.
- Biuret test: Tests for proteins. Positive result: blue purple / lilac / violet. Negative result: remains blue.
- Iodine test: Tests for starch. Positive result: brown/yellow blue-black. Negative result: remains brown/yellow.
Filling the table:
- Substance A: Benedict's is positive (green/yellow/orange/red), biuret is negative (blue), iodine is negative (brown/yellow).
- Substance B: Benedict's is negative (blue), biuret is positive (purple/lilac), iodine is negative (brown/yellow).
Key Takeaways
Memorise the starting and ending colours for the three main food tests. A positive result always involves a distinct colour change from the reagent's original colour.
Common Mistakes
- Confusing the positive colour for biuret (purple/lilac) with iodine (blue-black).
- Forgetting that Benedict's test requires heating, so the initial colour is blue, not the final colour.
- Writing "positive" or "negative" instead of the actual colour observation.
Things to Be Careful About
- The mark scheme accepts multiple correct colours for a positive Benedict's test (green, yellow, orange, or brick-red) depending on the concentration of reducing sugar.
- For biuret, accept purple, lilac, violet, or mauve.
- Always record the colour of the final mixture, not the reagent's original colour.
Answer
substance A: reducing sugar (or glucose / maltose)
substance B: protein
Working
- Substance A gave a positive Benedict's test (colour change to green/yellow/orange/red), which indicates the presence of a reducing sugar.
- Substance B gave a positive biuret test (colour change to purple/lilac), which indicates the presence of protein.
- Both substances gave negative iodine tests (remained brown/yellow), so neither contains starch.
A: reducing sugar; B: protein
Walkthrough
This part asks to state the nutrients present based on the food test results. We link the positive test results to the specific nutrients they detect.
- Substance A: Positive Benedict's test reducing sugar (e.g., glucose, maltose). Negative biuret and iodine tests rule out protein and starch.
- Substance B: Positive biuret test protein. Negative Benedict's and iodine tests rule out reducing sugar and starch.
Key Takeaways
Each food test is specific to a nutrient:
- Benedict's reducing sugar
- Biuret protein
- Iodine starch
Common Mistakes
- Stating "sugar" instead of "reducing sugar" (not all sugars give a positive Benedict's test; sucrose is negative).
- Stating "amino acid" instead of "protein" (biuret tests for peptide bonds in polypeptides/proteins, not free amino acids).
- Forgetting to answer for both substances.
Things to Be Careful About
- Use the precise term reducing sugar, not just "sugar" or "glucose" (though glucose is accepted as an example).
- Use protein, not "peptide" or "amino acid".
Fig. 1.1 is a photomicrograph of a pollen grain.
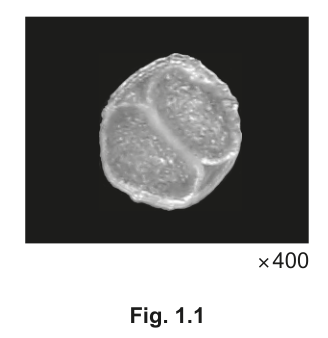
Measure and record the diameter of the pollen grain at its widest point.
diameter = ______
Answer
24 – 29 mm (any value within this range, measured at the widest point of the pollen grain in Fig. 1.1)
Working
Using a ruler, measure the diameter of the pollen grain in Fig. 1.1 at its widest point. The mark scheme accepts any reading between 24 mm and 29 mm. Ensure the measurement is taken across the broadest part of the grain, not the narrower axis.
24 – 29 mm
Walkthrough
The candidate must measure the diameter of the pollen grain from the provided photomicrograph (Fig. 1.1). This is a direct measurement task.
- Place a ruler against the printed image (or use the on-screen measurement tool if digital).
- Measure the widest point of the pollen grain. In Fig. 1.1, the grain is roughly oval with a division; measure across the maximum width.
- The mark scheme provides an accepted range of 24 – 29 mm to account for slight variations in print size or screen resolution.
Key Takeaways
When measuring from printed images, always measure the widest or longest dimension as specified. Acceptance ranges are provided to accommodate minor measurement differences.
Common Mistakes
- Measuring the wrong axis (e.g., the narrower length instead of the widest diameter).
- Recording a value outside the 24–29 mm range.
- Forgetting to include the unit mm.
Things to Be Careful About
- The question asks for the diameter at its widest point. Do not measure the length if the grain is oval.
- Ensure the unit mm is included in the final answer.
Calculate the diameter of the actual pollen grain and record your answer to 2 decimal places.
diameter of the actual pollen grain = ______
Working
Using the measured diameter from (c)(i), for example, :
Convert to micrometres () for a more appropriate unit:
To 2 decimal places: (or )
Answer
(or equivalent, e.g., , based on the measurement in (c)(i))
General formula:
Convert to by multiplying by 1000.
See working
Walkthrough
This part tests the candidate's ability to calculate actual size from an image size and magnification. The magnification is given as in Fig. 1.1.
- Formula:
- Substitution: Use the measured value from (c)(i). Let's assume .
- Unit conversion: Actual sizes of pollen grains are typically expressed in micrometres (). Multiply by 1000: .
- Precision: The question asks for the answer to 2 decimal places. So, or (if keeping in mm, though is standard).
The mark scheme awards marks for: the correct division by 400, the correct numerical answer to 2 decimal places, and the inclusion of a unit.
Key Takeaways
Always use the correct formula: . Convert units to make the answer biologically meaningful (mm to for cells/pollen).
Common Mistakes
- Multiplying by magnification instead of dividing.
- Forgetting to convert mm to (or failing to include a unit).
- Not rounding to 2 decimal places as requested.
- Using the wrong magnification (e.g., 40 instead of 400).
Things to Be Careful About
- The question asks for the answer to 2 decimal places. Ensure your final number reflects this (e.g., , not just ).
- The unit is mandatory. without will lose a mark.
- Error carried forward (ecf): if the candidate used a wrong value in (c)(i) but applied the formula correctly in (c)(ii), they still get credit for the calculation.
Fig. 1.2 is a photomicrograph of a pollen grain from a different species of plant.
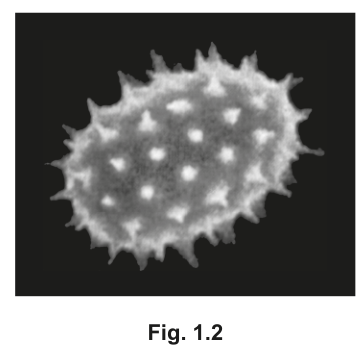
Describe two visible differences in the structure of the pollen grains in Fig. 1.1 and Fig. 1.2.
| Fig. 1.1 pollen grain | Fig. 1.2 pollen grain | |
|---|---|---|
| 1 | ||
| 2 |
Answer
| Fig. 1.1 pollen grain | Fig. 1.2 pollen grain | |
|---|---|---|
| 1 | oval / elongated shape | round / circular / spherical shape |
| 2 | smooth surface / no spikes or projections | rough surface / has spikes or projections |
(Alternative difference: Fig. 1.1 has an internal division/line, Fig. 1.2 has no internal division.)
Working
Compare the two photomicrographs:
- Fig. 1.1: The pollen grain is roughly oval or elongated. It has a smooth granular surface with no large projections. It also shows an internal division or line.
- Fig. 1.2: The pollen grain is round or circular. It is covered in numerous pointed spikes or projections (rough surface).
Select two clear, visible differences and present them in the table.
See working
Walkthrough
The candidate must describe two visible structural differences between the pollen grains in Fig. 1.1 and Fig. 1.2. This tests observation skills and the ability to articulate differences.
- Shape: Fig. 1.1 is oval or elongated. Fig. 1.2 is round, circular, or spherical.
- Surface texture: Fig. 1.1 has a smooth or granular surface with no spikes. Fig. 1.2 has a rough surface covered in spikes, prickles, or projections.
- Internal features (optional): Fig. 1.1 shows an internal division or line. Fig. 1.2 appears solid with no internal division.
The mark scheme accepts any two of these differences, as long as they are clearly stated for both figures.
Key Takeaways
When comparing specimens, look for differences in shape, size, surface texture, and internal structures. Use precise descriptive language (e.g., "spikes" instead of "bumps").
Common Mistakes
- Describing similarities instead of differences.
- Using vague language like "different" or "not the same".
- Failing to state the difference for both figures (e.g., only saying "Fig. 1.2 has spikes" without mentioning Fig. 1.1 is smooth).
- Confusing the two figures (attributing Fig. 1.2 features to Fig. 1.1).
Things to Be Careful About
- The table has columns for Fig. 1.1 and Fig. 1.2. Ensure you fill in the correct description for each column.
- The mark scheme explicitly accepts "spikes present / rough surface" for Fig. 1.2 and "spikes absent / smooth surface" for Fig. 1.1.
- Only two differences are required; providing more will not earn extra marks but ensure the two you provide are correct.
A student investigated the number of plants on a school field.
This was done by examining small samples of the field using a square frame measuring .
Fig. 2.1 shows the plants in one of these samples.
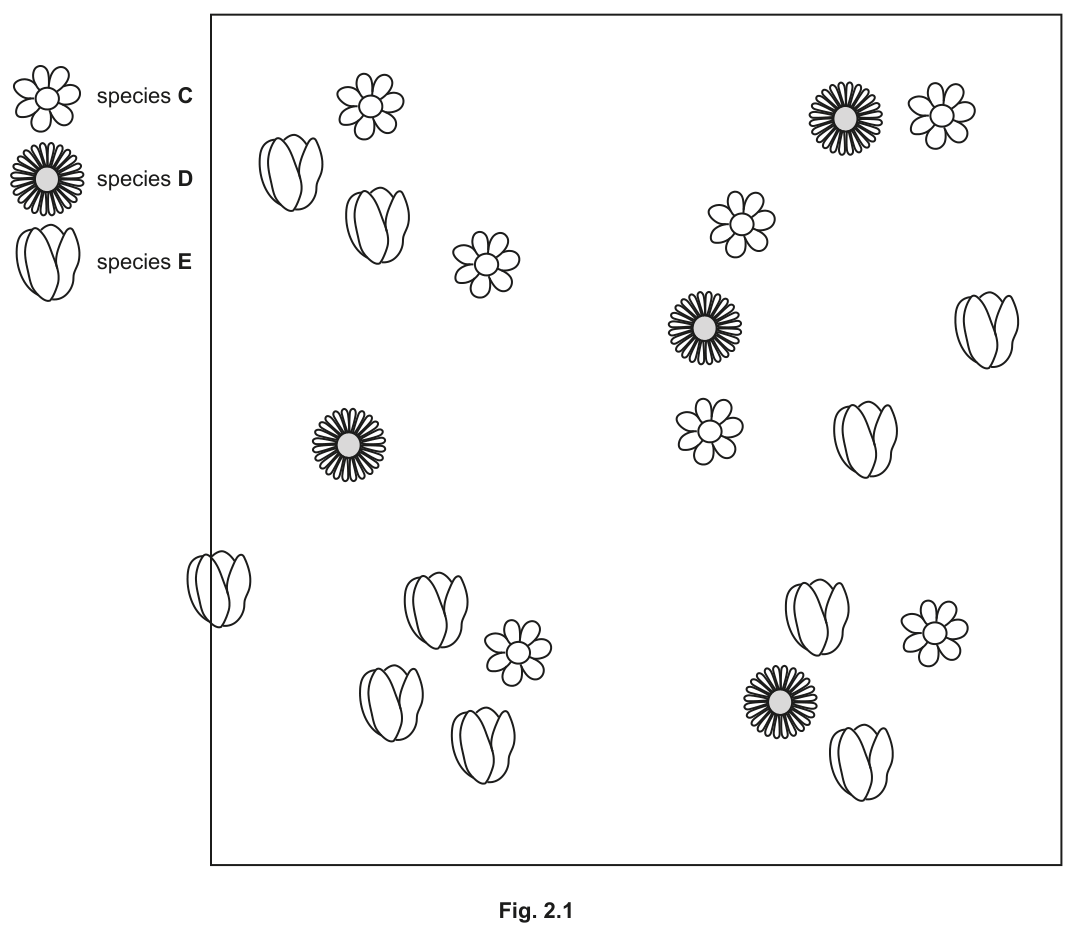
The sample contained three different plant species.
The student counted the number of plants of each of these species in this sample.
One plant was not fully within the square frame. Suggest and explain what you would do about this plant.
______
Answer
Include the plant if more than half of it is inside the square frame; or exclude it because it is not fully within the square and you cannot count half an individual.
Include if >50% inside the frame, or exclude because it is not fully inside (cannot count half an individual)
Walkthrough
When using a quadrat to sample organisms, individuals that fall on the boundary present a problem: you cannot count half a plant. The standard convention is to pick one rule and apply it consistently. You can either include the plant if more than half of its area (or more than half of its individuals, for clumped plants) lies inside the square frame, or exclude it entirely if it is not fully within the square. The mark scheme accepts either approach, provided the reason is stated.
Key Takeaways
Quadrat sampling requires a strict boundary rule to avoid double-counting or omitting edge individuals. Consistency is more important than which specific rule you choose.
Common Mistakes
- Stating "include it" or "exclude it" without giving the reason. The mark scheme requires both the action and the justification.
- Saying "count half of it" — the mark scheme explicitly rejects this because you cannot have half an individual.
Things to Be Careful About
Read the image carefully to identify which plant is on the boundary. In Fig. 2.1, it is the species E (tulip-like bud) on the left edge. Your answer to part (b) will depend on the rule you state here, so be consistent.
Count the number of plants of species E in Fig. 2.1, taking into account your answer to (a).
Record your answer in Table 2.1.
Table 2.1
| plant species | number of plants in the sample | estimated number of plants in the whole field |
|---|---|---|
| C | 7 | 5600 |
| D | 4 | 3200 |
| E |
Answer
| plant species | number of plants in the sample | estimated number of plants in the whole field |
|---|---|---|
| C | 7 | 5600 |
| D | 4 | 3200 |
| E | 9 (or 10) |
9 (if excluding the edge plant) or 10 (if including it)
Walkthrough
Look at Fig. 2.1 and identify the symbols for species E (the tulip-like flower bud). Count the ones clearly inside the square frame. There are 9 fully inside. One overlaps the left boundary. Applying the rule from part (a): if you exclude it, the count is 9; if you include it, the count is 10. Record whichever number matches your decision in part (a).
Key Takeaways
Always count systematically, perhaps moving row by row, to avoid missing or double-counting symbols. The count must be consistent with the boundary rule you chose.
Common Mistakes
- Misidentifying the symbol for species E and counting the wrong plant type.
- Forgetting to apply the rule from part (a) and just counting all 10 symbols.
Things to Be Careful About
The mark scheme explicitly states "9 / 10 based on answer to (a)(i)". Do not write a number that contradicts your answer to part (a).
The whole field measured .
Use the sample in Fig. 2.1 to estimate the number of plants of species E in the whole field and record this value in Table 2.1.
Show your working.
Working
Area of the whole field =
Area of one sample =
Number of samples =
Estimated number of species E = (or )
Answer
| plant species | number of plants in the sample | estimated number of plants in the whole field |
|---|---|---|
| C | 7 | 5600 |
| D | 4 | 3200 |
| E | 9 | 7200 |
(If 10 were counted in part (b), the estimate is 8000.)
7200 (or 8000 if 10 were counted in part b)
Walkthrough
To estimate the total population, you first need to know how many samples of that size would fit into the whole field. Divide the total area by the sample area: samples. Then multiply the number of plants found in one sample by the number of samples. If you counted 9, the estimate is . If you counted 10, it is .
Key Takeaways
Estimation from sampling relies on the assumption that the sample is representative. The calculation is: .
Common Mistakes
- Forgetting to square the units for area (writing without ).
- Dividing the sample area by the total area instead of the other way around, getting samples.
- Not showing working; the mark scheme awards one mark for the number of samples (800) and one mark for the final calculation.
Things to Be Careful About
Ensure your final answer matches the count you used in part (b). The mark scheme accepts both 7200 and 8000 with error carried forward (ecf) from part (b).
Explain why the student counted the numbers of plants in samples of the field instead of counting the number of plants in the whole field.
______
Answer
Counting every plant in the whole field would be too time-consuming and more likely to result in mistakes or an inaccurate tally.
Counting all plants would be too time-consuming and prone to error
Walkthrough
A full census (counting every single individual) is often impractical in the field. The field is large, and plants may be dense, making it difficult to keep an accurate tally without missing some or counting the same plant twice. Sampling is faster and, if done correctly, provides a reliable estimate without the enormous time investment.
Key Takeaways
Sampling is used when a full census is impossible or impractical due to time, cost, or the difficulty of keeping an accurate record.
Common Mistakes
- Saying "it is too hard" without elaborating. The mark scheme looks for "too time consuming" or "more likely to make a mistake".
- Saying "there are too many plants" — while true, the mark scheme rewards the practical consequences: time and accuracy.
Things to Be Careful About
Use the command word "Explain". This means you must give a reason, not just state a fact. "Because it is too big" is not enough; you must explain the consequence (time-consuming, error-prone).
Suggest two reasons why taking several samples would improve the accuracy of the estimate for the number of plants in the whole field.
- ______
- ______
Answer
- Plants are not evenly distributed across the field, so several samples capture this variation.
- Taking several samples provides a more representative estimate and increases the proportion of the field sampled.
- Plants are not evenly distributed; 2. Larger sample size is more representative
Walkthrough
A single sample might fall in a patch where one species is dominant, giving a biased estimate. By taking several samples at random locations, you account for the natural uneven distribution of plants. Additionally, a larger total number of samples means a larger proportion of the field is sampled, making the overall estimate more representative of the whole area and reducing the chance of missing rare species.
Key Takeaways
Random sampling and increasing sample size improve accuracy by reducing bias and accounting for natural variation in distribution.
Common Mistakes
- Saying "to get an average" — an average of what? You need to explain why averaging multiple samples is better (because distribution is uneven).
- Saying "to avoid human error" — the mark scheme explicitly ignores or rejects vague references to "human error" or "to avoid mistakes".
Things to Be Careful About
The question asks for two reasons. Make sure they are distinct. One should relate to the biological reality (uneven distribution), and the other to the statistical reality (larger sample = more representative / greater proportion sampled).
Use the data in Table 2.1 to construct a bar chart to show the estimated number of plants of species C, D and E in the whole field.

Answer
| plant species | estimated number of plants in the whole field |
|---|---|
| C | 5600 |
| D | 3200 |
| E | 7200 |
(Values for E may be 8000 if 10 were counted in part b.)
See working
Walkthrough
You are given a blank grid and must draw a bar chart. Follow these four steps to earn all 4 marks:
- Axes fully labelled: The x-axis should be labelled "plant species" (or "species C, D, E"). The y-axis must be labelled "estimated number of plants" (or "number of plants").
- Linear scale: Choose a scale for the y-axis that starts at 0 and goes up to at least 8000 (to accommodate the maximum value). Use at least half the grid height. For example, 1 large square = 1000 plants, or 1 small square = 200 plants. Ensure the scale is linear.
- Values plotted correctly: Draw bars reaching 5600 for C, 3200 for D, and 7200 (or 8000) for E.
- Bar construction: All bars must be drawn with ruled lines (a sharp pencil, no shading), have equal width, and must not touch each other (leave a small gap between bars).
Key Takeaways
Bar charts for categorical data (species) must have gaps between bars. The y-axis must start at zero. Bars must be drawn with ruled lines and equal width.
Common Mistakes
- Forgetting to label the y-axis with its unit or quantity (e.g., just writing "number" instead of "estimated number of plants").
- Using a non-linear scale or not starting the y-axis at 0.
- Drawing bars that touch each other (this is for histograms, not bar charts of categorical data).
- Shading or stippling the bars (biological drawings and charts must be clean ruled lines only).
- Extrapolating the scale beyond the grid or not using at least half the grid in both directions.
Things to Be Careful About
The mark scheme explicitly requires the bars to be ruled. Do not use a pencil to shade them. Ensure the bars are equal width and not touching. If your answer to part (c) was 8000, your bar for E must reach 8000; the mark scheme will accept this with error carried forward from part (c).
Plants can be provided with fertiliser to help them grow.
Some students were provided with germinated seeds of the same species in some shallow dishes and a 10% fertiliser solution. One dish is shown in Fig. 3.1.
The students had access to any other common laboratory apparatus.
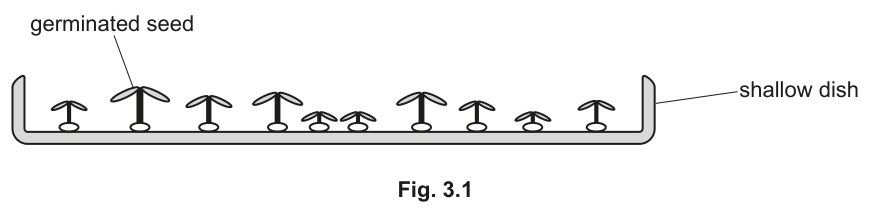
Plan an investigation the students could carry out to find the effect of different fertiliser concentrations on plant growth.
Answer
- Measure the height (or mass) of the seedlings at the start and at the end of the investigation.
- Use at least three fertiliser concentrations, all (e.g. 0%, 5%, 10%).
- Add the same volume of fertiliser solution to each dish.
- Leave the dishes for the same amount of time.
- Keep other factors constant (e.g. light intensity, temperature, volume of water).
- Repeat the experiment at each fertiliser concentration, calculate a mean, and compare the mean growth against the fertiliser concentration.
See working
Walkthrough
An investigation plan must clearly state what will be measured, what will be changed, what will be kept the same, and how the results will be analysed. Here is how each mark point is addressed:
- Measurement method and timing: The scheme requires a stated method (height or mass) and must specify that it is measured at both the start and the end. This allows the calculation of the actual growth that occurred during the experiment.
- Independent variable range: The students already have a 10% solution. They must use at least three concentrations, and all must be (e.g. 0%, 5%, 10%). Using concentrations above 10% is not supported by the provided materials.
- Volume control: The volume of liquid added to each dish must be identical so that the amount of fertiliser delivered is proportional only to its concentration.
- Time control: The duration of the experiment must be the same for all groups to ensure fair comparison.
- Other controlled variables: Factors that affect plant growth but are not being tested must be kept constant. Common examples include light intensity, temperature, levels, and the volume of water in the dish.
- Repeats and analysis: Biological specimens vary, so repeating the experiment at each concentration and calculating a mean reduces the effect of anomalies. Finally, the mean growth must be compared against the fertiliser concentration to draw a conclusion.
Key Takeaways
- A practical plan must explicitly state the dependent variable and how it is measured, including the timing of measurements.
- The independent variable must be given a meaningful range, and any constraints on that range (like a maximum available concentration) must be respected.
- Controlled variables must be named specifically (e.g. light intensity, not just 'environment').
- Repeats and means are essential for biological data to ensure reliability.
Common Mistakes
- Measuring only at the end: Students often forget to measure the initial size of the seedlings. Growth is a change in size, so a starting measurement is required.
- Using concentrations : The mark scheme explicitly requires concentrations . Using 15% or 20% would lose the mark.
- Vague controlled variables: Writing 'keep the environment the same' is not specific enough. Name the variables: light, temperature, water volume.
- Forgetting to calculate a mean: Simply repeating the experiment is not enough; the plan must state that a mean is calculated from the repeats.
Things to Be Careful About
- The mark scheme lists 7 creditable points for 6 marks. You only need to provide 6 clear points to get full marks, but providing all 7 ensures you cover the required logic.
- Always pair the measurement method with the timing ('at start and end'). 'Measure height' alone is insufficient.
- Ensure the independent variable is stated as a range of values ('at least three concentrations'), not just the variable name.
Answer
fertiliser concentration
fertiliser concentration
Walkthrough
The independent variable is the factor that the investigator deliberately changes on purpose to observe its effect. In this investigation, the students are testing different fertiliser concentrations to see how they affect growth. Therefore, the fertiliser concentration is the independent variable.
Key Takeaways
- The independent variable is what you change.
- The dependent variable is what you measure (plant growth/height/mass).
- Controlled variables are what you keep the same (light, temperature, volume).
Common Mistakes
- Confusing independent and dependent variables: Students often write 'plant growth' or 'height'. Growth is the result being measured, so it is the dependent variable.
- Writing 'fertiliser' instead of 'fertiliser concentration': The investigation is testing different concentrations of fertiliser, not just the presence or absence of it. Precision in wording matters.
Things to Be Careful About
- Use the exact wording from the question or mark scheme. 'fertiliser concentration' is the precise term required.