Biology 5090/31 — May/June 2024
Cambridge O-Level · Practical Test · worked solutions for every part, with the mark scheme
Topics Experimental Contexts · Observations and Measurements · Microscopy and Biological Drawing · Analysis, Conclusions and Evaluation · Planning Experiments and Investigations
You are going to investigate the structure and nutrient content of a flower. You are provided with a flower and samples of substances A and B from a flower.
Carefully remove some petals from the flower so that you leave two petals that are next to each other.
Place the flower with two petals on the white tile. Ensure that the petals are resting on the tile so that you can see the internal parts of the flower clearly. Examine the flower carefully with a hand lens.
Make a large drawing of the two petals and the internal parts of the flower in the space below.
Answer
A large drawing, at least 90 mm across, of the two petals and the internal parts of the flower: several stamens each with a filament and a clearly delimited anther, and a central style rising to a stigma. Drawn in clean, continuous lines with a sharp pencil, with no shading.
Large labelled drawing of two petals and the internal parts of the flower
Walkthrough
This is the classic 5090 biological drawing task. The examiner is not testing your artistic skill — the five marks are awarded for following drawing conventions and for showing the right structures.
- Line quality (1 mark). Every line must be clear, clean and continuous, drawn with a sharp pencil. There must be no shading, stippling or cross-hatching anywhere, and no ruled lines. If you make a mistake, do not scribble it out — a single clean line through the error is acceptable.
- Size (1 mark). The drawing must be at least 90 mm wide in either direction. That is roughly the width of your hand — draw big. A small drawing loses this mark even if everything else is perfect.
- Stamens (1 mark). Draw the male parts: each stamen has a stalk, the filament, topped by an anther. The anthers must be delimited — that is, each anther drawn as a distinct, clearly outlined structure at the tip of its filament, not a vague blob.
- Style and stigma (1 mark). The style must be drawn with a double line (two parallel lines, because it is a tube-like structure) and it must end in a stigma at the top. Cell walls, midribs, stalks and tubes are always drawn with a double line.
- Petals (1 mark). Exactly two petals, as instructed — the two you left next to each other. Draw only what was asked for and nothing else.
Key Takeaways
- Biological drawings are marked on conventions: sharp pencil, continuous lines, no shading, minimum size, correct proportions.
- Tubes and stalks (style, filament) are drawn with double lines.
- Draw only the structures the question names — extra structures can lose marks.
Common Mistakes
- Shading or stippling to show depth — this always loses the line-quality mark.
- Drawing too small; the 90 mm minimum is a specific credited point.
- Drawing the style as a single line instead of a double line.
- Drawing vague, undelimited anthers.
- Drawing more or fewer than two petals.
Things to Be Careful About
- Use a sharp HB pencil, never pen.
- Check the size before you start — measure 90 mm on the page so you know how much room the drawing needs.
- The mark scheme credits "filaments + delimited anthers" and "style with double line + stigma" as paired points, so both halves of each pair must appear.
On your drawing, draw a line and label it P to show where pollen must land when pollination takes place.
Answer
A label line drawn from outside the flower to the top of the stigma, labelled P.
Label line to the top of the stigma, labelled P
Walkthrough
Pollination is the transfer of pollen from an anther to a stigma. The pollen grain must land on the receptive surface at the top of the stigma, so the label line must end exactly there — not on the style, not on a petal, not on an anther. The mark scheme credits "label line to top of stigma".
Draw the label line with a ruler, touching the structure it names, starting outside the drawing, and write P clearly at the outer end.
Key Takeaways
- The stigma is the pollen-receiving surface of the carpel; pollination means pollen landing on the stigma.
- Label lines must touch the structure they label and start outside the drawing.
Common Mistakes
- Pointing P at the anther — that is where pollen is made, not where it lands.
- Pointing at the style or the ovary instead of the stigma.
- A label line that does not actually touch the stigma.
Things to Be Careful About
- The exact position matters: the top of the stigma. A line to the side or base of the stigma may not score.
You are going to test substances A and B for their nutrient content using Benedict's solution, biuret reagent and iodine solution.
Draw a table in which to record the results of your tests in the space below.
Answer
| Test / reagent | Colour / observation for A | Colour / observation for B |
|---|---|---|
| Benedict's solution | ||
| Biuret reagent | ||
| Iodine solution |
The table is drawn with ruled lines, all information written inside it, each header stated once only, and overarching headers naming the test and the colour observed.
Ruled table with columns for substances A and B, rows for Benedict's, biuret and iodine, and overarching headers for test and colour/observation
Walkthrough
"Draw a table in which to record your results" is marked on table CONSTRUCTION, not on the results themselves — those come in (b)(iii).
The four marks are:
- Ruled lines. Draw the table with a ruler; every row and column is ruled, and all information is written inside the table, not outside it.
- Substance headers. A and B each appear once only, as column headers — never repeated in every cell.
- Test headers. Benedict's, biuret and iodine each appear once only, as row headers.
- Overarching headers. The top row must name the two variables: the test / reagent / solution on one side and the colour / observation / results on the other.
Key Takeaways
- A well-constructed table has headers stated once, overarching headings naming each variable, and everything inside the ruled frame.
- Plan the table before doing the tests so observations can be recorded straight in.
Common Mistakes
- Repeating "A" and "B" in every cell instead of as column headers.
- Writing observations outside the table.
- Omitting the overarching header row naming the variables.
- Freehand, unruled tables.
Things to Be Careful About
- Leave the result cells empty at this stage — the observations are recorded in (b)(iii).
To carry out the tests, follow these instructions, making sure that you label the test-tubes so that you know which test is being done on which substance.
Raise your hand when you are ready to be supplied with hot water in your water-bath.
Measure and record the temperature of the water in the water-bath.
______
- Pour about depth of substance A into each of three clean test-tubes.
- Add about depth of Benedict's solution to one of these test-tubes and place it in your hot water-bath.
- Add about depth of biuret reagent to another one of these test-tubes and place it in the test-tube rack.
- Add a few drops of iodine solution to the third test-tube and place it in the test-tube rack.
- After five minutes observe these test-tubes and observe the colour of the solution at the end of each test.
- Repeat the above procedure with clean test-tubes and substance B. Raise your hand if you require more hot water. You do not need to record the temperature of the water again.
Answer
Temperature of the water in the water-bath = e.g. (any value between and inclusive), recorded with the unit .
Any temperature reading between 30 and 90 °C inclusive, recorded with the unit °C
Walkthrough
You measure the temperature of the hot water in the water-bath with a thermometer and record it. The mark scheme accepts any value from to inclusive — hot tap water and just-boiled water both fall in this range. The mark has two halves joined by "+": the temperature and the unit . A bare number with no unit loses the mark.
The blank line in the instructions is where you write this reading before starting the food tests.
Key Takeaways
- Every measured quantity needs a unit; a number alone is incomplete.
- Benedict's test needs heating, so the water-bath temperature is a relevant recorded variable.
Common Mistakes
- Writing the temperature without the unit .
- Recording a value outside the accepted range (e.g. reading in or misreading the thermometer scale).
Things to Be Careful About
- Read the thermometer at eye level with the bulb fully in the water, and record to the nearest degree.
Answer
| Test / reagent | Colour for A | Colour for B |
|---|---|---|
| Benedict's solution | orange (green / yellow / orange / red all accepted) | blue |
| Biuret reagent | blue | purple |
| Iodine solution | brown | brown |
Benedict's: A orange, B blue; biuret: A blue, B purple; iodine: A brown, B brown
Walkthrough
Each reagent earns one mark for the correct FINAL colour observed:
- Benedict's solution tests for reducing sugars. On heating in the water-bath it turns from blue through green, yellow and orange to brick-red, depending on how much sugar is present. Substance A gives a positive result (any of green/yellow/orange/red scores); substance B stays blue — no reducing sugar.
- Biuret reagent tests for protein. A positive result turns from blue to purple (lilac/violet/mauve). Substance B is positive; substance A stays blue.
- Iodine solution tests for starch. A positive result turns from brown to blue-black. Both A and B stay brown — no starch in either.
Record the final colour after five minutes, in the table you drew in (b)(i).
Key Takeaways
- Benedict's: reducing sugars — blue to green/yellow/orange/brick-red on heating.
- Biuret: protein — blue to purple.
- Iodine: starch — brown to blue-black; staying brown means starch is absent.
Common Mistakes
- Recording the starting colour instead of the final colour after five minutes.
- Saying "blue-black" for iodine when the observation was brown (no starch present).
- Confusing biuret (protein, purple) with Benedict's (reducing sugar, heated).
Things to Be Careful About
- The mark is for the colour actually observed at the END of each test — wait the full five minutes before recording.
Answer
Substance A contains a reducing sugar (e.g. glucose).
Substance B contains protein.
A: reducing sugar; B: protein
Walkthrough
This is the conclusion step that follows from your observations in (b)(iii):
- Substance A gave a positive Benedict's test (colour change on heating), so it contains a reducing sugar — glucose or maltose are accepted examples.
- Substance B gave a positive biuret test (blue to purple), so it contains protein.
- Neither substance turned iodine blue-black, so neither contains starch — and no mark is awarded for saying so, because the question asks what IS present.
Key Takeaways
- Each food test identifies one nutrient: Benedict's → reducing sugar, biuret → protein, iodine → starch.
- A negative test means the nutrient is absent; only positive results are reported as "present".
Common Mistakes
- Writing "sugar" instead of "reducing sugar" — the precise term is required.
- Naming starch because iodine was used, even though the test was negative.
- Confusing the substances: A is the sugar, B is the protein.
Things to Be Careful About
- Use the exact term "reducing sugar"; "glucose" or "maltose" also score, but "sugar" alone is too vague.
Fig. 1.1 is a photomicrograph of a pollen grain.
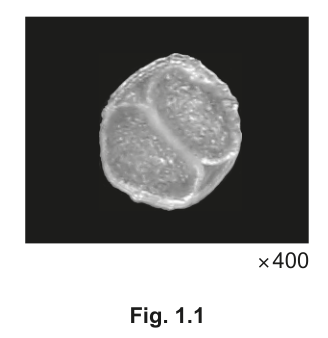
Measure and record the diameter of the pollen grain at its widest point.
diameter = ______
Answer
Measure across the pollen grain in Fig. 1.1 at its widest point with a ruler.
diameter = e.g. (any value in the accepted range )
Any measurement between 24 and 29 mm
Walkthrough
Place a ruler across the photomicrograph of the pollen grain in Fig. 1.1, passing through its widest point, and read the diameter in millimetres. The mark scheme accepts , which accounts for the grain not being perfectly circular and for small differences in printing size. Any value inside that range scores.
This measured value is the input for the magnification calculation in (c)(ii), so measure carefully.
Key Takeaways
- Measure at the widest point, straight across the centre of a roughly circular object.
- Record the measurement in mm with the unit.
Common Mistakes
- Measuring across a narrow part instead of the widest point.
- Recording in cm instead of mm.
- Measuring the dark background frame rather than the grain itself.
Things to Be Careful About
- The answer must be in mm as the answer line states; the unit is already printed, so just give the number.
Calculate the diameter of the actual pollen grain and record your answer to 2 decimal places.
diameter of the actual pollen grain = ______
Working
Using the measured diameter from (c)(i), e.g. :
Answer
diameter of the actual pollen grain = (to 2 decimal places, using the measured value; e.g. ), with the unit mm (or ).
Measured diameter from (c)(i) divided by 400, given to 2 decimal places with the unit (e.g. 0.07 mm)
Walkthrough
The photomicrograph is magnified , so the grain in the picture is 400 times larger than the real pollen grain. To find the real size, divide by the magnification:
The three marks are:
- The method — your measured diameter from (c)(i) divided by 400.
- The answer to 2 decimal places — the question demands this precision, so round only at the end. For example, , which rounds to ; a measurement of gives exactly.
- The unit — mm, or convert to by multiplying by 1000 (e.g. ).
Key Takeaways
- actual size = image size ÷ magnification; magnification = image size ÷ actual size.
- .
- Round only once, at the end, to the precision asked for.
Common Mistakes
- Multiplying by 400 instead of dividing — that gives the size of an impossible giant grain.
- Forgetting the unit, which is a separate mark.
- Giving more or fewer than 2 decimal places when the question states the precision.
- Rounding the (c)(i) measurement before dividing.
Things to Be Careful About
- The mark scheme awards ecf: if your (c)(i) measurement was inside the accepted range, dividing it correctly by 400 still scores, even if the final value differs from a classmate's.
Fig. 1.2 is a photomicrograph of a pollen grain from a different species of plant.
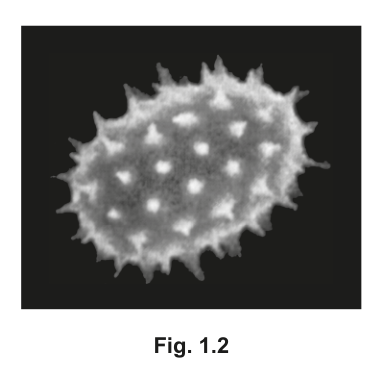
Describe two visible differences in the structure of the pollen grains in Fig. 1.1 and Fig. 1.2.
| Fig. 1.1 pollen grain | Fig. 1.2 pollen grain |
|---|---|
| 1 | |
| 2 |
Answer
| Fig. 1.1 pollen grain | Fig. 1.2 pollen grain | |
|---|---|---|
| 1 | round / circular | oval |
| 2 | smooth surface, no spikes | spiky / rough surface, with many pointed projections |
Fig. 1.1 is round with a smooth surface; Fig. 1.2 is oval with a spiky surface
Walkthrough
Compare the two photomicrographs feature by feature. The scheme lists three possible differences and asks for two ("max 2"):
- Shape. The Fig. 1.1 grain is round/circular; the Fig. 1.2 grain is oval (longer than it is wide).
- Surface. Fig. 1.1 has a smooth surface with no spikes; Fig. 1.2 is covered in pointed projections (spines) all round its edge, giving a rough surface.
- Internal division. Fig. 1.1 shows a furrow dividing the grain internally; Fig. 1.2 shows no such division.
Any two of these score. Each comparison must name BOTH grains — a statement about only one grain does not make a comparison.
Pollen grain surface texture is a real identification feature: smooth (psilate) grains versus spiny (spiny/echinate) grains belong to different species, and wind-pollinated plants tend to have smooth, light grains while insect-pollinated plants often have spiky grains that cling to insect bodies.
Key Takeaways
- A comparison names both sides of each difference.
- Visible features of pollen grains include shape, surface texture (smooth vs spiky) and internal divisions.
Common Mistakes
- Describing only one grain ("Fig. 1.2 has spikes") without saying Fig. 1.1 has none.
- Writing about size — the two photomicrographs may be printed at different magnifications, so apparent size is not a valid comparison.
- Giving colour differences — the photomicrographs are greyscale.
Things to Be Careful About
- Give exactly two differences; a third will not earn extra marks (max 2).
A student investigated the number of plants on a school field.
This was done by examining small samples of the field using a square frame measuring .
Fig. 2.1 shows the plants in one of these samples.
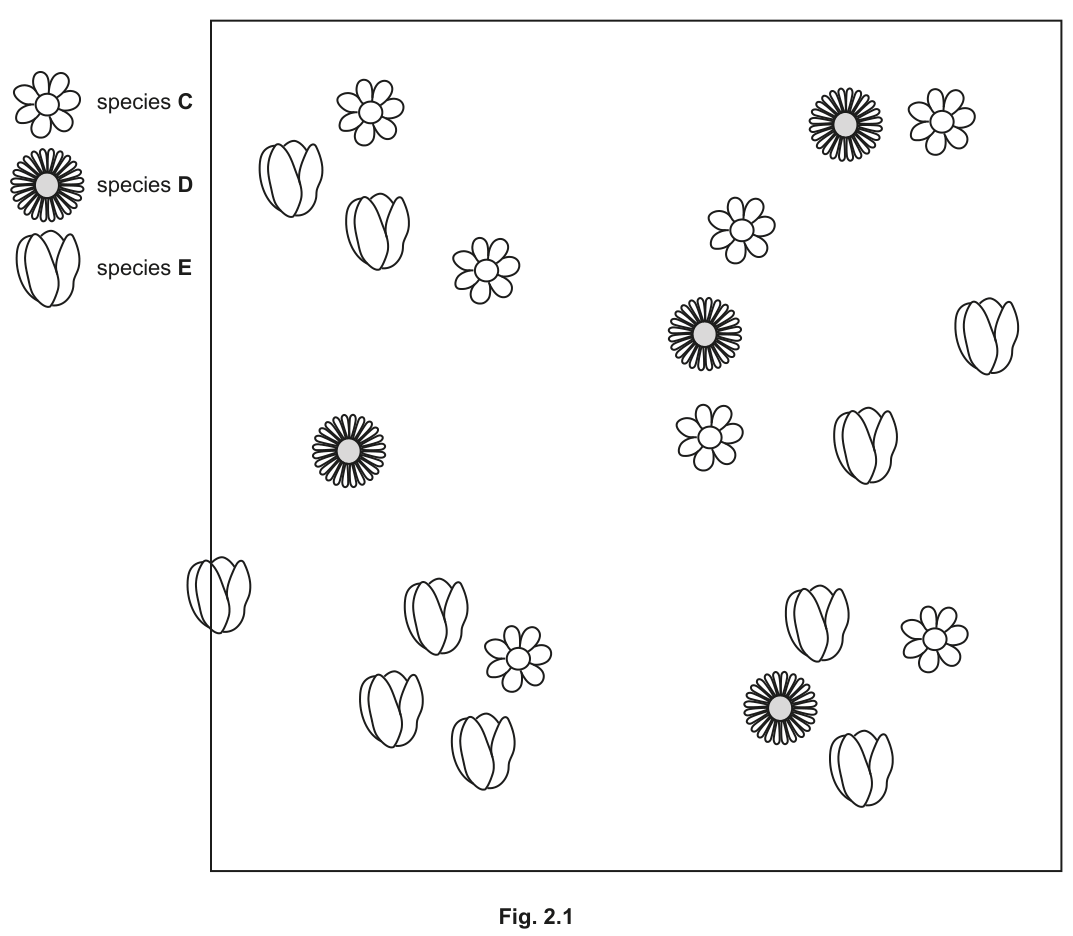
The sample contained three different plant species.
The student counted the number of plants of each of these species in this sample.
One plant was not fully within the square frame. Suggest and explain what you would do about this plant.
______
Answer
Include it, because more than half of the plant lies within the square frame / you cannot count half an individual.
(Alternatively: exclude it, because it is not fully within the square frame.)
Include it + reason – more than half in the square / cannot have half an individual (or exclude it + reason – not fully in the square).
Walkthrough
When using a quadrat, plants that straddle the frame edge are a classic problem: do they belong to this sample or not? The examiner accepts either decision, but only with a valid reason attached — the mark is awarded for the decision plus the reason as one combined point.
- Include it is justified because more than half of the plant's area lies inside the square, or because you cannot score half a plant — every individual must be counted whole or not at all.
- Exclude it is justified because the plant is not fully within the square, or again because you cannot have half an individual.
The important principle is that whichever rule you choose, you apply it consistently to every sample so that all samples are counted the same way.
Key Takeaways
- Quadrat sampling needs a fixed, stated rule for boundary organisms.
- The reason matters as much as the decision — 'include' and 'exclude' both score when paired with their justification.
- Consistency across samples keeps the estimate unbiased.
Common Mistakes
- Giving a bare decision ('count it') with no reason — the mark requires decision + reason joined together.
- Saying 'count it because it looks like it's mostly inside' without stating the 'more than half' criterion or the 'cannot have half an individual' idea.
- Inventing a third option such as 'estimate what fraction is inside' — the scheme offers only include or exclude.
Things to Be Careful About
- The '+' in the mark scheme means both halves are needed for the single mark.
- Either route scores equally; pick one and state it clearly rather than hedging between both.
Count the number of plants of species E in Fig. 2.1, taking into account your answer to (a).
Record your answer in Table 2.1.
Table 2.1
| plant species | number of plants in the sample | estimated number of plants in the whole field |
|---|---|---|
| C | 7 | 5600 |
| D | 4 | 3200 |
| E |
Answer
Number of plants of species E = 9
| plant species | number of plants in the sample | estimated number of plants in the whole field |
|---|---|---|
| C | 7 | 5600 |
| D | 4 | 3200 |
| E | 9 |
(The boundary plant of species E is excluded, following the answer to (a); a candidate who included it records 10.)
9 (or 10 if the boundary plant was included in (a))
Walkthrough
This part simply applies your (a) decision to the figure. Counting the tulip-shaped flowers (species E) fully inside the square gives 9; the tenth tulip sits across the left-hand boundary line, so whether it counts depends on the rule you stated in (a).
The mark scheme credits 9 or 10, carried forward from your own (a) answer — there is no single 'correct' number, only a self-consistent one. The value goes into Table 2.1 in the species E row.
Key Takeaways
- Counts from quadrat diagrams must follow the boundary rule stated earlier.
- Examiners award error-carried-forward credit: a defensible 10 here is worth exactly as much as a defensible 9.
Common Mistakes
- Counting all tulips including the boundary one after having said 'exclude' in (a) — inconsistency loses the mark.
- Misidentifying species E: it is the tulip-shaped flower in the key, not the round-petalled daisy (C) or the many-petalled flower (D).
Things to Be Careful About
- Check the key before counting — the three species look similar at a glance.
- Record the number in the correct row of the table.
The whole field measured .
Use the sample in Fig. 2.1 to estimate the number of plants of species E in the whole field and record this value in Table 2.1.
Show your working.
Working
Area of field
Area of one sample
Answer
7200 plants
| plant species | number of plants in the sample | estimated number of plants in the whole field |
|---|---|---|
| C | 7 | 5600 |
| D | 4 | 3200 |
| E | 9 | 7200 |
7200
Walkthrough
To scale a quadrat count up to a whole-field estimate, you need to know how many quadrat-sized samples would fit in the field.
- Field area: .
- Sample area: .
- Number of samples: . This is the point the scheme rewards first ('ref. to 800').
- If each sample holds 9 plants of species E, then 800 samples hold plants.
If you included the boundary plant in (b), the same method gives , which also scores.
Notice the printed table confirms the logic: species C has 7 per sample and an estimate of 5600, and — the same multiplier of 800 throughout.
Key Takeaways
- Population estimate = mean count per quadrat × (total area ÷ quadrat area).
- Always show the intermediate step (the number of samples) — it carries a mark of its own.
- You can check your multiplier against rows already completed in the table.
Common Mistakes
- Multiplying by 200 instead of 800 (forgetting to divide by the quadrat area).
- Using instead of for the sample area.
- Omitting the working — the question explicitly says 'Show your working', and the 800 step is separately credited.
Things to Be Careful About
- Error carried forward applies: a wrong count in (b) used correctly here still earns the second mark.
- Give the final value with no unit needed (it is a number of plants), and record it in the empty cell of Table 2.1.
Explain why the student counted the numbers of plants in samples of the field instead of counting the number of plants in the whole field.
______
Answer
Counting all the plants in the whole field would be too time-consuming / too difficult to keep an accurate tally, so sampling is quicker and less likely to lead to mistakes.
Too time consuming to count them all / too difficult to keep an accurate tally / more likely to make a mistake.
Walkthrough
Sampling exists because a total census is impractical. Counting every plant over would take a very long time, and during such a long count it becomes hard to keep track — you lose your place, double-count, or miss plants. A small, well-chosen sample gives a good estimate far faster. Any one of these phrasings scores the single mark: too time consuming, too difficult to keep an accurate tally, or more likely to make a mistake.
Key Takeaways
- Sampling trades a small loss of precision for a large gain in speed and practicality.
- The justification always centres on time/effort/accuracy of a full count.
Common Mistakes
- Writing vague answers like 'it is easier' without saying easier in what way — the scheme wants the time or accuracy reason spelled out.
- Arguing that sampling is more accurate than a full count — it is not; it is an estimate.
Things to Be Careful About
- One mark only: give one clear reason, not a paragraph.
Suggest two reasons why taking several samples would improve the accuracy of the estimate for the number of plants in the whole field.
- ______
- ______
Answer
- Plants are not evenly distributed across the field, so several samples even out the variation between samples.
- Several samples cover a larger proportion of the field, making the sample more representative of the whole field / more likely to include every type and number of plant species.
Plants not evenly distributed; larger proportion of field sampled / more representative sample.
Walkthrough
One quadrat might land in a patch where a species happens to be dense or absent purely by chance. Taking many samples spread over the field averages out these local differences, because plants are not evenly distributed. Also, more samples means a larger fraction of the field is actually looked at, so the estimate is based on more evidence and is more representative — you are more likely to encounter every species and a fair number of each. Both ideas earn a mark each.
Key Takeaways
- Repeated sampling combats uneven (clumped) distribution.
- More samples = larger sampled proportion = more representative estimate.
Common Mistakes
- Giving the same idea twice in different words (e.g. 'more accurate' and 'better estimate') — the two marks need two distinct reasons.
- Saying 'to remove anomalies' — the issue here is natural patchiness, not measurement error.
Things to Be Careful About
- Exactly two numbered answers are asked for; give two distinct points.
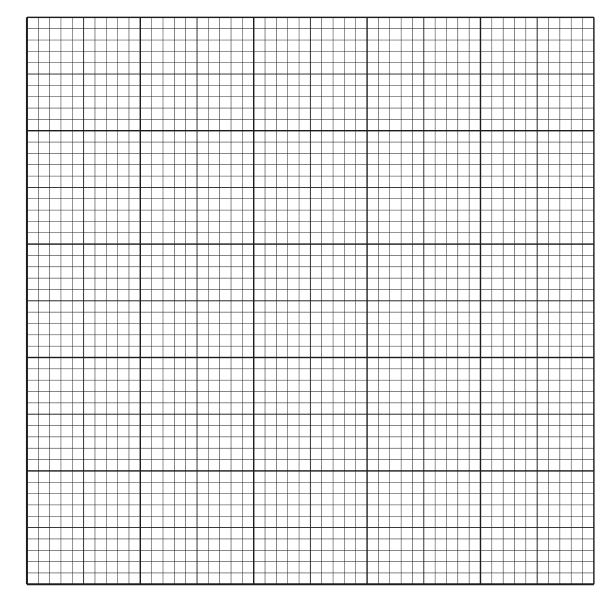
Use the data in Table 2.1 to construct a bar chart to show the estimated number of plants of species C, D and E in the whole field.
Answer
Bar chart on the printed grid: x-axis labelled 'plant species' (C, D, E), y-axis labelled 'estimated number of plants in the whole field' with a linear scale from 0, bars of equal width not touching, heights 5600, 3200 and 7200.
Walkthrough
A bar chart is the right display because the independent variable (species) is discontinuous — categories, not numbers. Four things are marked:
- Axes fully labelled: x-axis 'plant species' (with C, D, E marked), y-axis 'estimated number of plants in the whole field'. Labels without units here, since the quantity is a count.
- Linear scale with a value at the origin, using at least half the grid in both directions. A scale of 1 small square = 100 plants works well: 7200 spans most of the height.
- Values plotted correctly: bar tops at 5600 (C), 3200 (D) and 7200 (E).
- Bars ruled, equal width, not touching — separated bars signal discrete categories.
Key Takeaways
- Bar charts for categorical data; line graphs only for continuous data.
- Every axis label must name the variable; scales start at zero and fill at least half the grid.
- Bar chart conventions: equal width, gaps between bars, drawn with ruled lines.
Common Mistakes
- Drawing a histogram-style chart with touching bars — the scheme explicitly rejects this.
- Forgetting the y-axis label or starting the scale above zero.
- Freehand bars or shading the bars — draw clean ruled outlines.
- Plotting the sample counts (7, 4, 9) instead of the whole-field estimates (5600, 3200, 7200) — read the data from Table 2.1's final column.
Things to Be Careful About
- Use the estimated whole-field values, not the raw sample counts.
- Keep the scale strictly linear and put 0 at the origin.
Plants can be provided with fertiliser to help them grow.
Some students were provided with germinated seeds of the same species in some shallow dishes and a 10% fertiliser solution. One dish is shown in Fig. 3.1.
The students had access to any other common laboratory apparatus.
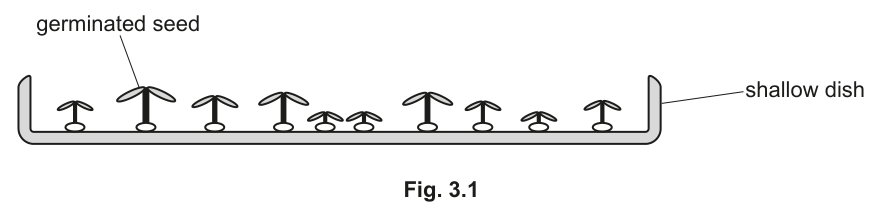
Plan an investigation the students could carry out to find the effect of different fertiliser concentrations on plant growth.
Answer
- Measure the growth of the seedlings by measuring their height (or mass) at the start and again at the end of the experiment.
- Prepare at least three different fertiliser concentrations (e.g. 2%, 4%, 6%, 8%), all less than or equal to 10%.
- Add the same volume of each fertiliser solution to the respective dishes.
- Leave the dishes for the same amount of time.
- Ensure all dishes are kept under the same conditions (e.g. same light intensity, temperature, levels, and volume of water).
- Repeat the experiment with more dishes at each fertiliser concentration and calculate a mean for each concentration.
- Compare the results (mean height or mass) against the fertiliser concentration.
See working
Walkthrough
The question asks for a plan to investigate the effect of different fertiliser concentrations on plant growth. A complete plan must cover what will be measured, the range of the independent variable, the controlled variables, repeats, and how the results will be analysed.
- Measurement: Decide how growth will be measured (e.g. height or mass) and state that it must be measured at the start and at the end to calculate the change.
- Independent variable range: Use at least three different concentrations of fertiliser, ensuring none exceed the 10% solution provided.
- Volume of treatment: Add the same volume of fertiliser solution to each dish to ensure a fair test.
- Time: Leave the dishes for the same duration after applying the fertiliser.
- Controlled variables: Keep other factors that could affect growth constant, such as light intensity, temperature, levels, and the volume of water.
- Repeats and mean: Use multiple dishes for each concentration and calculate a mean to make the results more reliable and identify anomalies.
- Analysis: Plot or compare the mean growth against the fertiliser concentration to see the effect.
Key Takeaways
A 6-mark planning question requires a structured method. Always include: what you will measure and when, the range of the independent variable, at least three controlled variables, repeats with a mean, and how you will analyse the data.
Common Mistakes
- Forgetting to measure growth at the start as well as the end (you need a baseline to calculate growth).
- Suggesting concentrations greater than 10% (the mark scheme specifies all ).
- Giving vague controlled variables like "same conditions" instead of naming specific factors like light intensity or temperature.
- Forgetting to calculate a mean from repeats.
Things to Be Careful About
- The question provides a 10% fertiliser solution, so your planned concentrations must be .
- Ensure you state how you will measure growth (e.g. "measure height with a ruler") rather than just saying "measure growth".
- Do not just list controlled variables; explain that they must be kept the same.
- The final mark requires stating how you will use the data (e.g. "compare mean height to fertiliser concentration").
Answer
fertiliser concentration
fertiliser concentration
Walkthrough
The independent variable is the factor that the investigator deliberately changes to see its effect on the dependent variable. In this investigation, the students are testing "different fertiliser concentrations", so the independent variable is the fertiliser concentration.
Key Takeaways
The independent variable is the one variable you change on purpose. The dependent variable is what you measure (plant growth). Controlled variables are everything else you keep the same.
Common Mistakes
- Confusing the independent variable with the dependent variable (plant growth).
- Writing "fertiliser" instead of "fertiliser concentration" (the concentration is what is varying, not the presence or absence of fertiliser).
Things to Be Careful About
- Read the question carefully: "effect of different fertiliser concentrations". The concentration is the variable being changed.
- Always include the unit or specify the exact factor (e.g. "concentration", not just "fertiliser").