Biology 5090/21 — May/June 2024
Cambridge O-Level · Theory · worked solutions for every part, with the mark scheme
Topics Human Nutrition · Movement Into and Out of Cells · Coordination and Control · Biotechnology and Genetic Modification · Cell Structure and Organisation · Human Gas Exchange · +9 more
The lungs are part of the human gas exchange system.
Breathing moves air into and out of the lungs.
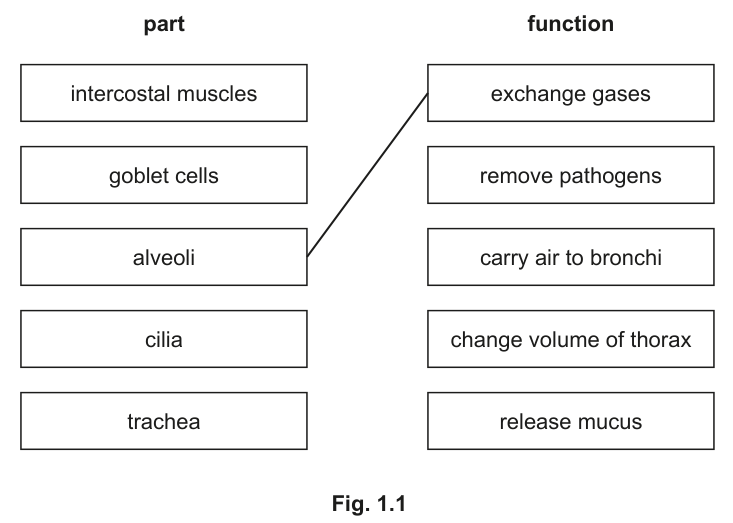
Fig. 1.1 shows parts of the human gas exchange system and their functions.
On Fig. 1.1, draw a line from each part to its function.
One has already been done for you.
Answer
| part | function |
|---|---|
| alveoli | exchange gases (given) |
| intercostal muscles | change volume of thorax |
| goblet cells | release mucus |
| cilia | remove pathogens |
| trachea | carry air to bronchi |
See working
Walkthrough
This is a matching task: each structure on the left pairs with exactly one function on the right, and one pair (alveoli → exchange gases) is printed as an example. Work through the remaining four:
- Intercostal muscles lie between the ribs. When they contract they move the ribcage up and out, which changes the volume of the thorax — so they pair with 'change volume of thorax'.
- Goblet cells line the airways and secrete mucus, which traps dust and pathogens — 'release mucus'.
- Cilia are tiny hair-like projections on the cells lining the trachea and bronchi. They beat in a coordinated wave that sweeps the mucus (with trapped pathogens) upwards and away from the lungs — 'remove pathogens'.
- Trachea is the windpipe; it divides into two bronchi, one to each lung — 'carry air to bronchi'.
The mark scheme scores this arithmetically: four correct = 4 marks, three = 3, two = 2, one = 1.
Key Takeaways
- Each part of the gas exchange system has a distinct job: ventilation (intercostal muscles), defence (goblet cells and cilia working together), conduction (trachea) and exchange (alveoli).
- Goblet cells and cilia form a combined defence mechanism — mucus traps pathogens, cilia remove them.
Common Mistakes
- Pairing cilia with 'release mucus' — it is the goblet cells that release mucus; the cilia move it. This is the classic swap on this question.
- Pairing trachea with 'change volume of thorax' — the trachea is a passive airway; only muscles change volume.
- Drawing a line from more than one box on the left to the same function — each pairing must be one-to-one.
Things to Be Careful About
- The example line (alveoli → exchange gases) is already drawn; do not redraw it or count it as one of your four.
- Use a ruler for the lines if asked, and make sure each line clearly touches both boxes.
State two features of alveoli that make them suitable for gas exchange.
- ______
- ______
Answer
- Large surface area
- Thin (flattened) walls / cells, giving a short diffusion distance
Large surface area; thin/flattened cells or walls
Walkthrough
The question asks for features of the alveoli that make them suitable for gas exchange — i.e. adaptations that make diffusion of oxygen and carbon dioxide fast. The mark scheme lists several acceptable points and caps at 2:
- Large surface area — millions of alveoli give a huge total area over which gases can diffuse.
- Thin / flattened cells or walls — the alveolar wall is one cell thick, so the diffusion distance between air and blood is very short.
- A layer of moisture lining the alveoli, so gases dissolve before diffusing across.
- Close to capillaries — a rich blood supply maintains a steep concentration gradient.
Any two of these score. The first two are the most reliably credited.
Key Takeaways
- Gas exchange surfaces share the same design rules as all exchange surfaces: large surface area, short diffusion distance, a concentration gradient maintained by blood flow (and here, ventilation).
- These same features reappear when you study the villus in absorption and the leaf in photosynthesis.
Common Mistakes
- Writing vague answers like 'good blood supply' without saying close to capillaries or linking it to maintaining a gradient.
- Describing what happens during breathing rather than naming structural features of the alveoli themselves.
- Giving more than two points when only two are asked for — extra points gain nothing but cost time.
Things to Be Careful About
- The mark scheme's second point is written as 'thin/flattened + cells/walls' — both halves must be present: thin AND referring to the cells or walls.
- 'Layer of water AW' means any wording conveying a moist surface is accepted.
Gas exchange changes the percentages of some gases in the lungs.
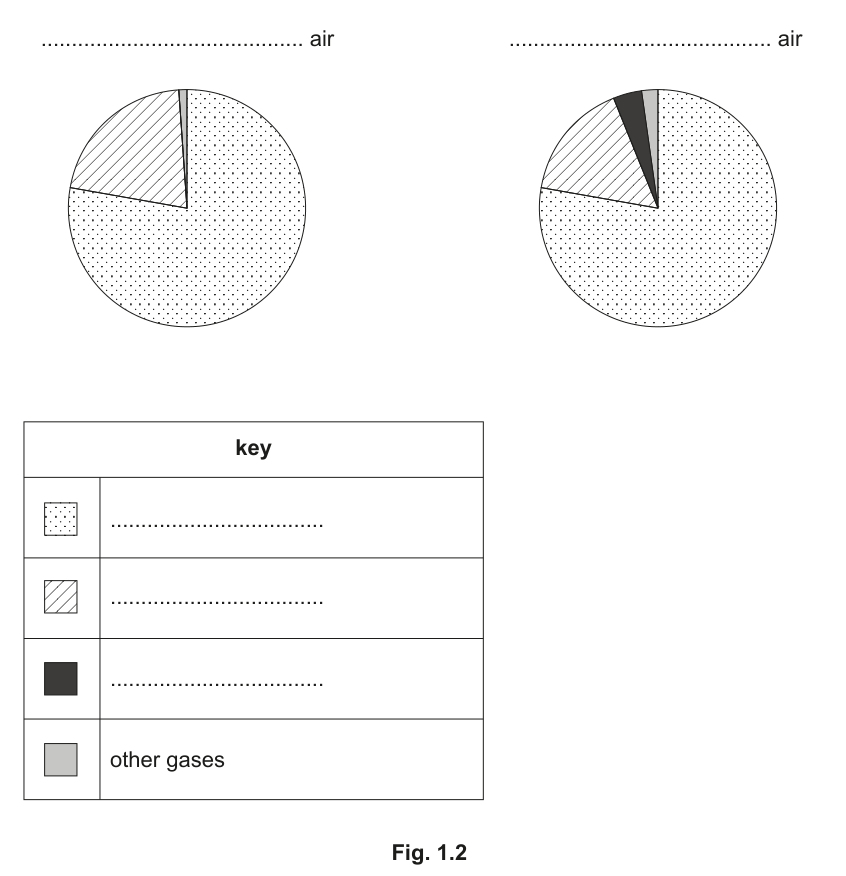
The pie charts in Fig. 1.2 show how the percentages of gases in the lungs change during one breath.
Complete the pie chart titles and the key which shows which gases are represented by different types of shading.
Answer
Left pie chart title: inspired air
Right pie chart title: expired air
Key:
| shading | gas |
|---|---|
| dotted | nitrogen |
| striped | oxygen |
| solid black | carbon dioxide |
| solid grey | other gases (given) |
Inspired air (left), expired air (right); dotted = nitrogen, striped = oxygen, black = carbon dioxide
Walkthrough
Two things must be completed: the titles above the pie charts and the key identifying each shading.
Titles. The left chart has a large striped sector (about 21%) and no visible carbon dioxide sector — that matches inspired air (~21% oxygen, ~0.04% carbon dioxide). The right chart has a slightly smaller striped sector (expired air holds ~16% oxygen because some has been absorbed into the blood) plus a clear black sector (~4% carbon dioxide added by respiration). So left = inspired/inhaled, right = expired/exhaled — and the order matters for the first mark.
Key. Nitrogen is not used by the body, so it stays at about 79% in both charts — it is the large dotted sector dominating both pies. Oxygen is the striped sector, smaller in expired air. Carbon dioxide appears only noticeably in expired air, so it is the small black sector seen only on the right chart.
Key Takeaways
- Inspired air: ~21% oxygen, ~0.04% carbon dioxide, ~79% nitrogen. Expired air: ~16% oxygen, ~4% carbon dioxide, ~79% nitrogen.
- Nitrogen percentage does not change during breathing because the body neither uses nor produces it.
- The changes come from respiration in body cells: oxygen removed, carbon dioxide added.
Common Mistakes
- Swapping the titles — putting 'expired' on the left. Check the oxygen sector size: the larger one is inspired.
- Labelling the dotted sector as oxygen because it is the biggest — the biggest sector is nitrogen, which is unchanged by breathing.
- Putting carbon dioxide in the key as the grey shading — grey is already labelled 'other gases'.
Things to Be Careful About
- The mark scheme requires 'inspired/inhaled + expired/exhaled in correct order' — both titles must be right and in the right places for that mark.
- Spelling of the gas names should be exact: nitrogen, oxygen, carbon dioxide.
Brown bread, made from the flour of whole wheat grains, contains both starch and fibre.
A man eats a piece of brown bread.
In his digestive system, the starch in the bread is chemically digested to maltose and then to glucose.
Describe where and how this digestion takes place as the bread travels through his digestive system.
Answer
- Starch is broken down into maltose by the enzyme amylase.
- This takes place in the mouth (by salivary amylase) and in the small intestine (by pancreatic amylase in the duodenum).
- Maltose is then broken down into glucose by the enzyme maltase.
- This takes place in the small intestine (ileum).
Amylase breaks down starch to maltose in the mouth and small intestine; maltase breaks down maltose to glucose in the small intestine.
Walkthrough
Chemical digestion of carbohydrates occurs in two main sequential steps in the human digestive system:
- Digestion of starch to maltose:
- Starch is a large, insoluble polysaccharide.
- It is broken down into maltose (a disaccharide) by the enzyme amylase.
- This process begins in the mouth, where salivary glands secrete salivary amylase. It continues in the small intestine (duodenum), where pancreatic amylase is secreted.
- Digestion of maltose to glucose:
- Maltose is digested into glucose (a monosaccharide) by the enzyme maltase.
- This takes place in the small intestine (specifically on the epithelial lining of the ileum).
To achieve all 4 marks, both the enzyme-product relationship and the specific location must be paired correctly for each step.
Key Takeaways
- Starch Maltose (occurs in mouth and small intestine/duodenum).
- Maltose Glucose (occurs in small intestine/ileum).
Common Mistakes
- Confusing amylase with maltase or reversing their order of action.
- Stating that starch is directly converted to glucose in the mouth.
- Forgetting to mention the specific organs/locations where the enzymes act.
Things to Be Careful About
- Ensure both the enzyme and the region of digestion are clearly stated for both stages of starch breakdown.
Answer
- Fibre is not digested or broken down (because humans lack the enzyme cellulase).
- It is egested from the body as faeces through the anus.
Fibre is not digested and is egested as faeces through the anus.
Walkthrough
Dietary fibre consists mainly of cellulose from plant cell walls.
- Humans do not produce the enzyme cellulase, so fibre cannot be chemically digested or absorbed in the alimentary canal.
- Fibre provides bulk to the food, which stimulates peristalsis.
- The undigested fibre travels through the large intestine (colon and rectum) and is finally egested as faeces via the anus.
Key Takeaways
- Fibre cannot be digested in the human digestive system.
- Undigested material is passed out of the body by egestion as faeces.
Common Mistakes
- Confusing egestion (removal of undigested food through the anus) with excretion (removal of metabolic waste products from the body).
Things to Be Careful About
- Use the correct term "egested" or state clearly that it forms faeces and leaves through the anus.
Glucose passes from the digestive system into the blood by diffusion and active transport.
Give two ways in which active transport is different from diffusion.
- ______
- ______
Answer
- Active transport requires energy (from respiration / ATP), whereas diffusion is passive and does not require energy.
- Active transport moves substances against (up) a concentration gradient, whereas diffusion moves substances down a concentration gradient.
- Active transport requires energy / ATP; 2. Active transport moves molecules against a concentration gradient.
Walkthrough
Diffusion and active transport are two distinct mechanisms of cellular transport:
- Diffusion is the net movement of particles from a region of their higher concentration to a region of their lower concentration (down a concentration gradient) as a result of their random movement. It is a passive process that requires no cellular energy.
- Active transport is the movement of particles through a cell membrane from a region of lower concentration to a region of higher concentration (against/up a concentration gradient) using energy released from respiration (ATP) and carrier proteins.
Any two valid differences (energy requirement, direction relative to gradient, or requirement for carrier proteins) score the 2 marks.
Key Takeaways
- Diffusion: down a concentration gradient, passive (no energy required).
- Active transport: against a concentration gradient, active (requires energy / ATP and carrier proteins).
Common Mistakes
- Saying active transport moves "along" or "down" the gradient.
- Omitting the mention of "energy" or "ATP".
Things to Be Careful About
- Be precise: state that active transport is against or up the concentration gradient.
Scientists have found that there are different types of starch which have molecules of different shapes. Some molecules are digested rapidly and others are digested slowly.
The graph in Fig. 2.1 shows the effect on the concentration of glucose in the blood after eating two types of starch.
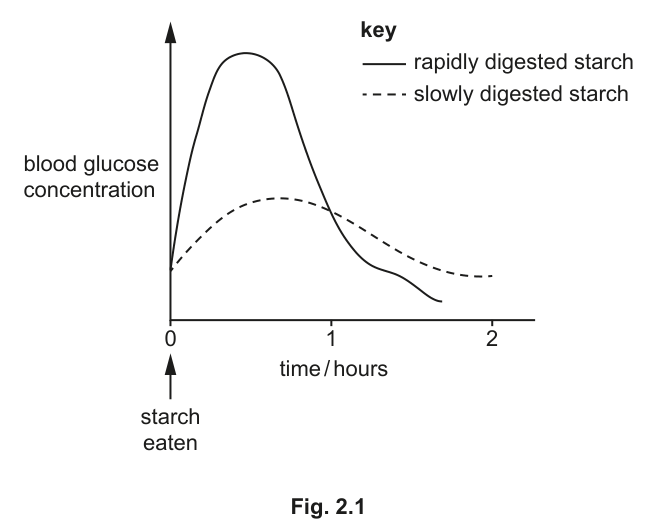
There is already glucose in the blood when the starch is eaten.
Explain how Fig. 2.1 shows this.
Answer
The graph line does not start at the origin / the line starts at a value above zero on the y-axis at time 0.
The graph line starts above zero on the y-axis at time 0.
Walkthrough
Looking at Fig. 2.1, at (when starch is eaten), the curves for both rapidly and slowly digested starch intercept the vertical axis (blood glucose concentration) at a point clearly above zero. This shows that there is a baseline concentration of glucose present in the blood before any starch is digested and absorbed.
Key Takeaways
- If a line on a graph starts at a positive non-zero value on the vertical axis at , the quantity being measured was already present at the start.
Common Mistakes
- Describing the subsequent increase in concentration instead of the initial value at time 0.
Things to Be Careful About
- Explicitly refer to the graph starting above zero or not at the origin.
Both graph lines show an initial increase in blood glucose concentration followed by a decrease.
Suggest two reasons why the blood glucose concentrations decrease.
- ______
- ______
Answer
- Insulin is secreted by the pancreas, causing excess glucose to be taken up by liver and muscle cells and converted into glycogen.
- Glucose is used by body cells in respiration to release energy.
- Glucose is converted to glycogen (stimulated by insulin); 2. Glucose is used up in respiration.
Walkthrough
After eating carbohydrates, blood glucose concentration rises as glucose is absorbed into the bloodstream. Two main processes cause it to decrease back towards the normal level:
- Hormonal regulation (Homeostasis): The increase in blood glucose is detected by the pancreas, which secretes the hormone insulin. Insulin stimulates liver and muscle cells to absorb glucose from the blood and convert it into the insoluble storage polysaccharide glycogen.
- Cellular consumption: Body cells continuously take up glucose from the blood and break it down during cellular respiration to release energy for metabolic processes.
Key Takeaways
- Blood glucose drops because of:
- Conversion of glucose to glycogen (mediated by insulin).
- Cellular uptake and utilization of glucose in respiration.
Common Mistakes
- Confusing glycogen (the storage carbohydrate) with glucagon (the hormone that raises blood glucose).
- Confusing the role of insulin with glucagon.
Things to Be Careful About
- Ensure correct spelling of "glycogen" and "insulin".
Use information from Fig. 2.1 to suggest which type of starch is healthier to have in the diet. Give a reason for your answer.
Answer
- Type of starch: Slowly digested starch
- Reason: It results in a smaller and more gradual rise in blood glucose concentration (less variation), so the pancreas does not have to secrete large amounts of insulin, reducing the risk of developing diabetes.
Slowly digested starch; it causes less variation in blood glucose concentration / requires less insulin to be produced.
Walkthrough
- Identification: Looking at Fig. 2.1, slowly digested starch produces a much lower peak and a gentler, more sustained rise and fall in blood glucose concentration compared to rapidly digested starch, which causes a sharp spike and steep drop.
- Biological reason:
- A gradual release of glucose means there is less fluctuation in blood glucose concentration.
- The pancreas is not suddenly overworked to produce huge surges of insulin.
- This steady supply of energy reduces the risk of developing insulin resistance and Type 2 diabetes.
Key Takeaways
- Complex, slowly digested carbohydrates prevent sharp spikes in blood glucose levels.
- Lower blood glucose spikes reduce strain on the pancreas and lower the risk of diabetes.
Common Mistakes
- Choosing rapidly digested starch because it gives "faster energy", missing the health context of blood glucose control.
Things to Be Careful About
- Name the starch clearly ("slowly digested starch") and give a sound comparative biological reason.
Scientists want to produce a new wheat variety with an increased fibre content.
Describe two methods they could use to do this.
- ______
- ______
Answer
-
Selective breeding (artificial selection):
- Select wheat plants with the highest fibre content and breed/cross them together.
- Repeat this process over many generations by selecting offspring with the highest fibre content.
-
Genetic modification:
- Identify and isolate a gene/allele responsible for high fibre production (from another plant or organism).
- Insert/transfer this gene into the DNA/genome of wheat plants so they produce more fibre.
- Selective breeding: select and breed wheat plants with highest fibre content over generations; 2. Genetic modification: insert a gene for high fibre content into wheat.
Walkthrough
To produce a new crop variety with an enhanced trait (high fibre content), scientists have two primary methods:
-
Selective Breeding (Artificial Selection):
- Step 1: Identify and select individual wheat plants from the population that naturally show the highest fibre content.
- Step 2: Cross/breed these selected plants together.
- Step 3: From the offspring, select those with the highest fibre content and breed them again.
- Step 4: Repeat this selection and breeding process over several successive generations until the high-fibre trait is established in the variety.
-
Genetic Modification (Genetic Engineering):
- Step 1: Locate and extract a specific gene/allele responsible for high fibre production (e.g., enzymes involved in cellulose synthesis) from another organism.
- Step 2: Insert/transfer this gene into the cells/genome of wheat plants.
- Step 3: Grow the modified cells into full wheat plants that express the high-fibre gene.
Key Takeaways
- Selective breeding uses existing natural genetic variation and breeds desirable individuals over generations.
- Genetic modification involves directly inserting a specific gene into the plant's genome.
Common Mistakes
- Giving vague answers like "use chemicals" or "grow them in better soil" (these are environmental, not genetic methods to produce a new variety).
- Failing to mention selecting the best individuals in the description of selective breeding.
- Forgetting to mention the transfer/insertion of a gene in genetic modification.
Things to Be Careful About
- Ensure both the method name and the description of the procedure are given for each of the two methods.
Fig. 3.1 is a photomicrograph showing part of a capillary network of a woman.
The structure labelled X is a red blood cell.
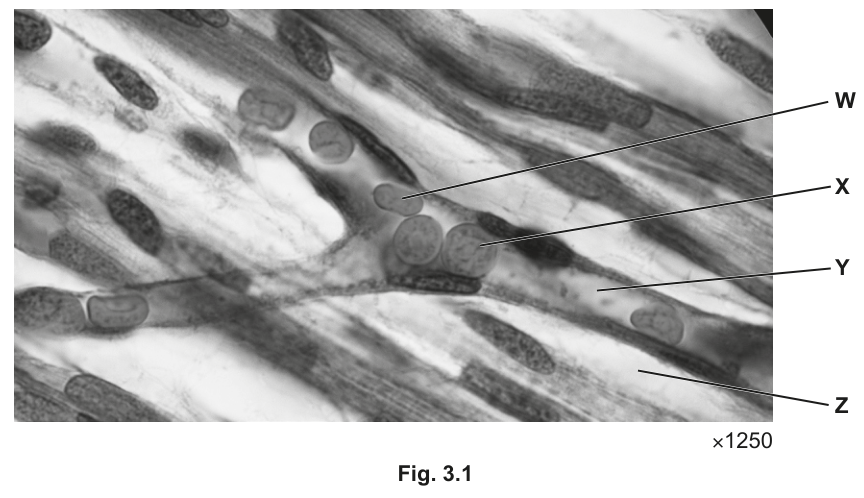
The diameter of cell X in the photomicrograph is .
Calculate the actual diameter of cell X.
Show your working and express your answer in micrometres (µm).
actual diameter of cell X = ______
Working
Convert to micrometres (1 mm = 1000 µm):
Answer
actual diameter of cell X =
8 µm
Walkthrough
The candidate is given the image size of cell X () and the magnification of the photomicrograph (). The fundamental formula linking these is:
Rearranging for actual size gives:
Substitute the given values:
The question specifically asks for the answer in micrometres (). Since , multiply the result by 1000:
Key Takeaways
- The magnification formula is . Always rearrange it to solve for the unknown.
- O Level questions frequently test unit conversion. Memorise that and .
Common Mistakes
- Forgetting the unit conversion: Calculating and stopping there. The mark scheme awards marks for the intermediate value, but the final answer must be in .
- Using the wrong operation: Multiplying instead of dividing. Magnification makes things bigger, so the actual size must be smaller than the image size.
Things to Be Careful About
- The mark scheme explicitly awards 3 marks for the correct final answer, but also gives credit for the working: the correct equation or division (), the intermediate answer in millimetres ( or ), and the final answer with the correct unit ().
- Always include units in your final answer when the question asks for them. Writing just "8" will lose the mark.
W and X are both red blood cells.
Explain why W and X appear different from each other in Fig. 3.1.
Answer
Both W and X are red blood cells and therefore have the same biconcave disc shape.
They appear different because they are being seen from different angles:
- W is viewed from the side (edge-on).
- X is viewed from above (face-on).
Both are the same shape; W is seen from the side and X from above.
Walkthrough
The question states that W and X are both red blood cells. Red blood cells are specialised cells adapted for gas exchange; their defining structural feature is a biconcave disc shape (thick around the edges, thin in the centre). Because they are the same cell type, their actual 3D shape is identical.
A photomicrograph is a 2D image taken from a single focal plane. When a 3D object is viewed from different orientations, its 2D projection changes:
- W is oriented so the microscope is looking at its edge. This makes it appear as a thin, narrow oval or disc.
- X is oriented so the microscope is looking directly at its flat face. This reveals the full circular outline and the biconcave depression.
Key Takeaways
- Micrographs capture a 2D slice or projection of 3D structures. Orientation matters.
- Always state that the structures are the same type/shape before explaining the difference in appearance.
Common Mistakes
- Saying they are different cell types: The question explicitly tells you they are both red blood cells.
- Suggesting one is damaged or dead: The difference is purely geometric and due to the plane of section or orientation.
- Not mentioning "same shape": The mark scheme requires the candidate to acknowledge that the cells are identical in reality.
Things to Be Careful About
- Use the exact terminology from the mark scheme: "side view" (or edge-on) and "view from above" (or face-on). Saying "one is flat and one is round" is vague and may not score.
- The mark scheme accepts "seen from different angles" as a valid summary explanation.
Y and Z are both liquids.
Name the liquids Y and Z and explain how liquid Z forms from liquid Y.
Y = ______
Z = ______
explanation = ______
Answer
Y = plasma (blood plasma)
Z = tissue fluid
Explanation:
Blood plasma inside the capillary is under pressure (hydrostatic pressure). This pressure squeezes (or forces) plasma out of the capillary through the permeable walls to form tissue fluid.
Y = plasma; Z = tissue fluid; plasma is squeezed out of the capillary under pressure.
Walkthrough
The photomicrograph shows a capillary (a single-file vessel) surrounded by tissue. The liquids inside and outside must be identified using knowledge of the circulatory system.
- Identify Y: Y is the liquid component inside the capillary, surrounding the red blood cells. In blood, the liquid matrix is called plasma (or blood plasma).
- Identify Z: Z is the liquid in the extracellular space, surrounding the muscle cells. This is called tissue fluid (or interstitial fluid).
- Explain the formation of Z from Y: Capillaries have thin, permeable walls. The blood inside is pumped by the heart, creating hydrostatic pressure. This pressure is high enough at the arterial end of the capillary to force the plasma (and dissolved small molecules like glucose and amino acids) out of the capillary and into the surrounding tissue spaces, forming tissue fluid. (Note: large molecules like proteins and red blood cells are too big to pass through and remain in the plasma).
Key Takeaways
- Blood = plasma + blood cells. Tissue fluid = what leaks out of plasma through capillary walls.
- The driving force for filtration at the arterial end of a capillary is hydrostatic pressure (blood pressure).
Common Mistakes
- Naming Y as "blood": Blood includes the cells. The liquid part is specifically plasma.
- Naming Z as "interstitial fluid": While technically correct in A Level biology, O Level 5090 specifically requires the term tissue fluid.
- Saying plasma "drips" or "flows" out: The mark scheme requires the concept of pressure squeezing or forcing the fluid out. Without mentioning pressure, the explanation is incomplete.
Things to Be Careful About
- The mark scheme awards marks for: Y = plasma (+ Z = tissue fluid), plasma/Y/blood + under pressure/squeezed, plasma/Y passes out of capillaries to form tissue fluid. Ensure all three logical steps are present: name the liquids, mention pressure, and describe the movement out of the capillary.
The woman has malaria and symptoms of anaemia.
The malarial pathogens infect red blood cells where they multiply to form many new, genetically identical pathogen cells. These new pathogen cells burst out of the red blood cells.
Answer
- A mosquito (anopheles) acts as a vector.
- The mosquito sucks up blood (bites) from the infected woman, picking up the pathogen.
- The mosquito then bites and injects the pathogen into a different person.
Mosquito vector sucks up infected blood and injects pathogen into another person.
Walkthrough
Malaria is a vector-borne disease. The question asks for the transmission pathway from an infected woman to a new host. This requires a sequence of events:
- The Vector: The disease is not transmitted directly from person to person through casual contact. It requires an intermediate organism, a vector. For malaria, this is the female mosquito (specifically the Anopheles genus).
- Acquisition: When the mosquito bites the infected woman, it sucks up her blood. The malarial pathogens (Plasmodium parasites) inside her red blood cells are taken into the mosquito's gut.
- Transmission: The pathogens develop inside the mosquito. When the mosquito bites a different, healthy person, it injects saliva (to prevent clotting) along with the pathogens into the new person's bloodstream, infecting them.
Key Takeaways
- Vector-borne diseases require a living carrier (vector) to move the pathogen between hosts.
- Transmission descriptions must include the vector, the acquisition step (sucking blood), and the transmission step (injecting into a new host).
Common Mistakes
- Saying it is transmitted through water or food: Malaria is not a waterborne or foodborne disease.
- Saying the mosquito "eats" the pathogen and "passes it on": This is too vague. The mark scheme requires specific actions: sucking up blood containing the pathogen, and injecting it into another person.
- Forgetting the vector: Simply saying "blood is transferred" misses the biological mechanism (the mosquito).
Things to Be Careful About
- The mark scheme allows any three points from a list: mosquito, vector, sucks up blood from infected woman (containing pathogen), injects pathogen into different person. Provide all three to be safe.
- Do not name the mosquito species unless asked; "mosquito" is sufficient for O Level.
Answer
Mitosis
Mitosis
Walkthrough
The question states that the malarial pathogens multiply to form many new, genetically identical pathogen cells. The type of nuclear division that produces two or more genetically identical daughter cells from a single parent cell is mitosis.
Meiosis, by contrast, produces genetically different gametes (haploid cells) with half the chromosome number. Since the pathogens are multiplying asexually to increase their numbers within the host, they use mitosis.
Key Takeaways
- Mitosis = growth, repair, asexual reproduction, genetically identical cells.
- Meiosis = production of gametes, genetic variation, haploid cells.
Common Mistakes
- Writing "cell division": This is too vague. The mark scheme requires the specific term mitosis.
- Writing "meiosis": Meiosis reduces chromosome number and creates variation; it is used for sexual reproduction, not asexual multiplication of pathogens.
Things to Be Careful About
- Always use the precise biological term. "Mitosis" is the only accepted answer here.
Answer
The malarial pathogens burst out of and destroy the red blood cells. This reduces the total number of red blood cells in the blood, which causes anaemia.
Red blood cells are destroyed, reducing their number in the blood.
Walkthrough
The question stem tells us that the malarial pathogens multiply inside red blood cells and then burst out of them. Bursting a cell means destroying it (lysis).
Anaemia is defined as a condition where there is a deficiency of red blood cells (or haemoglobin) in the blood, reducing its oxygen-carrying capacity. If the pathogens are actively destroying red blood cells faster than the bone marrow can replace them, the overall red blood cell count drops. This directly causes anaemia.
Key Takeaways
- Anaemia is a low red blood cell count (or low haemoglobin).
- Any condition that destroys red blood cells (like malaria, or heavy bleeding) will cause anaemia.
Common Mistakes
- Saying the pathogen "blocks" the blood vessels: This describes a different malaria symptom (severe malaria can cause blockage), but it does not explain anaemia.
- Saying the pathogen "uses up oxygen": Anaemia is about the number of carriers, not the oxygen being consumed.
- Not mentioning cell destruction: The mark scheme requires the link between the pathogen's action (bursting/destroying) and the result (reduced red blood cell count).
Things to Be Careful About
- The mark scheme awards 1 mark for "red blood cells destroyed" or "reduces the number of red blood cells". Ensure you mention the reduction in cell number.
Answer
Iron deficiency (lack of iron in the diet).
(Acceptable alternatives: heavy loss of blood through injury or menstruation.)
Iron deficiency
Walkthrough
Anaemia is a low red blood cell count or low haemoglobin concentration. To produce haemoglobin, the body needs specific raw materials, primarily iron and amino acids.
If a person's diet lacks iron (iron deficiency), the body cannot synthesise enough haemoglobin. The red blood cells that are produced will be small and pale (microcytic hypochromic anaemia), and the overall oxygen-carrying capacity of the blood drops, causing anaemia.
Another major cause is blood loss. If a person loses a significant amount of blood through injury (trauma) or through regular menstrual periods without iron supplementation, the body cannot replace the red blood cells fast enough, leading to anaemia.
Key Takeaways
- Anaemia is most commonly caused by iron deficiency (dietary) or blood loss.
- Iron is a key component of the haem group in haemoglobin.
Common Mistakes
- Saying "lack of protein": While protein is needed for the globin part of haemoglobin, iron deficiency is the classic and most heavily tested cause of anaemia in the 5090 syllabus.
- Saying "lack of oxygen": Lack of oxygen is the symptom or result of anaemia, not the cause.
Things to Be Careful About
- The mark scheme explicitly accepts "iron deficiency / lack of iron" or "heavy loss of blood through injury / menstruation". Either is a full mark. "Iron deficiency" is the most direct nutritional answer.
Some plants can survive extreme dehydration for a long time in a dormant state. They start growing again when water is available. They are adapted to survive in deserts. Selaginella lepidophylla is an example of this type of plant.
Fig. 4.1 shows a S. lepidophylla plant after several months without water and the same plant three days after rainfall.
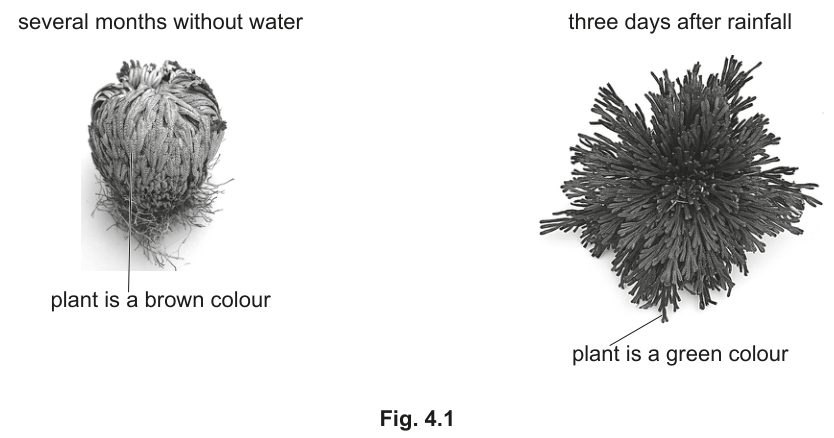
Explain how the changes in the plant, shown in Fig. 4.1, will help it to start growing again after rainfall.
Answer
- The plant is green, indicating it contains chlorophyll / chloroplasts.
- The plant has uncurled / spread out, providing a larger surface area.
- This allows the plant to absorb / trap more light energy.
- Photosynthesis can then occur to produce carbohydrates / glucose / starch for growth.
See working
Walkthrough
The question asks us to explain how the visible changes in Selaginella lepidophylla between its dormant and active states help it to start growing again. We must link the physical observations in Fig. 4.1 to the biological processes required for growth.
- Colour change (brown to green): The green colour indicates the presence of chlorophyll within chloroplasts. In the dormant state, chlorophyll may be broken down or masked, but rehydration allows its synthesis or unmasking. Chlorophyll is the pigment that captures light energy.
- Shape change (curled to uncurled/spread out): When the plant uncurls, it dramatically increases its surface area. A larger surface area exposed to the environment means more leaves are available to absorb / trap light energy.
- Biological process: With chlorophyll present and a large surface area to capture light, photosynthesis can resume. The word equation for photosynthesis is: carbon dioxide + water → glucose + oxygen (in the presence of light and chlorophyll).
- Growth: The carbohydrates (glucose, which is stored as starch) produced by photosynthesis provide the raw materials and energy (via respiration) needed for the plant to start growing again.
Key Takeaways
- Visual adaptations in plants (colour, shape, surface area) are directly linked to their ability to perform photosynthesis.
- Growth requires the production of carbohydrates via photosynthesis, which in turn requires light absorption by chlorophyll.
Common Mistakes
- Observing without explaining: Simply stating "it is green" or "it is bigger" without linking it to chlorophyll, surface area, or photosynthesis will not score marks.
- Missing the sequence: The explanation must flow logically: green → chlorophyll → traps light → photosynthesis → produces food → growth.
- Confusing with respiration: While respiration provides the energy for growth, the production of the food for respiration comes from photosynthesis. The question focuses on the changes that start the process.
Things to Be Careful About
- Match the command word: The command word is "Explain", so every point must include a reason (because, to, so that). Do not just list features.
- Use precise terminology: Use "chlorophyll" or "chloroplasts", "surface area", "photosynthesis", and "carbohydrates" / "glucose". Avoid vague terms like "food" or "sunlight" without context.
- Max marks: The scheme gives 5 potential points but the maximum is 4. Ensure you provide a complete, logical chain covering at least four distinct creditable points.
Fig. 4.2 shows the cell wall and nucleus of a cell from this plant after several months without water.
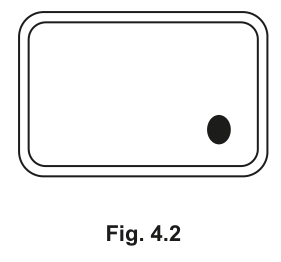
Suggest and explain the appearance of other parts of this cell after several months without water.
You may draw on Fig. 4.2 to help you answer.
Answer
- Water molecules are lost from the cell by osmosis / diffusion / evaporation.
- The sap vacuole shrinks.
- The cytoplasm shrinks.
- The cell membrane pulls away from the cell wall (this is called plasmolysis).
- The cell has a lack of turgor pressure.
See working
Walkthrough
The question asks for the appearance of the other parts of a plant cell after several months without water, based on Fig. 4.2 which only shows the cell wall and nucleus. We must describe the process of plasmolysis.
- Water loss: In the absence of water, the water potential outside the cell is lower than inside. Water moves out of the cell by osmosis (or evaporation/diffusion from the cytoplasm).
- Vacuole and cytoplasm: The sap vacuole (central vacuole) loses water and shrinks. As the vacuole shrinks, the cytoplasm also shrinks and pulls away from the cell wall.
- Cell membrane: The cell membrane (which is partially permeable and lies just inside the cell wall) is pulled inwards along with the cytoplasm, pulling away from the cell wall.
- Turgor and plasmolysis: The loss of water means there is no longer outward pressure on the cell wall. The cell loses turgor pressure and is said to be plasmolysed.
Key Takeaways
- Plasmolysis is the process where a plant cell loses water by osmosis, causing the cytoplasm and cell membrane to shrink and pull away from the cell wall.
- The sap vacuole is the main storage site for water in plant cells; its shrinkage is a key indicator of water loss.
- Turgor pressure is the pressure exerted by the vacuole against the cell wall; without water, this pressure is lost.
Common Mistakes
- Naming the process but not describing it: Simply writing "the cell is plasmolysed" without explaining how it looks (membrane pulling away, vacuole shrinking) will not score all marks.
- Confusing osmosis with diffusion: While water can diffuse, the movement across a partially permeable membrane down a water potential gradient is specifically osmosis.
- Forgetting the cell membrane: The cell membrane is not drawn in Fig. 4.2, but it is the critical structure that pulls away from the cell wall. Candidates must infer its position and behaviour.
- Using incorrect terminology: Do not say "the cell wall shrinks". The cell wall is rigid and does not shrink; the membrane and cytoplasm inside it shrink.
Things to Be Careful About
- Drawings are accepted: The mark scheme states "accept marks from a labelled diagram". If you draw on Fig. 4.2, ensure you clearly show the cell membrane pulled away from the cell wall, a shrunken vacuole, and shrunken cytoplasm. Label these clearly.
- Sequence of events: Water leaves first (osmosis), then the vacuole shrinks, then the cytoplasm/membrane pulls away. Presenting this sequence logically helps secure the marks.
- Max marks: The scheme lists 6 potential points but the maximum is 4. Provide a clear, concise description covering at least four distinct creditable points.
Selaginella lepidophylla is the scientific name for the plant species, which also has the common name ‘resurrection moss’.
Answer
A species is a group of organisms that can reproduce / breed / mate to produce fertile offspring.
See working
Walkthrough
The question asks for the definition of the term "species". This is a fundamental concept in classification.
- Group of organisms: A species is not a single individual but a population or group of similar organisms.
- Reproduction: Members of the same species must be able to breed or mate with each other.
- Fertile offspring: The key criterion is that the offspring produced must be fertile (able to reproduce themselves). For example, a horse and a donkey can mate to produce a mule, but the mule is sterile, so horses and donkeys are different species.
Key Takeaways
- The biological definition of a species relies on the ability to produce fertile offspring.
- Sterile hybrids (like mules) prove that the parent organisms belong to different species.
Common Mistakes
- Missing "fertile": Simply stating "organisms that can breed" is incomplete. They must produce fertile offspring.
- Using common language: Avoid saying "organisms that look alike" or "organisms of the same type". Physical similarity does not define a species (e.g., different breeds of dog look different but are the same species; some different species look very similar).
Things to Be Careful About
- Command word: The command word is "Explain", but for a definition, providing the precise scientific definition is sufficient. Ensure you include both parts: breeding and fertile offspring.
- Terminology: Use "reproduce / breed / mate" and "fertile offspring". These are the exact terms the mark scheme looks for.
State the name of the scientific system used to name the species and suggest one advantage of using the scientific name rather than the common name.
name of system = ______
advantage = ______
Answer
name of system: binomial (nomenclature)
advantage:
- The same name is used internationally / in all parts of the world (common names can differ in different languages or regions).
- OR the genus name helps identify closely related species (shows evolutionary relationships).
binomial; same name internationally / genus name shows related species
Walkthrough
The question asks for two things: the name of the scientific naming system, and one advantage of using it over common names.
- Name of system: The system used to name species is called binomial nomenclature (or simply the binomial system). Each species is given a two-part name: the genus name (capitalised) and the species epithet (lowercase), both italicised (e.g., Homo sapiens, Selaginella lepidophylla).
- Advantage over common names:
- Universality: Common names vary by language and region (e.g., a 'mountain lion', 'puma', and 'cougar' are the same animal). Scientific names are the same in all parts of the world, avoiding confusion.
- Relationships: The genus part of the binomial name (e.g., Panthera in Panthera leo and Panthera tigris) immediately shows that these species are closely related and belong to the same genus.
Key Takeaways
- Binomial nomenclature provides a universal, standardised way to name organisms.
- Scientific names eliminate the ambiguity of common names, which can vary geographically and linguistically.
- The genus name in a binomial name indicates evolutionary relationships.
Common Mistakes
- Spelling: Ensure you spell "binomial" correctly. Do not write "binary" or "binomial naming" without "nomenclature" if you want to be precise, though "binomial" alone is accepted.
- Vague advantages: Simply saying "it is better" or "it is more professional" does not score. You must explain why it is an advantage (e.g., "avoids confusion because common names vary" or "shows related species").
- Confusing with other systems: Do not mention dichotomous keys or taxonomy levels (kingdom, phylum, etc.) as the advantage of the naming system itself.
Things to Be Careful About
- Fill-in-the-blank format: The question provides lines for "name = ___" and "advantage = ___". Ensure your final answer clearly addresses both parts.
- One advantage only: The question asks for "one advantage". Providing multiple may not hurt, but ensure at least one is clearly stated and explained.
- Context: The advantage should be relevant to the use of scientific names in biology, not general benefits of science.
Bacillus subtilis is a species of bacterium that is widely used in biotechnology.
It can be used to manufacture the protein lipase for industrial use.
Fig. 5.1 is a diagram of B. subtilis.
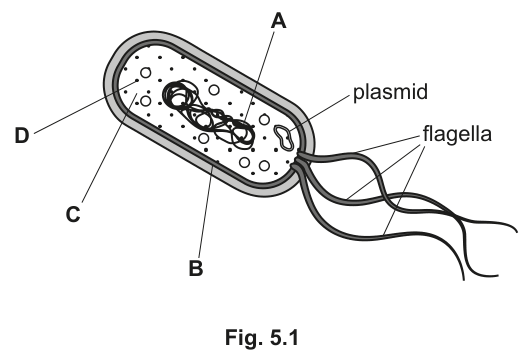
Two of the parts labelled A, B, C and D in Fig. 5.1 are involved in the manufacture of proteins such as lipase.
Identify the two parts, name them and explain their role in protein manufacture.
letter = ______
name = ______
role = ______
letter = ______
name = ______
role = ______
Answer
Part A — DNA (genetic material)
Role: contains the gene that codes for the sequence of amino acids in lipase / carries the instructions for making the protein.
Part D — ribosome
Role: joins amino acids together to build the protein (lipase).
A = DNA, codes for the protein; D = ribosome, joins amino acids together to build the protein
Walkthrough
The question asks which two labelled parts of the bacterium are involved in making a protein such as lipase. Protein manufacture always needs two things: the instructions and the machinery that assembles the protein.
- The instructions are in the DNA. In the diagram, label A points to the tangled mass of circular DNA in the cytoplasm (the bacterial 'nucleoid' — bacteria have no true nucleus). The DNA contains the gene for lipase, which codes for the order of amino acids in the protein. This is worth a mark only if you say it codes for the protein — naming DNA alone is not enough.
- The machinery is the ribosomes, the small dots labelled D scattered through the cytoplasm. Ribosomes read the code and join amino acids together in the correct sequence to build the protein.
The other labels do not fit: B is the cell wall and C is the cell membrane — neither makes protein.
Key Takeaways
- In every cell, DNA holds the code for a protein and ribosomes carry out the assembly.
- Bacterial DNA is a single circular chromosome loose in the cytoplasm; there is no nucleus.
- Ribosomes are the site of protein synthesis in all cells, bacterial and human.
Common Mistakes
- Naming the structures but forgetting the role — the mark for each part requires the function as well as the name.
- Confusing the plasmid with the main DNA: the plasmid is the small extra ring, not label A.
- Saying DNA 'makes' the protein directly — the DNA codes for it; the ribosome builds it.
- Identifying B (cell wall) or C (cell membrane) as involved in protein manufacture.
Things to Be Careful About
- The answer must be given in the requested form: letter, then name, then role, for each of the two parts.
- Use 'codes for the sequence of amino acids' — this phrasing matches the mark scheme exactly.
- Do not write 'nucleus' for a bacterium; bacteria have no nucleus.
Answer
Flagella allow the bacterium to move — it is motile, so it can swim towards food / favourable conditions.
So the bacterium can move (is motile)
Walkthrough
Flagella are the long, whip-like tails visible on the right of Fig. 5.1. Their one job is locomotion: they rotate and propel the bacterium through its liquid surroundings. Being motile lets B. subtilis swim towards nutrients or away from harmful conditions, which improves its chances of survival.
Key Takeaways
- Flagellum = structure for movement in many bacteria.
- 'Motile' is the precise term the mark scheme wants.
Common Mistakes
- Writing that flagella 'help reproduction' or 'attach the bacterium to surfaces' — that is not their function.
- Vague answers such as 'for survival' without naming movement.
Things to Be Careful About
- One mark only — one clear point about movement is enough; do not pad.
Answer
Genes / DNA from another organism can be inserted into a plasmid.
The plasmid can then pass into a bacterial cell, acting as a vector that carries the gene into the cell.
Genes can be inserted into plasmids, which then act as vectors carrying the gene into bacterial cells
Walkthrough
A plasmid is the small extra ring of DNA shown in Fig. 5.1, separate from the main bacterial chromosome. It is useful in biotechnology for two linked reasons, and the mark scheme awards one mark for each:
- A plasmid is a small, self-contained loop of DNA, so a gene taken from another organism (for example, the human gene for a useful protein) can be cut and inserted into it.
- The plasmid can then be taken up by a bacterial cell. It therefore acts as a vector — a carrier that delivers the new gene into the bacterium, where it is expressed.
This is exactly how bacteria are genetically modified to make human insulin and other proteins on an industrial scale.
Key Takeaways
- Plasmid = small circular DNA in bacteria, separate from the main chromosome.
- Plasmids are the standard vectors for transferring genes into bacteria in genetic modification.
Common Mistakes
- Saying only 'plasmids carry genes' without explaining that genes are inserted into them and that they carry the gene into a bacterial cell — both halves are needed for the two marks.
- Confusing plasmids with the main bacterial DNA.
- Saying plasmids 'make proteins' — they carry the gene; the bacterium makes the protein.
Things to Be Careful About
- Two marks, two distinct points: insertion of DNA into the plasmid, and transfer of the plasmid into the cell (vector). Give both.
B. subtilis can be grown industrially in large containers.
When B. subtilis is in ideal conditions it can reproduce rapidly, increasing the population size and the biomass of bacteria in the container.
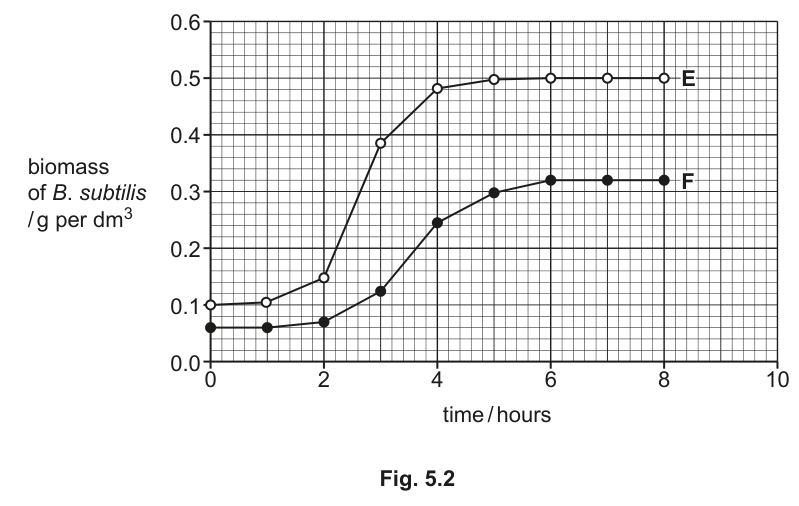
Graphs E and F in Fig. 5.2 show how the biomass of B. subtilis increases after small populations of bacteria are added to two containers with different environmental conditions.
Answer
Fermenter
fermenter
Walkthrough
The large containers in which microorganisms such as bacteria are grown industrially are called fermenters. A fermenter holds the nutrient broth, keeps conditions such as temperature, pH and oxygen supply at their optimum, and keeps the culture sterile so only the desired organism grows.
Key Takeaways
- Fermenter is the exact term for an industrial vessel for growing microorganisms.
Common Mistakes
- Writing 'container', 'tank' or 'incubator' — these do not score; the precise term is fermenter.
Things to Be Careful About
- Spelling matters: 'fermenter' (the vessel), not 'fermentation' (the process).
In graph E the biomass increases as shown in Fig. 5.2.
Indicate using the letter M the part of graph E where bacteria are reproducing most rapidly.
Answer
M is marked on the steepest part of curve E, between the plots at 3 hours and 4 hours.
Letter M placed on curve E between the 3-hour and 4-hour plots (the steepest section)
Walkthrough
The bacteria reproduce fastest where the biomass is increasing most rapidly per hour — that is, where the curve is steepest. On curve E the biomass goes from about 0.15 g per dm³ at 3 hours to 0.49 g per dm³ at 4 hours: a rise of about 0.34 in one hour, far steeper than anywhere else on the curve. So M goes between the 3rd and 4th plotted points. After 5 hours the curve flattens — the population has stopped growing, not stopped reproducing slowly; it is at its maximum.
Key Takeaways
- Rate of reproduction = steepness (gradient) of the biomass–time curve.
- The steepest section of a sigmoid growth curve is the exponential (log) phase.
Common Mistakes
- Marking M at the plateau (5–8 hours) where biomass is highest — highest biomass is not fastest reproduction.
- Marking M in the lag phase (0–2 hours) where the curve is nearly flat.
Things to Be Careful About
- The mark scheme specifies 'between 3rd and 4th plots' — place M on the steep rising section of curve E only, not on F.
Calculate the percentage increase in biomass for graph E in the first 6 hours.
percentage increase in biomass = ______ %
Working
From graph E: biomass at 0 hours = 0.10 g per dm³; biomass at 6 hours = 0.50 g per dm³.
Answer
400 %
400 %
Walkthrough
A percentage increase compares the change to the starting value, not the final value. Read the two values from curve E: at 0 hours the biomass is 0.10 g per dm³ and at 6 hours it is 0.50 g per dm³. The increase is 0.50 − 0.10 = 0.40. Divide by the original 0.10 and multiply by 100 to get 400 %.
Key Takeaways
- Percentage change = (change ÷ original) × 100.
- Always divide by the value at the start of the period named in the question.
Common Mistakes
- Dividing by the final value (0.4 ÷ 0.5 × 100 = 80 %) — wrong; the base is the original biomass.
- Misreading the starting value as 0.06 (that is curve F) or the 6-hour value as 0.32 (also curve F).
- Omitting the × 100 and giving 4.
Things to Be Careful About
- The question says 'graph E' — read both values from curve E only.
- The answer line ends in '%', so the unit is already given; just supply 400.
Answer
- Curve E reaches a higher final biomass (0.50 g per dm³) than curve F (0.32 g per dm³).
- Curve E reaches its maximum biomass sooner (by about 5 hours) than curve F (about 6–7 hours) / the rate of increase of biomass is faster in E than in F.
See working — any two of: higher final biomass in E; E reaches maximum sooner; E starts higher; faster rate of increase in E
Walkthrough
A comparison must name both curves in each statement. The mark scheme lists four acceptable differences and asks for any two:
- E has a higher final biomass (0.50 vs 0.32 g per dm³);
- E reaches its maximum biomass more quickly;
- E starts from a higher biomass (0.10 vs 0.06);
- the rate of increase is faster in E (steeper curve).
Quoting figures strengthens the answer but the comparison itself is what scores.
Key Takeaways
- When asked to 'describe differences', each point must compare both curves, not describe one.
Common Mistakes
- Describing only curve E ('E rises to 0.50') without mentioning F — no comparison, no mark.
- Giving the same difference twice in different words (e.g. 'E is higher' and 'E has greater biomass').
Things to Be Careful About
- Two marks, two genuinely different differences. The mark scheme allows ORA — a correct reversed comparison ('F has a lower final biomass than E') scores equally.
Suggest one environmental condition which could have caused the differences between graph E and graph F.
______
Answer
Temperature (or pH, oxygen concentration, nutrient / food supply).
temperature (or pH, oxygen, nutrient supply)
Walkthrough
Curve F grows more slowly and reaches a lower final biomass, so something in container F was less favourable. Any environmental factor that affects bacterial growth fits: temperature (below or above the optimum slows enzymes), pH, oxygen supply (aerobic respiration needs oxygen), or the supply of nutrients/food. One named factor is all that is required.
Key Takeaways
- Bacterial growth in a fermenter is limited by temperature, pH, oxygen and nutrients.
Common Mistakes
- Naming a non-environmental factor such as 'fewer bacteria added' — the question asks for an environmental condition.
- Vague answers like 'bad conditions' without naming a specific factor.
Things to Be Careful About
- One mark — give one clearly named condition and stop.
Lipase is also produced by the human body.
Explain why it is produced and how its function is different from the function of bile.
Answer
Lipase is produced to digest (hydrolyse) lipids / fats in the small intestine.
It breaks lipids down into fatty acids and glycerol.
Bile does not digest lipid: it emulsifies fat, breaking it into small droplets to increase the surface area for lipase to act on (and neutralises the acidic food from the stomach).
Lipase digests lipids into fatty acids and glycerol; bile emulsifies fat to increase its surface area (and neutralises acid)
Walkthrough
Lipase is made in the pancreas and released into the small intestine. Its job is chemical digestion: it hydrolyses lipids into their two building blocks, fatty acids and glycerol. Both the substrate (lipids) and the end-products (fatty acids and glycerol) are needed for the marks.
Bile is different in kind. It is made in the liver, stored in the gall bladder and released into the small intestine, but it contains no enzyme. Its action is physical: bile salts emulsify large fat droplets into many tiny droplets, which greatly increases the surface area exposed to lipase, so digestion is faster. Bile is also alkaline and neutralises the acidic chyme arriving from the stomach, giving the optimum pH for intestinal enzymes.
So the key contrast: lipase chemically breaks lipid molecules apart; bile physically breaks fat into smaller droplets without changing the molecules.
Key Takeaways
- Lipase: lipid → fatty acids + glycerol (chemical digestion).
- Bile: emulsification (physical), increases surface area, and neutralises stomach acid.
- Bile is not an enzyme and does not itself digest fat.
Common Mistakes
- Saying bile 'digests fats' — it emulsifies them; no chemical bonds are broken.
- Giving the wrong end-products (e.g. 'amino acids', which come from protease) or only one of the two.
- Confusing bile with the enzyme lipase in origin: bile comes from the liver, lipase from the pancreas.
Things to Be Careful About
- Three marks, max three from four listed points — cover the lipase reaction (substrate + products) and at least one distinct bile function.
- 'Emulsifies' and 'increases surface area' are the precise terms; 'breaks fat into small pieces' alone is weaker.
A beam of bright light shines into a human eye for two seconds.
A similar beam of light shines onto one side of the tip of a plant stem for several days.
Describe the ways in which the human and the plant coordinate their responses to these beams of light.
Your answer should include:
- stimulus detection
- method of responding.
human ______
plant ______
Answer
Human
- The light is detected by the retina / light receptors.
- The response involves neurones / the nervous system / electrical impulses.
- Muscles in the iris contract, causing constriction / reduction in size of the pupil.
Plant
- The light is detected by the stem tip.
- The response involves the hormone auxin, which moves / diffuses to the side away from the light.
- This causes more growth / elongation on the shaded side, so the stem grows / bends towards the light (positive phototropism).
Human: pupil reflex via retina and iris muscles; plant: phototropism via auxin redistribution.
Walkthrough
This question asks you to compare how a human and a plant respond to light. The human response is a reflex action (the pupil reflex); the plant response is a growth movement (phototropism). For each one you need to say how the stimulus is detected and how the response is brought about.
Human
- Bright light enters the eye and is detected by light receptors in the retina at the back of the eye.
- This sets off a reflex arc: impulses travel along neurones (sensory, relay and motor neurones) as electrical impulses.
- The motor impulses reach the circular muscles of the iris.
- These muscles contract, pulling the iris inwards and making the pupil smaller (constriction). This reduces the amount of light entering the eye and protects the retina from damage.
Plant
- The tip of the stem detects light coming from one side.
- The plant hormone auxin is involved. The auxin moves or diffuses to the side of the stem away from the light (the shaded side).
- The cells on the shaded side elongate / grow more than the cells on the illuminated side.
- Because one side grows faster, the stem bends towards the light. This is positive phototropism.
The mark scheme awards separate points for detection, the coordination system, and the response, so make sure each is clearly stated.
Key Takeaways
- The human response is nervous and fast; the plant response is hormonal and slow (growth).
- The pupil reflex uses a reflex arc and causes pupil constriction in bright light.
- Phototropism is caused by unequal distribution of auxin, leading to unequal growth.
- Positive phototropism means growth towards light; negative would be away from light.
Common Mistakes
- Saying the plant detects light with its leaves – it is the stem tip.
- Saying auxin moves towards the light – it moves to the shaded side.
- Saying the pupil dilates in bright light – it constricts.
- Forgetting to mention both detection and response.
- Using 'hormones' for the human response – the human response here is nervous, not hormonal.
- Writing 'the plant bends towards light' without mentioning auxin or differential growth – you need the mechanism.
Things to Be Careful About
- Use the exact terms: retina, light receptors, neurones, iris, pupil constriction, stem tip, auxin, shaded side, elongation, positive phototropism.
- The mark scheme wants 'more growth / elongation + on the shaded side' – include both the growth and the side.
- It also wants 'positive phototropism / plant stem grows/bends + towards the light' – include both the name and the direction.
- For the human, 'muscular contractions (in iris)' and 'constriction / reduction in size of the pupil' are separate points, so mention both.
- Keep the answer concise; do not add extra detail about accommodation or lens shape.
Answer
- Synapses transmit impulses between neurones.
- Transmission is in one direction.
- A neurotransmitter is released from vesicles into the synaptic gap.
- It diffuses across the gap and binds with receptor proteins on the next neurone.
Transmission of impulses between neurones across the synaptic gap by neurotransmitter, in one direction.
Walkthrough
A reflex arc is the pathway a nerve impulse takes in a rapid, automatic response. It goes: receptor → sensory neurone → relay neurone (in the spinal cord) → motor neurone → effector (muscle or gland). Synapses are the tiny gaps between neurones.
At a synapse:
- An electrical impulse arrives at the end of the first neurone (the presynaptic neurone).
- This causes tiny vesicles to release a chemical called a neurotransmitter into the synaptic gap.
- The neurotransmitter diffuses across the gap.
- It binds with receptor proteins on the membrane of the next neurone (the postsynaptic neurone).
- This triggers a new electrical impulse in the next neurone.
Because the neurotransmitter is only released from one side and the receptors are only on the other side, the impulse can only travel in one direction across the synapse. This is important in a reflex arc because it ensures the impulse travels the correct way round the pathway.
The mark scheme gives credit for: transmission between neurones; one direction; neurotransmitter; released from vesicles into the gap; diffusion across the gap; binding with receptor proteins. You only need four of these points for full marks.
Key Takeaways
- Synapses are gaps between neurones where impulses are transmitted chemically.
- Neurotransmitters are chemicals that diffuse across the synaptic gap.
- Transmission across a synapse is one-way.
- Reflex arcs are fast, automatic and protective.
Common Mistakes
- Saying the electrical impulse 'jumps' across the gap – it does not; a chemical is released.
- Confusing neurotransmitter with hormone – hormones travel in blood, neurotransmitters cross synapses.
- Saying the synapse is a physical connection – there is a gap.
- Missing the word 'diffusion' – the mark scheme specifically wants diffusion across the gap.
- Not mentioning receptor proteins – binding to receptors is a credited point.
Things to Be Careful About
- Use the exact term 'neurotransmitter', not just 'chemical'.
- Mention 'vesicles' when describing release.
- Say 'synaptic gap' to show you know where the neurotransmitter goes.
- Include 'diffusion' – it is a key word.
- Include 'binds with receptor proteins' – this is a separate mark.
- You only need four points, so choose the clearest four and do not write extra irrelevant detail.