Biology 5090/41 — May/June 2023
Cambridge O-Level · Alternative to Practical · worked solutions for every part, with the mark scheme
Topics Observations and Measurements · Analysis, Conclusions and Evaluation · Use of Techniques, Apparatus and Materials · Experimental Contexts · Planning Experiments and Investigations · Microscopy and Biological Drawing
A student investigated the uptake of water by a leafy plant stem in a laboratory using the apparatus, called a potometer, shown in Fig. 1.1.
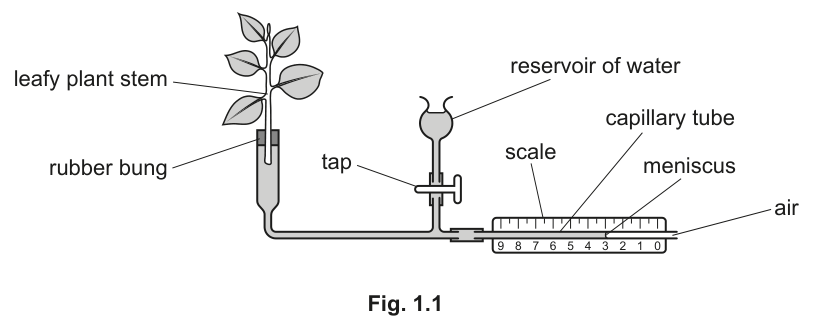
As water is lost from the leaves by transpiration, water is taken into the cut end of the stem. The meniscus of the water in the capillary tube will then move towards the cut end of the stem.
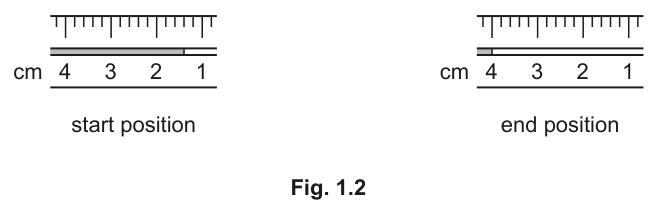
At the beginning of the investigation, the student noted the position of the meniscus on the scale. This is its start position. The apparatus was left for 20 minutes and the position of the meniscus was noted against the scale again. This is its end position. Fig. 1.2 shows the start and end positions of the meniscus.
Complete the column headings in Table 1.1.
Table 1.1
| start position / ______ | end position / ______ | |
|---|---|---|
| position of meniscus |
Read the start and end positions of the meniscus on the scales in Fig. 1.2 and record them in Table 1.1.
Calculate the distance moved by the meniscus.
distance moved = ______
Calculate the rate of movement of the meniscus.
rate = ______
The student had difficulty making an accurate reading of the position of the meniscus.
Suggest what this difficulty was and a way of preventing this difficulty when setting up the apparatus.
difficulty = ______
prevention = ______
The stem was sealed in a tight-fitting rubber bung so that its cut end was in the water, as shown in Fig. 1.1.
Describe what might happen if this seal was not leak-proof and the effect that could have on the results.
description = ______
effect on results = ______
The tap on the reservoir of the potometer can be opened so that more water can flow into the capillary tube, moving the meniscus back to the start of the scale. The tap is then closed and the apparatus is ready to use again.
Explain why the student should take several readings using the same leafy plant stem.
______
The apparatus in Fig. 1.1 is designed to investigate the uptake of water by a leafy stem. Sometimes this same measurement is described as the rate of water loss (transpiration) from the leafy stem.
Explain why the uptake of water and the rate of water loss may be different.
______
A scientist measured the rate of transpiration of a plant growing outside in a field during a morning. The results are shown in Table 1.2.
Table 1.2
| time of day / hours | rate of transpiration / arbitrary units |
|---|---|
| 04:00 | 1.1 |
| 06:00 | 2.4 |
| 08:00 | 4.5 |
| 10:00 | 6.8 |
| 12:00 | 9.9 |
Construct a graph of the rate of transpiration against the time of day. Join your points with ruled lines.

Use your graph to determine the rate of transpiration at 11:00. Show your working on the graph.
rate = ______
Leaves have many microscopic openings called stomata through which water evaporates and is lost from the leaf.
Stomata can be open so that more water vapour is lost, or closed so that less water vapour is lost.
Use this information, your graph and the data given to explain what is happening to the stomata between 04:00 and 12:00.
______
A student reads that the rate of transpiration is lowest when the air around a leafy plant is still.
Design an investigation using the apparatus in Fig. 1.1 to discover whether this statement is correct.
Identify the independent variable in your investigation.
______
A student wanted to discover whether some liquid collected from a vein in a green leaf contained glucose.
Describe a test for glucose that could be carried out, including how it would show that glucose was present.
______
The rest of this paper
1 more questions- Q2Microscopy and Biological Drawing · Observations and Measurements10M