Biology 5090/61 — May/June 2022
Cambridge O-Level · Alternative to Practical · worked solutions for every part, with the mark scheme
Topics Observations and Measurements · Analysis, Conclusions and Evaluation · Experimental Contexts · Use of Techniques, Apparatus and Materials · Planning Experiments and Investigations · Microscopy and Biological Drawing
Some students investigated the effect of temperature on the rate of photosynthesis in pondweed, a plant that lives in water.
The students set up the apparatus shown.
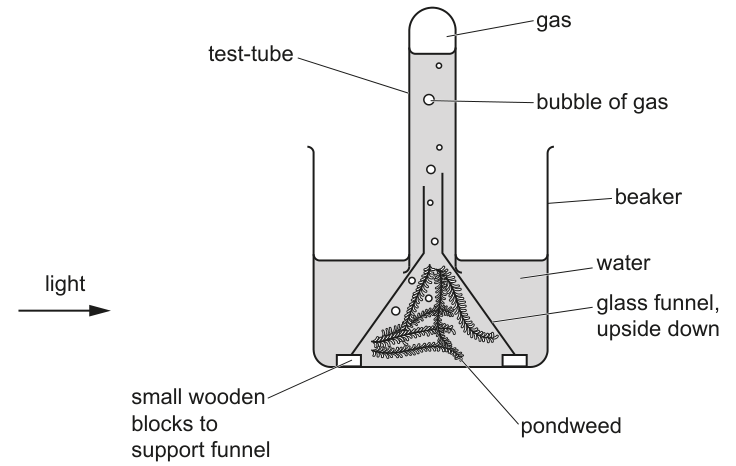
To measure the rate of photosynthesis, the students counted the number of bubbles of gas produced in five minutes.
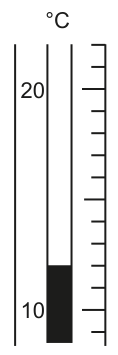
They started the investigation by measuring the temperature of the water in the beaker.
Use the thermometer in the diagram below to read the first temperature taken. Record the temperature in the table on page 4 and complete the table heading.
| temperature / ______ | rate of photosynthesis / number of bubbles in five minutes |
|---|---|
| 4 | |
| 20 | 22 |
| 30 | 35 |
| 40 | 37 |
| 50 | |
| 60 |
The students recorded the number of bubbles of gas produced by the pondweed for five minutes using a tally chart.
They replaced the water with warmer water, measured its temperature and again counted the number of bubbles of gas produced by the pondweed for five minutes. They recorded their results as before.
The students' tally chart is shown in the diagram.
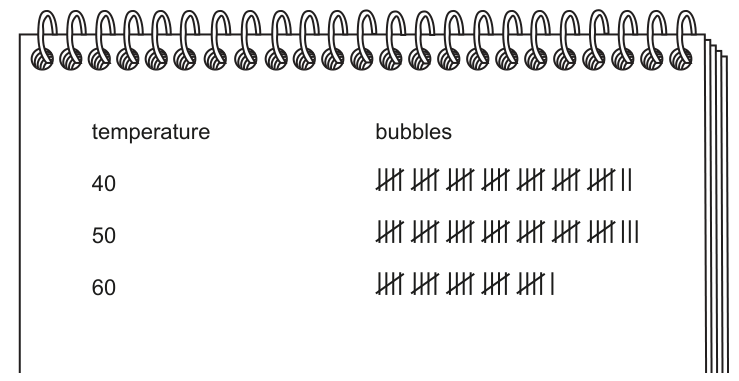
The students then transferred their results to the table.
Complete the table by adding the number of bubbles to the rate of photosynthesis column.
Construct a line graph of the data in the table on the grid. Join your points with ruled, straight lines.

Use your graph to estimate the number of bubbles produced in five minutes at to the nearest whole number. Show your working on the graph.
number of bubbles = ______
Use the data and your graph to describe the effect of temperature on the rate of photosynthesis.
______
Explain why measuring the volume of gas produced instead of counting the bubbles would have been a better method.
______
In this investigation the gas was collected in a test-tube. Name a piece of apparatus that could replace the test-tube to collect and measure the volume of gas released.
______
Design an investigation based on the apparatus shown in the diagram in (a) to find the effect of using different masses of pondweed on the rate of photosynthesis.
Predict the effect of increasing the mass of pondweed on the rate of photosynthesis.
______
Glucose produced in photosynthesis is stored as starch in leaves.
Describe how you would test a green leaf for starch and how you would know that starch was present.
______
The rest of this paper
1 more questions- Q2Microscopy and Biological Drawing · Analysis, Conclusions and Evaluation · Observations and Measurements13M