Biology 5090/62 — May/June 2021
Cambridge O-Level · Alternative to Practical · worked solutions for every part, with the mark scheme
Topics Observations and Measurements · Experimental Contexts · Analysis, Conclusions and Evaluation · Planning Experiments and Investigations · Microscopy and Biological Drawing
Some students investigated the growth of some seedlings.
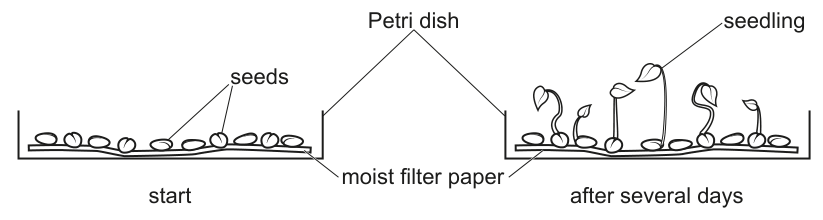
They had three dishes of seedlings, A, B and C, that had been growing in the same conditions for different amounts of time.
They selected three seedlings from each dish and measured their heights to the nearest millimetre. The results for dishes A and C are shown in the table.
| dish | height of seedling 1 / | height of seedling 2 / | height of seedling 3 / | mean height of seedlings / |
|---|---|---|---|---|
| A | 21 | 23 | 25 | |
| B | ||||
| C | 2 | 4 | 3 |
Three seedlings from dish B are shown below. Measure them and record their heights to the nearest millimetre in the table.
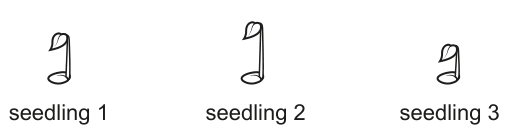
Calculate the mean height of the three seedlings from each dish to the nearest millimetre and complete the table.
Use the data to suggest which seedlings had been growing for the longest period of time and give a reason for your answer.
______
Suggest two reasons why a number of seeds, rather than just one seed, were placed in each Petri dish at the beginning of the investigation.
- ______
- ______
The students selected three seedlings from each dish to measure. Suggest a method the students could have used for choosing the three seedlings and state an advantage of this method.
method = ______
advantage = ______
In another investigation, some students calculated the mean heights of some seedlings as they grew. They recorded their results.
Grown for 6 days mean height .
Grown for 10 days mean height .
Grown for 12 days mean height .
Grown for 15 days mean height .
Grown for 20 days mean height .
Grown for 23 days mean height .
On the grid construct a line graph to show the relationship between time and mean height for these seedlings. Join your points with ruled lines.
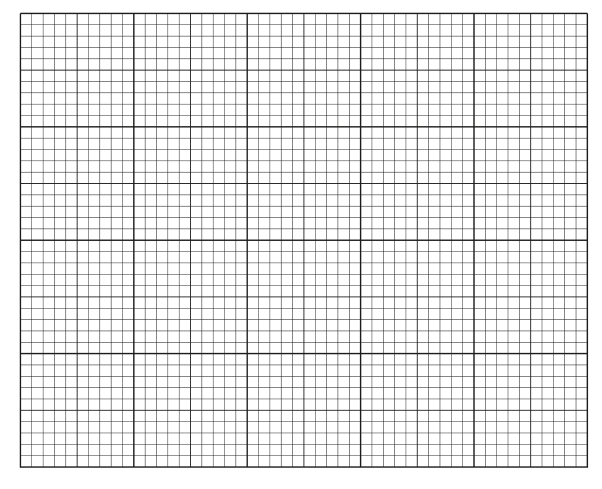
Use the graph to describe the growth of these seedlings.
______
Use the graph to state the time period during which the rate of growth of the seedlings was greatest.
______
Use the data and your graph to calculate the rate of growth of the seedlings for the five days from day 15 to day 20.
rate = ______
State two variables that need to be controlled whilst growing these seedlings and explain why they need to be controlled.
variable 1 ______
variable 2 ______
explanation ______
The seeds needed water to germinate and for the seedlings to grow.
Design an investigation to determine the effect of the pH of water on the growth (mean height) of seedlings. You should use seedlings grown in Petri dishes in a laboratory.
The rest of this paper
1 more questions- Q2Experimental Contexts · Microscopy and Biological Drawing · Observations and Measurements · Analysis, Conclusions and Evaluation13M