Biology 5090/62 — October/November 2020
Cambridge O-Level · Alternative to Practical · worked solutions for every part, with the mark scheme
Topics Experimental Contexts · Planning Experiments and Investigations · Microscopy and Biological Drawing · Observations and Measurements · Analysis, Conclusions and Evaluation · Use of Techniques, Apparatus and Materials
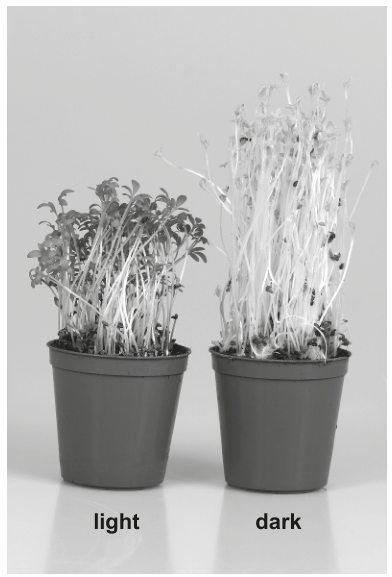
When a seed germinates, the stem of the seedling grows upwards. A student wanted to investigate the effect of light and dark on the growth of seedlings. She grew some seedlings in the light and some in the dark, for the same length of time. The photograph shows the seedlings at the end of the investigation.
State two factors, apart from light and dark, that should be controlled when growing the seedlings for this investigation.
- ______
- ______
Answer
- water / moisture
- temperature
(Other acceptable answers: same growing medium / same size of pot / same amount of soil; same species / type of seed or seedlings; carbon dioxide / oxygen concentration; number of seeds / seedlings.)
Any two from: water / moisture, temperature, same growing medium / same size of pot / same amount of soil, same species / type of seed or seedlings, carbon dioxide / oxygen, number of seeds / seedlings.
Walkthrough
The student is investigating the effect of light and dark on seedling growth. The independent variable is the presence or absence of light, and the dependent variable is the growth (e.g., stem length). To ensure a fair test, all other factors that could affect growth must be kept constant (controlled variables).
Common factors that affect plant growth include:
- Water / moisture: Essential for turgor pressure and photosynthesis.
- Temperature: Affects enzyme activity and metabolic rates.
- Soil / growing medium: Provides minerals and anchorage.
- Species / type of seed: Different plants grow at different rates.
- Carbon dioxide / oxygen: Required for photosynthesis and respiration.
- Number of seeds / seedlings: Competition for resources if too many are in one pot.
Any two of these will score.
Key Takeaways
In any investigation, only the independent variable should change. All other potentially affecting factors must be controlled to ensure the results are valid.
Common Mistakes
- Giving the independent variable (light/dark) or dependent variable (growth/length) as a controlled variable.
- Giving vague answers like "same care" without specifying what that means (e.g., same amount of water).
Things to Be Careful About
- The question asks for factors apart from light and dark.
- Give exactly two points as there are two answer lines.
The student measured the length of the stems of some of the seedlings.
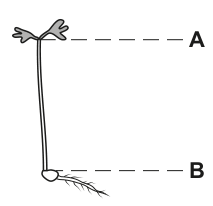
One seedling grown in the light is shown in the diagram below. Measure the length of the stem between A and B and record it.
length of stem = ______
Answer
Place a ruler along the dashed line from A to B.
length of stem = 23
(Accept any value between 22 and 24 mm. The candidate must show the measurement taken with a ruler.)
23 (accept 22–24)
Walkthrough
The candidate is given a diagram (Fig. 1.2) of a seedling grown in the light. Line A is at the top of the stem (below the leaves) and line B is at the base of the stem (above the roots/cotyledon). The candidate must use a ruler to measure the distance between these two lines in millimetres.
In the official exam paper, this distance is designed to be approximately . The mark scheme accepts a range of (i.e., 22, 23, or 24 mm) to account for slight differences in printing or reading the ruler.
Key Takeaways
When measuring from a diagram or photograph in an exam, always use a ruler and read the scale in the correct units (mm here). Record the value to the nearest millimetre unless the scale demands more precision.
Common Mistakes
- Measuring the wrong distance (e.g., including the roots or the leaves in the measurement). The question specifies "between A and B".
- Forgetting the unit ().
- Reading the ruler incorrectly (e.g., starting from the edge of the paper instead of the zero mark, or reading from the wrong end).
Things to Be Careful About
- The answer must be a number within the acceptable range. If measuring on a screen, the value will differ; the candidate must measure the physical paper or the provided image at the correct scale. In this generated context, the mark scheme value is .
- Ensure the ruler is aligned exactly with the dashed lines A and B.
The length of the stems in millimetres of four other seedlings grown in the light and five grown in the dark were recorded by the student, as shown below.
Use this data and your measurement in (a)(ii) to complete the table below.
| seedling | stem length in dark / | stem length in light / |
|---|---|---|
| 1 | ||
| 2 | ||
| 3 | ||
| 4 | ||
| 5 | ||
| mean length / |
Answer
Completed Table:
| seedling | stem length in dark / | stem length in light / |
|---|---|---|
| 1 | 27 | 13 |
| 2 | 25 | 12 |
| 3 | 33 | 19 |
| 4 | 35 | 13 |
| 5 | 30 | 23 (from a)(ii) |
| mean length / | 30 | 16 |
Working for means:
- Dark mean:
- Light mean:
(Note: If the measurement in (a)(ii) was different, e.g., , the light mean would be . Using gives 16.)
Dark mean = 30 mm; Light mean = 16 mm (assuming measurement in (a)(ii) is 23 mm).
Walkthrough
The table requires 10 data points: 5 for dark and 5 for light. The dark data is given directly: 27, 25, 33, 35, 30. The light data has 4 values given (13, 12, 19, 13) and the 5th value must be taken from the measurement in part (a)(ii). Let's assume the measurement from (a)(ii) is (the mark scheme value).
- Enter the data: Fill in the rows with the given values and the measured value.
- Calculate the dark mean: Add the five dark values and divide by 5.
- Calculate the light mean: Add the four given light values and the measured value, then divide by 5.
The mark scheme awards marks for entering all 10 measurements correctly and for calculating both means correctly.
Key Takeaways
Always use the data from previous parts of the question. The mean is the sum of all values divided by the number of values. Ensure you include the unit in the table header if not already present, but the mean value itself is just the number (the unit is in the header).
Common Mistakes
- Forgetting to include the measurement from (a)(ii) in the light column.
- Calculating the mean incorrectly (e.g., dividing by 4 instead of 5 for the light mean if they forget the 5th value).
- Not carrying forward the value from (a)(ii) even if it was wrong (error carried forward is often accepted, but here the value is needed for the mean).
Things to Be Careful About
- The table has 5 rows for seedlings. Ensure all 5 rows are filled before calculating the mean.
- The mean should be rounded to a sensible number of decimal places (here, whole numbers are exact).
- Check that the sum and division are correct.
Another student thought that it would be better to measure 20 seedlings grown in the light and 20 seedlings grown in the dark. Suggest why this would improve the investigation.
______
Answer
Measuring 20 seedlings instead of a small number would increase the reliability of the results. It makes it easier to identify anomalies (outliers), and any single anomaly is less likely to affect the mean significantly.
Increase reliability; easier to identify anomalies / outliers or any anomaly less likely to affect the mean.
Walkthrough
The original investigation used a small number of seedlings (4 in light, 5 in dark). Increasing the sample size to 20 in each group is a standard way to improve an experiment.
- Reliability: Larger sample sizes reduce the effect of random variations (e.g., one seedling might be genetically weaker or have a defect). The results become more representative of the population.
- Anomalies: With a larger dataset, it is easier to spot an anomalous result (a value that doesn't fit the pattern). If one seedling in a group of 20 has a very long stem due to a defect, it won't skew the mean as much as one anomalous seedling in a group of 5 would.
Key Takeaways
Always link sample size to reliability and the ability to spot anomalies. "More data is better" is the principle, but use the biological/experimental terms: reliability, anomalies, mean.
Common Mistakes
- Saying "to get a better result" or "to be more accurate" without explaining why (accuracy is about the instrument, reliability is about consistency/repeats).
- Saying "to avoid errors" (errors can still happen; repeats help deal with them).
Things to Be Careful About
- The mark scheme specifically mentions "reliability" and "anomalies / outliers". Use these terms.
- Do not say "to make it more accurate"; sample size affects reliability, not accuracy (unless systematic error is reduced, which isn't the case here).
Suggest why the growth observed in the dark might be an advantage to a plant in a shady, forest environment.
______
Answer
Growing tall and thin in the dark (etiolation) is an advantage because it makes the plant more likely to reach or find light (e.g., by growing above surrounding vegetation to reach sunlight in a shady forest).
More likely to reach / find / get light.
Walkthrough
In the dark, seedlings exhibit a growth response called etiolation: they grow very tall and thin, with pale leaves (lack of chlorophyll). This is a survival mechanism.
In a dense, shady forest, light is blocked by the canopy above. A seedling germinating on the forest floor needs to reach the light quickly to survive. By growing rapidly upwards (positive gravitropism / negative phototropism in the dark, or simply rapid stem elongation), the seedling increases its chances of emerging above the leaf litter or competing plants to reach sunlight.
Once it reaches light, it will turn green and start photosynthesising.
Note: The mark scheme explicitly rejects "Sun" as an answer and ignores references to photosynthesis. The advantage is about finding the light, not the process of photosynthesis itself (which happens once light is found).
Key Takeaways
Etiolation (growth in dark) leads to tall, pale stems. This is an adaptation to reach light in competitive environments like forests.
Common Mistakes
- Saying "to get more sunlight" (acceptable) but not "to find/reach light" (the mechanism is reaching it).
- Saying "for photosynthesis" (rejected by mark scheme; the growth allows photosynthesis later, but the advantage of the growth itself is reaching the light).
- Confusing this with phototropism (bending towards light); here, the whole stem is growing tall in the absence of directional light.
Things to Be Careful About
- The mark scheme says "R Sun" and "Ig photosynthesis". Focus on the reaching or finding of light.
- Use the term "shady, forest environment" to contextualise the answer.
Use the photograph to describe one other visible difference between the seedlings grown in the light and the dark.
______
Answer
Any one of:
- The seedlings in the light are greener / darker (chlorophyll is present).
- The seedlings in the light have larger / more developed leaves.
- The seedlings in the dark are paler / white / yellow.
- The seedlings in the dark have smaller / undeveloped leaves.
(The photograph shows light-grown seedlings as shorter, greener, and leafier, while dark-grown seedlings are taller, thinner, and pale.)
In light: greener / darker / chlorophyll present; or larger / more developed leaves.
Walkthrough
The question asks for a visible difference from the photograph (Fig. 1.1), apart from the height (which was measured in part a).
Looking at the photograph:
- Light pot: Seedlings are shorter, have dark green leaves (chlorophyll produced due to light), and look bushy.
- Dark pot: Seedlings are very tall, thin, pale/white/yellow (no chlorophyll produced in dark), and have small, undeveloped leaves.
Acceptable observations include:
- Colour: Greener/darker (light) vs pale/white (dark).
- Leaf development: Larger/more leaves (light) vs small/undeveloped (dark).
Key Takeaways
Always look at the provided image carefully. Qualitative observations (colour, shape, size) are as important as quantitative ones (length, mass).
Common Mistakes
- Repeating the height difference (taller/shorter), which was already established in part (a).
- Saying "the dark ones have no chlorophyll" (this is an explanation, not a visible observation; the observation is "paler" or "yellow/white").
Things to Be Careful About
- The question asks for "one other visible difference". Do not mention height.
- Describe what you see, not the biological reason (unless asked to explain). "Greener" is an observation; "chlorophyll is present" is the reason, but often accepted together or as ORA (Opposite Reverse Argument).
Some scientists wanted to investigate the effect of fertiliser on the growth of wheat. Wheat seeds were planted in soil to which nitrogen fertiliser had been added. After the seedlings had grown to a height of , they were measured at regular intervals.
The mean heights of the plants are shown in the table.
| time / days | mean height of plants / |
|---|---|
| 0 | 8 |
| 10 | 10 |
| 30 | 29 |
| 60 | 58 |
| 90 | 73 |
| 110 | 73 |
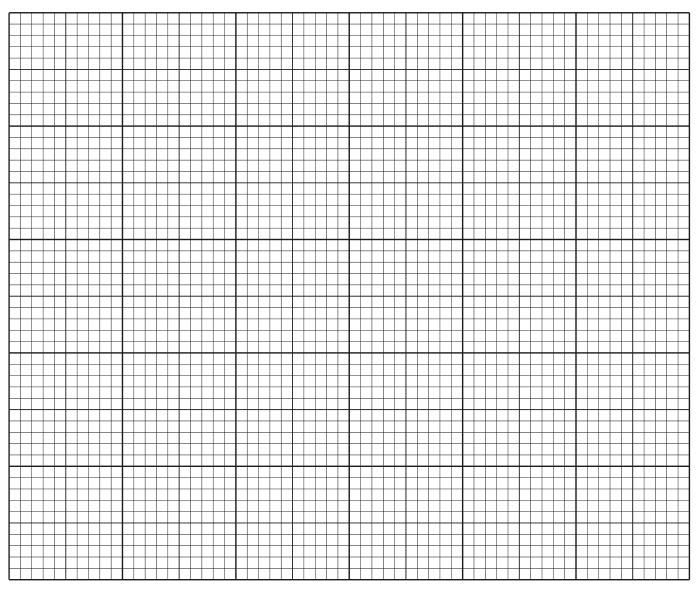
Construct a line graph of the data on the grid below. Join your points with ruled, straight lines.
Answer
Graph Construction:
- Axes:
- x-axis: time / days (linear scale, 0 to 110, occupying at least half the grid width).
- y-axis: mean height of plants / cm (linear scale, 0 to 80 or 0 to 100, occupying at least half the grid height). Must include units.
- Points: Plot the 6 data points correctly:
- (0, 8)
- (10, 10)
- (30, 29)
- (60, 58)
- (90, 73)
- (110, 73)
- Line: Join the points with ruled, straight lines. Do not extrapolate beyond the plotted points (i.e., do not draw the line past x=110 or y=73 if not plotted).
(See diagram-1 for a representation of the expected graph.)
See working for graph construction details.
Walkthrough
The candidate must plot the data from the table on the grid (Fig. 1.3).
- Label axes: The x-axis is the independent variable (time / days). The y-axis is the dependent variable (mean height of plants / cm). Both axes must be fully labelled with the variable name and unit.
- Scales: Use linear scales. The x-axis goes from 0 to 110. The y-axis goes from 8 to 73 (so 0 to 80 or 0 to 100 is appropriate). The scales must occupy at least half the grid in both directions to ensure accuracy.
- Plot points: Carefully plot each coordinate pair (time, height):
- Day 0: 8 cm
- Day 10: 10 cm
- Day 30: 29 cm
- Day 60: 58 cm
- Day 90: 73 cm
- Day 110: 73 cm
- Draw line: The mark scheme specifies "join your points with ruled, straight lines". This is a line graph, but not a smooth curve; use a ruler to connect adjacent points. Do not extrapolate the line beyond the last point (day 110).
Key Takeaways
Graph plotting is heavily marked in 5090. Key marks are awarded for: correct axis labels with units, linear scales starting at 0 (usually) and using >50% of the grid, correct plotting (within half a small square), and correct line type (ruled lines vs smooth curve).
Common Mistakes
- Forgetting units on the axes (e.g., just "time" and "height").
- Using a non-linear scale (e.g., 0, 10, 20, 40, 80).
- Plotting points inaccurately (more than half a small square off).
- Drawing a smooth curve through the points instead of ruled straight lines (the question specifies "ruled, straight lines").
- Extrapolating the line beyond the data (e.g., drawing a line continuing upwards after day 90).
Things to Be Careful About
- The grid in Fig 1.3 is blank. The candidate must choose the scale. A good choice for x-axis: 1 large square = 10 days. For y-axis: 1 large square = 10 cm.
- Ensure the origin (0,0) is used if appropriate, or at least the scales start at 0.
- The line between day 90 and 110 should be horizontal (flat) as the height is constant (73 cm).
Use your graph to find the mean height of the plants at 50 days. Show your working on the graph.
mean height = ______
Working
- Locate 50 days on the x-axis (between 30 and 60).
- Draw a vertical line up from 50 days to the graph line.
- From that intersection, draw a horizontal line across to the y-axis.
- Read the value on the y-axis.
At 50 days, the point lies on the line between (30, 29) and (60, 58). The gradient is roughly constant here.
Approximate calculation:
.
From day 30 to 50 is 20 days. Height increase .
Height at 50 days .
Reading from the graph should give a value around 48 cm.
Answer
mean height = 48
(Accept 47–49 cm. Working must be shown on the graph.)
48 (accept 47–49)
Walkthrough
The candidate must use the graph drawn in part (c)(i) to find the height at 50 days. This is interpolation (reading a value within the range of the data).
- Find 50 on the x-axis. Since 30 and 60 are marked, 50 is two-thirds of the way from 30 to 60.
- Go up to the line graph.
- Go across to the y-axis to read the height.
Looking at the data: at day 30, height is 29 cm. At day 60, height is 58 cm. The growth is roughly linear between these points. 50 days is of the way from 30 to 60. The height increase is . of 29 is . .
The mark scheme accepts (i.e., 47, 48, 49 cm). The candidate must show construction lines on the graph to demonstrate how the value was read.
Key Takeaways
Interpolation requires clear construction lines (vertical from x-axis to graph, horizontal from graph to y-axis). The value read must be consistent with the plotted line.
Common Mistakes
- Not showing construction lines on the graph (marks lost for "working shown").
- Reading the wrong axis.
- Extrapolating incorrectly (though 50 is within the range 30-60, so it's interpolation).
Things to Be Careful About
- The mark scheme requires "working shown". This means drawing the lines on the graph paper.
- The unit is cm.
Describe how the rate of growth of these plants changed between days 0 and 110.
Answer
- Days 0 to 10: Growth rate was slow (or low).
- Days 10 to 60: Growth rate increased (or was fast / steep gradient).
- Days 60 to 90: Growth rate slowed down (or decreased / less steep gradient).
- Days 90 to 110: Growth stopped (or rate = 0 / flat line / no change in height).
(Any three of these points describing the changing rate.)
Slow growth 0-10 days; increased/fast growth 10-60 days; slowed/decreased growth 60-90 days; growth stopped/rate=0 between 90-110 days.
Walkthrough
The question asks to describe how the rate of growth changed. Rate of growth is the gradient (slope) of the line graph.
- 0 to 10 days: Height went from 8 to 10 cm (2 cm in 10 days). Gradient is shallow. Rate is slow.
- 10 to 60 days: Height went from 10 to 58 cm (48 cm in 50 days). Gradient is steep. Rate increased / is fast.
- 60 to 90 days: Height went from 58 to 73 cm (15 cm in 30 days). Gradient is less steep than before. Rate slowed down / decreased.
- 90 to 110 days: Height stayed at 73 cm (0 cm change). Gradient is zero (flat line). Growth stopped.
The candidate must describe these changes in the slope of the line.
Key Takeaways
Rate of growth = gradient of the height-time graph. A steeper line means faster growth. A flat line means no growth (growth has stopped).
Common Mistakes
- Just stating the heights at each time point without describing the rate (e.g., "height was 29 at day 30").
- Saying "growth was fast" without specifying the time period.
- Not mentioning that growth stopped at the end (flat line).
Things to Be Careful About
- Use terms like "rate", "gradient", "slow", "fast", "increased", "decreased", "stopped".
- Cover the whole range 0 to 110 days.
- The mark scheme gives marks for: slow to day 10; increased/fast 10-60; slowed 60-90; stopped/rate=0 90-110.
Describe how to complete this investigation to find whether fertiliser does have an effect on the rate of growth of wheat.
Answer
To find if the fertiliser has an effect, a control experiment is needed:
- Grow a second batch of wheat seeds in soil with no fertiliser (or plain soil / distilled water instead of fertiliser solution).
- Keep all other conditions the same (same method, same type of wheat seeds, same amount of water, same temperature, same light conditions).
- Compare the mean heights (or growth rates) of the two groups.
(Any two points: no fertiliser; same method / same conditions.)
Use a control group with no fertiliser; keep all other conditions (method, seeds, soil, water, temperature) the same.
Walkthrough
The current experiment only has one group of plants (with nitrogen fertiliser). To prove that the fertiliser caused the growth (and not just that wheat grows normally), you need a comparison group.
- Control group: Grow wheat seeds in soil with no nitrogen fertiliser (or soil without added fertiliser).
- Controlled variables: Everything else must be identical to the fertilised group. This includes:
- Same type/variety of wheat seeds.
- Same amount of water.
- Same temperature and light conditions.
- Same soil type (except for the fertiliser).
- Same measurement method and intervals.
- Comparison: After the same time period, compare the mean heights. If the fertilised group is significantly taller, the fertiliser had an effect.
Key Takeaways
A control group lacks the independent variable (fertiliser) but has all other conditions the same. This allows a valid comparison.
Common Mistakes
- Saying "grow plants in the dark" (wrong variable).
- Not specifying that the control should have no fertiliser.
- Forgetting to mention that other conditions must be the same (controlled variables).
Things to Be Careful About
- The mark scheme awards marks for "no fertiliser" and "same method / same experiment / same type of wheat seeds / same soil / same water supply" or any reference to a controlled condition.
- Do not change the dependent variable; measure the same thing (height).
Increase in height was used as a measure of growth. Suggest two other plant features that could have been used to measure growth.
Answer
Any two of:
- Number of leaves
- Length of leaves
- Surface area of leaves
- (Dry) mass / weight of the plant
- Yield of seeds produced
(Note: Fresh mass is also acceptable, but dry mass is often more accurate as it removes water content variation.)
Number of leaves; length / surface area of leaves; (dry) mass / weight / yield.
Walkthrough
Height is a common but not the only way to measure plant growth. Other measurable features include:
- Leaves: Number of leaves, length of leaves, width of leaves, or total surface area of leaves (can be estimated by tracing on graph paper).
- Biomass / Mass: Weighing the plant. Fresh mass (including water) is easy but variable. Dry mass (after drying in an oven) is more accurate as it reflects actual biological material grown.
- Reproduction: Number of flowers or seeds produced (yield).
Key Takeaways
Growth can be measured by increase in size (length, area) or increase in mass (biomass).
Common Mistakes
- Saying "colour" (this is a quality, not a measure of growth, though lack of colour indicates health).
- Saying "number of roots" (hard to measure without disturbing the plant).
- Just saying "mass" without specifying dry mass is okay, but dry mass is better.
Things to Be Careful About
- The question asks for "features that could have been used to measure growth". These must be quantifiable (measurable).
- Give two distinct features.
The rest of this paper
2 more questions- Q2Experimental Contexts · Observations and Measurements · Microscopy and Biological Drawing · Analysis, Conclusions and Evaluation11M
- Q3Experimental Contexts · Use of Techniques, Apparatus and Materials · Planning Experiments and Investigations7M