Biology 5090/32 — May/June 2020
Cambridge O-Level · Practical Test · worked solutions for every part, with the mark scheme
Topics Experimental Contexts · Analysis, Conclusions and Evaluation · Observations and Measurements · Microscopy and Biological Drawing · Planning Experiments and Investigations · Use of Techniques, Apparatus and Materials
In the beetroot plant, cells in the root contain a red pigment. This pigment remains in the cells unless the cells are damaged. If beetroot tissue is placed in water and the cells are damaged, the pigment leaves the cells and colours the water.
You are going to investigate the effect of temperature on the release of the red pigment from beetroot tissue.
You are provided with four cylinders of freshly cut beetroot tissue in water.
- Label four test-tubes A, B, C and D.
- Use the knife provided to cut each of the four cylinders to in length on the white tile.
- Use the forceps to pick up the beetroot cylinders and wash them in the beaker labelled washing water to remove any red pigment from the surface.
- Place one cylinder in each test-tube.
- Use the hot and cold water available to prepare three water-baths using the labelled beakers, at temperatures of approximately , and . Raise your hand to indicate if you require more hot water. Take care using the hot water.
- Place test-tube A in the beaker of water labelled room temperature. Record the temperature of the water in this beaker.
______
- Place test-tube B in the water-bath, test-tube C in the water-bath and test-tube D in the water-bath.
- Use the pipette to add water from each water-bath to the test-tube placed in it until the water level is approximately above the top of the beetroot cylinder.
- Start the stop-clock or note the time ______
- Leave the beetroot cylinders in the water for five minutes.
- You may continue with questions (a)(ii) and (iii) while you are waiting.
- After five minutes, shake each test-tube and observe the colour of the water.
Complete the table including the appropriate temperature for each test-tube.
| colour of water | lightest red | darkest red | ||
|---|---|---|---|---|
| test-tube | ||||
| temperature / |
Answer
| colour of water | lightest red | darkest red | ||
|---|---|---|---|---|
| test-tube | A | B | C | D |
| temperature / | room temperature (recorded value) | 40 | 60 | 80 |
A (room temperature), B (40), C (60), D (80) in order from lightest to darkest red
Walkthrough
The table is ordered from the lightest red water to the darkest red. The coldest tube, A at room temperature, has the least damaged cells, so the least pigment has leaked out and its water is the palest. As temperature rises through B (40), C (60) and D (80), more pigment escapes, so the water gets progressively darker and D is the darkest. Each temperature must sit under the correct letter: A carries the temperature you actually recorded in the room-temperature beaker, and B, C, D carry 40, 60 and 80 respectively.
Key Takeaways
- Higher temperature causes more red pigment to leave beetroot cells, so the water becomes darker red.
- A results table must pair each observation with its correct condition (here, the temperature of each named test-tube).
Common Mistakes
- Putting the temperatures in the wrong order or pairing them with the wrong letters — the table order is fixed by colour intensity, not by the letters.
- Leaving the room-temperature box blank; the temperature you recorded for beaker A must be written in.
- Writing vague colour words like 'red' for every tube; the table already gives the order, so the letters and temperatures are what is being marked.
Things to Be Careful About
- All eight boxes must be completed for full marks.
- The temperature for A is the value you measured, not a fixed number — write what you recorded.
Suggest why the cylinders were all cut to length.
______
Answer
So that each cylinder has the same surface area / size in contact with the water, so the results can be compared and temperature is the only variable.
Same size / surface area so temperature is the only variable and results can be compared
Walkthrough
This is a fair-test question. If one cylinder were longer than another, it would have more cells and more surface area touching the water, so more pigment could leak out for reasons other than temperature. Cutting all cylinders to exactly 30 mm keeps the amount of beetroot the same, so any difference in colour must be due to temperature alone — temperature is the independent variable and everything else is controlled.
Key Takeaways
- In a fair test, all variables except the independent variable must be kept the same.
- Equal lengths of tissue give equal surface area in contact with the water.
Common Mistakes
- Writing only 'to make it fair' without saying what is kept the same or why — the mark needs the comparison or the 'temperature is the only variable' idea.
- Saying 'so they fit in the test-tube' — that is not a scientific reason.
Things to Be Careful About
- Any one of the accepted answers scores: comparison of results, same surface area/size, or temperature as the only variable.
State one possible source of error in the method used. Explain how the method could be improved.
source of error = ______
improvement = ______
Answer
Source of error: the cylinders are not all in the water for the same time.
Improvement: place each cylinder in its test-tube and start timing one at a time, timing each separately.
(Alternative: source of error — the volume of water in each test-tube is not exactly the same; improvement — measure the volume of water added with a measuring cylinder. Alternative: source of error — the water-bath temperatures are not maintained and the water cools; improvement — keep topping up with hot water / use a thermostatically controlled water-bath.)
Any one error with its matching improvement, e.g. tubes not timed equally — time each one separately
Walkthrough
The mark scheme offers three error–improvement pairs and you need one pair, with the improvement genuinely fixing the error you name.
- Timing. Setting up four tubes takes time, so tube A has been in its water longer than tube D by the time you stop. Longer time means more pigment diffuses out. Fix: start each tube and time it individually, or stagger the start times so each runs exactly five minutes.
- Volume of water. You add water 'until the level is approximately 1 cm above the cylinder', which is not measured — a larger volume dilutes the pigment more, giving a paler colour that is not due to temperature. Fix: measure a fixed volume, e.g. , into each tube.
- Temperature control. Water-baths made from beakers of hot water cool down during the five minutes, so tube D may not stay at . Fix: keep checking and topping up with hot water, or use a thermostatic water-bath.
Key Takeaways
- A good improvement must address the specific error named — the pair is marked together.
- Time, volume and temperature are the three variables this method fails to control precisely.
Common Mistakes
- Writing 'human error' or 'to avoid mistakes' — these are explicitly rejected.
- Naming an error but giving an improvement for a different error.
- Saying 'repeat the experiment' — that improves reliability but does not fix the named error.
Things to Be Careful About
- Both lines must be filled in: an error with no improvement, or an improvement with no error, loses a mark.
Suggest what you can conclude from your observations and explain your answer.
conclusion = ______
explanation = ______
Answer
Conclusion: as temperature increases, more red pigment is released (into the water).
Explanation: heat damages the cells / cell membranes, so the pigment can leak out.
More pigment released as temperature increases, because heat damages the cell membranes
Walkthrough
The conclusion is simply the trend in your observations: the hotter the water-bath, the darker the water, so more pigment has left the beetroot. The explanation is the biology behind it: high temperature damages the cell membranes (the partially permeable membranes that normally hold the pigment inside the cells). Once the membranes are damaged, the pigment is no longer held back and diffuses into the surrounding water. Both parts are needed — the trend is one mark, the membrane-damage reason is the other.
Key Takeaways
- A conclusion states the trend; an explanation gives the biological reason for the trend.
- Cell membranes are denatured/damaged by high temperatures, losing their selectively permeable property.
Common Mistakes
- Giving the conclusion without the explanation, or vice versa — each carries its own mark.
- Saying the pigment 'evaporates' or the cells 'die' without mentioning the membrane.
- Writing 'enzymes denature' — this question is about membrane damage, not enzyme activity.
Things to Be Careful About
- The mark scheme accepts the reverse argument (less pigment at lower temperature) equally.
Another student used an instrument called a colorimeter to obtain a numerical value for the colour in each test-tube. She did the experiment twice.
Explain how repeating the experiment makes the observations of colour more reliable.
______
Answer
A mean / average of the two readings can be calculated, which reduces the effect of an anomalous result.
A mean can be calculated / an anomaly shows up
Walkthrough
A single colour judgement or a single colorimeter reading could be wrong — an anomaly. Repeating the experiment gives a second value for each temperature: if the two agree, you can be confident in the result; if they differ, the odd one out is exposed, and taking the mean reduces the effect of any one-off error. Either idea — calculating a mean, or showing up an anomaly — earns the mark.
Key Takeaways
- Repeats allow a mean to be calculated and anomalous results to be identified.
Common Mistakes
- Saying repeats make it 'more accurate' without saying how — the mark scheme wants the mean or the anomaly idea.
Things to Be Careful About
- One mark only: one clear reason is enough.
Some of the readings from the colorimeter are shown in the table.
| temperature / | colorimeter reading / arbitrary units | ||
|---|---|---|---|
| experiment 1 | experiment 2 | average | |
| 20 | 0.6 | 1.6 | |
| 40 | 1.6 | 2.8 | |
| 60 | 4.9 | 4.7 | |
| 80 | 9.8 |
The colorimeter reading at for experiment 1 was:
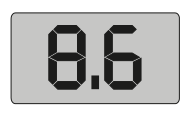
Insert this reading into the table of results.
Answer
| temperature / | experiment 1 | experiment 2 | average |
|---|---|---|---|
| 80 | 8.6 | 9.8 |
The colorimeter reading at for experiment 1 is 8.6 arbitrary units, inserted in the table.
8.6
Walkthrough
The display in Fig. 1.1 shows 8.6. This is the missing experiment 1 reading at , so write 8.6 in the empty cell in that row, in the experiment 1 column.
Key Takeaways
- Read a 7-segment digital display carefully — 8.6, not 8.5 or 8.8.
Common Mistakes
- Misreading the display or putting the value in the wrong column (experiment 2) or wrong row.
Things to Be Careful About
- The unit is already given in the table header (arbitrary units), so just the number goes in the cell.
Calculate the average reading for each temperature and complete the table.
Working
:
:
:
:
Answer
| temperature / | average / arbitrary units |
|---|---|
| 20 | 1.1 |
| 40 | 2.2 |
| 60 | 4.8 |
| 80 | 9.2 |
1.1, 2.2, 4.8, 9.2
Walkthrough
Each average is the sum of the two readings divided by two. For example, at : , and . Do the same for each row. Note that at you must use the 8.6 you read from the display in (b)(ii): , and . An error in the 8.6 is carried forward — the averaging method still scores.
Key Takeaways
- Mean = sum of the values ÷ number of values.
Common Mistakes
- Adding the two readings but forgetting to divide by two.
- Using a wrong display reading without the ecf-safe method shown.
Things to Be Careful About
- Give each average to one decimal place, matching the precision of the raw readings.
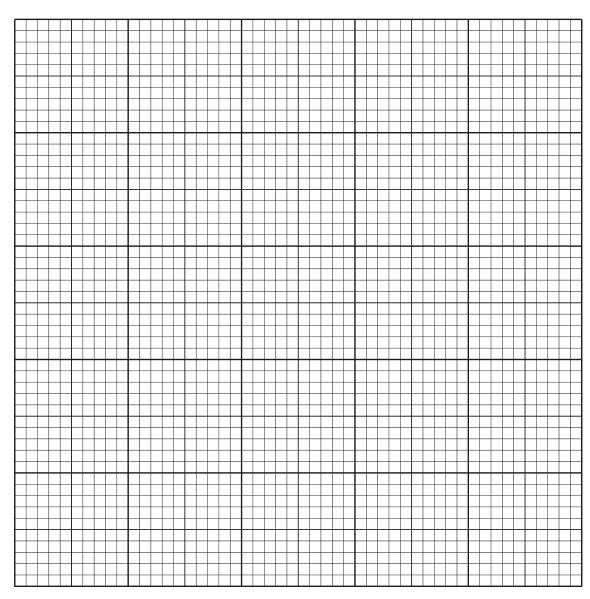
On the grid construct a line graph to show the relationship between temperature and average colorimeter readings. Join your points with ruled, straight lines.
Answer
- Temperature on the x-axis, average colorimeter reading on the y-axis; both axes fully labelled with units.
- Linear scales starting at the origin, using at least half the grid in both directions.
- All four points plotted clearly and correctly: (20, 1.1), (40, 2.2), (60, 4.8), (80, 9.2).
- Points joined with ruled straight lines (a single continuous line graph).
Line graph of average colorimeter reading against temperature with labelled axes, linear scales, four correct plots joined by ruled straight lines
Walkthrough
This is a graph-construction task marked on conventions, each worth a mark:
- Axes and labels. Temperature (the independent variable) goes on the x-axis, average colorimeter reading (the dependent variable) on the y-axis. Both axes must be labelled with their quantity and unit: 'temperature / ' and 'average colorimeter reading / arbitrary units'.
- Scales. Use a linear scale on each axis with a value written at the origin (0), and choose scales that spread the points over at least half the grid in both directions — e.g. x-axis 0 to 100 in divisions of 10, y-axis 0 to 10 in divisions of 1.
- Plotting. Mark each of the four points precisely — within half a small square of its true position — using a small neat cross or dot.
- Line. Join the points with ruled straight lines, point to point, as instructed. Do not draw a smooth curve and do not extrapolate beyond 20 or 80.
Key Takeaways
- Independent variable on the x-axis, dependent variable on the y-axis, both labelled with units.
- Linear scales from the origin, good use of the grid, accurate plots, ruled lines.
Common Mistakes
- Swapping the axes or omitting the units from the labels.
- Using an awkward scale (e.g. 3 squares per ) that wastes the grid.
- Drawing a smooth curve when the question says ruled straight lines.
- Extrapolating the line beyond the plotted points.
Things to Be Careful About
- Plot the averaged values (1.1, 2.2, 4.8, 9.2), not the raw readings.
Use your graph to determine the average colorimeter reading for .
Show your working on your graph.
______ arbitrary units
Answer
On the graph, find on the x-axis, draw a ruled vertical construction line up to the plotted line, then a ruled horizontal line across to the y-axis, and read off the value.
Reading from the correct graph: approximately 3.5 arbitrary units (accept any value consistent with the candidate's own graph, roughly 3.4–3.6).
average colorimeter reading at = 3.5 arbitrary units
Approximately 3.5 arbitrary units (value read from the candidate's own graph, with construction lines shown)
Walkthrough
lies between your plotted points at 40 and 60, so this is interpolation — reading a value from between plotted points, which is allowed (unlike extrapolating beyond them). Draw a ruled vertical line from 55 on the x-axis up to where it meets your line graph, then a ruled horizontal line from that point across to the y-axis. Where it crosses the y-axis is your reading. The construction lines themselves earn a mark — 'show your working on your graph' means exactly this. The value mark is awarded for a reading consistent with your own plotted line; from the given averages it is about 3.5 arbitrary units.
Key Takeaways
- Interpolation between plotted points is valid; extrapolation beyond them is not.
- Construction lines on the graph are the required working.
Common Mistakes
- Reading from between the wrong pair of points, or reading the x-value instead of the y-value.
- Not drawing the construction lines, losing the working mark.
- Extrapolating instead of interpolating.
Things to Be Careful About
- The accepted value depends on your own graph — a reading consistent with correctly plotted points scores even if it differs slightly from 3.5.
The rest of this paper
2 more questions- Q2Experimental Contexts · Microscopy and Biological Drawing · Observations and Measurements · Analysis, Conclusions and Evaluation12M
- Q3Experimental Contexts · Use of Techniques, Apparatus and Materials · Microscopy and Biological Drawing · Analysis, Conclusions and Evaluation9M