Biology 5090/31 — May/June 2020
Cambridge O-Level · Practical Test · worked solutions for every part, with the mark scheme
Topics Experimental Contexts · Analysis, Conclusions and Evaluation · Observations and Measurements · Microscopy and Biological Drawing · Planning Experiments and Investigations · Use of Techniques, Apparatus and Materials
In the beetroot plant, cells in the root contain a red pigment. This pigment remains in the cells unless the cells are damaged. If beetroot tissue is placed in water and the cells are damaged, the pigment leaves the cells and colours the water.
You are going to investigate the effect of temperature on the release of the red pigment from beetroot tissue.
You are provided with four cylinders of freshly cut beetroot tissue in water.
-
Label four test-tubes A, B, C and D.
-
Use the knife provided to cut each of the four cylinders to in length on the white tile.
-
Use the forceps to pick up the beetroot cylinders and wash them in the beaker labelled washing water to remove any red pigment from the surface.
-
Place one cylinder in each test-tube.
-
Use the hot and cold water available to prepare three water-baths using the labelled beakers, at temperatures of approximately , and . Raise your hand to indicate if you require more hot water. Take care using the hot water.
-
Place test-tube A in the beaker of water labelled room temperature. Record the temperature of the water in this beaker.
______
-
Place test-tube B in the water-bath, test-tube C in the water-bath and test-tube D in the water-bath.
-
Use the pipette to add water from each water-bath to the test-tube placed in it until the water level is approximately above the top of the beetroot cylinder.
-
Start the stop-clock or note the time ______
-
Leave the beetroot cylinders in the water for five minutes.
-
You may continue with questions (a)(ii) and (iii) while you are waiting.
-
After five minutes, shake each test-tube and observe the colour of the water.
Complete the table including the appropriate temperature for each test-tube.
| colour of water | lightest red | darkest red | ||
|---|---|---|---|---|
| test-tube | ||||
| temperature / |
Suggest why the cylinders were all cut to length.
______
State one possible source of error in the method used. Explain how the method could be improved.
source of error = ______
improvement = ______
Suggest what you can conclude from your observations and explain your answer.
conclusion = ______
explanation = ______
Another student used an instrument called a colorimeter to obtain a numerical value for the colour in each test-tube. She did the experiment twice.
Explain how repeating the experiment makes the observations of colour more reliable.
______
Some of the readings from the colorimeter are shown in the table.
| temperature / | colorimeter reading / arbitrary units | ||
|---|---|---|---|
| experiment 1 | experiment 2 | average | |
| 20 | 0.6 | 1.6 | ______ |
| 40 | 1.6 | 2.8 | ______ |
| 60 | 4.9 | 4.7 | ______ |
| 80 | ______ | 9.8 | ______ |
The colorimeter reading at for experiment 1 was:
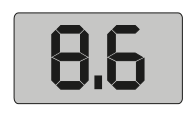
Insert this reading into the table of results.
Calculate the average reading for each temperature and complete the table.
On the grid construct a line graph to show the relationship between temperature and average colorimeter readings. Join your points with ruled, straight lines.

Use your graph to determine the average colorimeter reading for .
Show your working on your graph.
______
The rest of this paper
2 more questions- Q2Experimental Contexts · Microscopy and Biological Drawing · Observations and Measurements · Analysis, Conclusions and Evaluation12M
- Q3Experimental Contexts · Use of Techniques, Apparatus and Materials · Microscopy and Biological Drawing · Analysis, Conclusions and Evaluation9M