Biology 5090/62 — October/November 2019
Cambridge O-Level · Alternative to Practical · worked solutions for every part, with the mark scheme
Topics Analysis, Conclusions and Evaluation · Experimental Contexts · Use of Techniques, Apparatus and Materials · Planning Experiments and Investigations · Microscopy and Biological Drawing · Observations and Measurements
Catalase is an enzyme found in most living organisms. It catalyses the breakdown of hydrogen peroxide to water and oxygen.
Potato tissue contains catalase. When a thin disc of potato is dropped into a test-tube containing hydrogen peroxide solution, it first sinks to the bottom. As oxygen is produced, bubbles form on the potato disc that make it float to the surface.
Some students did an experiment to find the activity of potato catalase on different concentrations of hydrogen peroxide solution.
thick discs were cut from the end of a cylinder of potato tissue as shown in the diagram below.
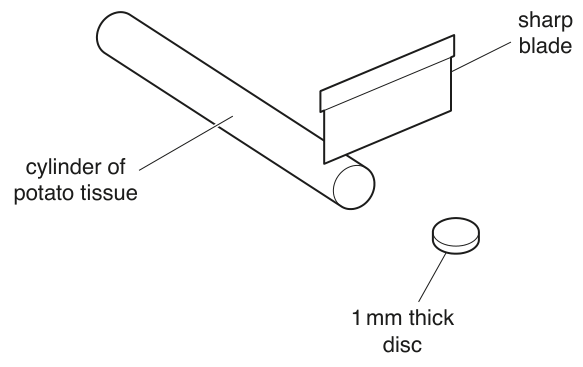
One disc was dropped into a test-tube containing of hydrogen peroxide solution. A stop-watch was started immediately and the time taken for the disc to reach the surface of the solution was recorded. The time was rounded to the nearest whole second.
A second disc was then dropped into the test-tube and the time taken for it to reach the surface recorded. This process was repeated with a third disc.
The experiment was then repeated with a test-tube containing of hydrogen peroxide solution.
The results are shown in the table below.
The procedure was repeated with a test-tube containing of hydrogen peroxide solution.
The times recorded were , and seconds.
Complete the table by entering the results for hydrogen peroxide solution (rounded to the nearest whole second) and calculating the means.
| percentage concentration of hydrogen peroxide solution | time taken for potato disc to reach surface of hydrogen peroxide solution / seconds | |||
|---|---|---|---|---|
| disc 1 | disc 2 | disc 3 | mean | |
| 1 | 30 | 26 | 34 | |
| 2 | 12 | 14 | 13 | |
| 3 |
Hydrogen peroxide is a harmful or irritating substance.
State two precautions you would take when using hydrogen peroxide in an experiment.
- ______
- ______
State what equipment the students could use to measure of hydrogen peroxide solution.
______
Describe the effect of increasing the concentration of hydrogen peroxide solution on the time taken for the potato discs to float.
______
Explain what the students could do to make their results more reliable.
______
Suggest one possible source of error in the method used in this experiment. Explain why this could have affected the results.
source of error ______
explanation ______
Another potato disc was dropped into a test-tube containing of distilled water. It sank to the bottom of the test-tube.
After 30 minutes it was still at the bottom of the test-tube.
Explain why the disc did not float.
______
Describe in detail how you could show that it was an enzyme that caused bubbles to be produced when the potato discs were dropped into hydrogen peroxide solution.
A group of students decided to investigate the effect of increasing the concentration of catalase on the rate of oxygen production. They altered the concentration of the enzyme by using different numbers of thick potato discs.
They used the apparatus in the diagram below to collect the oxygen produced by different numbers of potato discs in of hydrogen peroxide solution. They recorded how long it took to produce of oxygen with each number of discs.
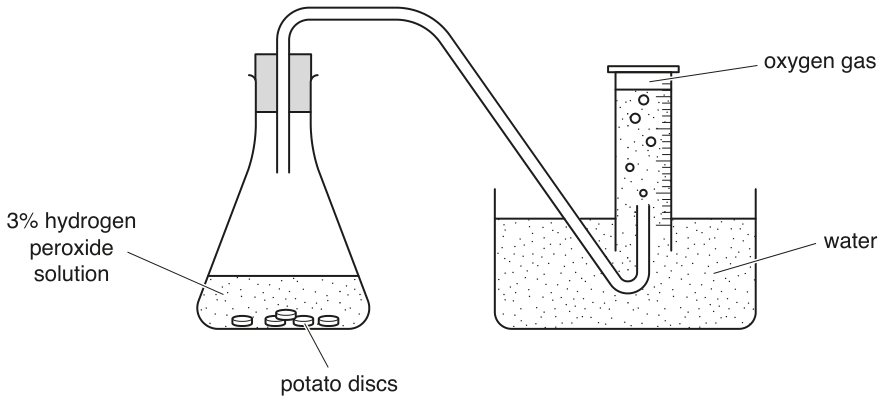
Their results are shown in the table below.
| number of potato discs | time to produce of oxygen / seconds |
|---|---|
| 1 | 110 |
| 2 | 46 |
| 3 | 32 |
| 4 | 30 |
| 5 | 30 |
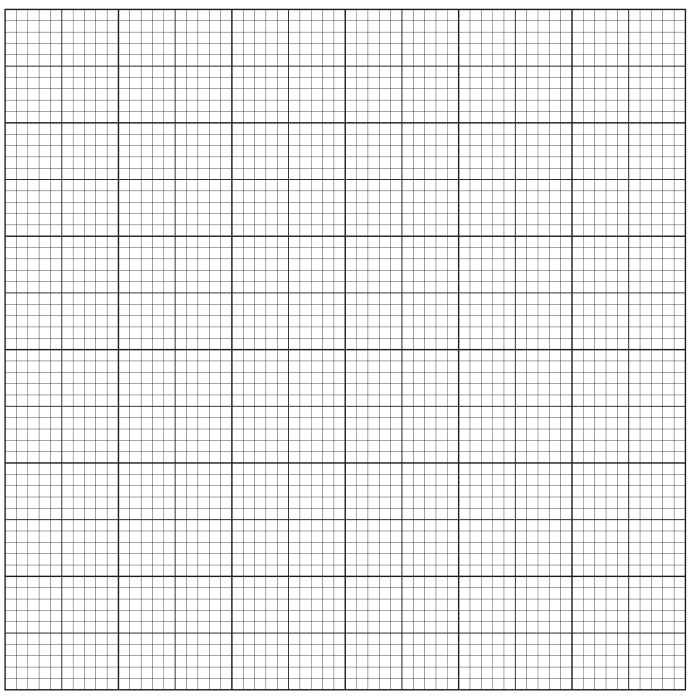
Construct a line graph of the data in the table on the grid below. Draw a smooth curve through your points.
Describe the effect of increasing enzyme concentration on the rate of the reaction.
Suggest an explanation for the shape of the line between 4 and 5 discs of potato.
The rest of this paper
2 more questions- Q2Experimental Contexts · Analysis, Conclusions and Evaluation · Microscopy and Biological Drawing12M
- Q3Observations and Measurements · Analysis, Conclusions and Evaluation5M