Biology 5090/32 — October/November 2019
Cambridge O-Level · Practical Test · worked solutions for every part, with the mark scheme
Topics Experimental Contexts · Observations and Measurements · Analysis, Conclusions and Evaluation · Use of Techniques, Apparatus and Materials · Planning Experiments and Investigations · Microscopy and Biological Drawing
Catalase is an enzyme found in most living organisms. It catalyses the breakdown of hydrogen peroxide to water and oxygen.
Potato tissue contains catalase. When a thin disc of potato is dropped into a test-tube containing hydrogen peroxide solution, it first sinks to the bottom. As oxygen is produced, bubbles form on the potato disc that make it float to the surface.
You are going to do an experiment to find the activity of potato catalase on different concentrations of hydrogen peroxide solution.
Hydrogen peroxide is harmful and an irritant and may cause damage to eyes and skin. Wear eye protection while doing the experiment.
You are provided with four large test-tubes:
- one containing of hydrogen peroxide solution
- one containing of hydrogen peroxide solution
- one containing of hydrogen peroxide solution
- one empty test-tube
and a cylinder of potato tissue.
- Label the empty test-tube .
- Measure and add of distilled water to this test-tube.
- Cut a section of potato tissue approximately thick from one end of the cylinder of potato tissue. You will not need to use this.
- Cut a disc thick from the same end of the cylinder of potato as shown in the diagram below.
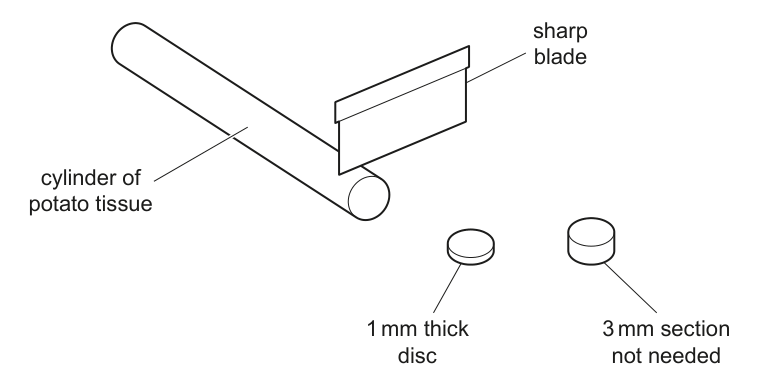
- Use forceps to pick up the disc and drop it into the test-tube labelled . The disc will sink to the bottom of the test-tube.
Note the time ______
You are going to use the second-hand on a clock, or a stop-watch, to time how long it takes for a disc to float to the surface when placed in hydrogen peroxide solution.
- Cut another potato disc thick.
- Drop the disc into the test-tube containing hydrogen peroxide solution and immediately start timing.
- Stop timing when the disc reaches the surface of the hydrogen peroxide solution.
start time ______
end time ______
time taken for disc to reach the surface = ______
- Do not remove the disc from the test-tube.
- Cut another fresh disc of potato tissue thick and drop it into the hydrogen peroxide solution. Immediately start timing. Stop timing when the disc reaches the surface of the hydrogen peroxide solution.
start time ______
end time ______
time taken for disc to reach the surface = ______
- Repeat this procedure with another fresh disc of potato, recording results as before.
start time ______
end time ______
time taken for disc to reach the surface = ______
Answer
Record the start time and the end time for each of the three fresh discs in hydrogen peroxide solution, and for each disc calculate:
Record all three times taken in seconds. (The actual values depend on the candidate's own experiment; the mark scheme credits three end times recorded and three correctly calculated times taken.)
Three end times recorded and three correctly calculated times taken, in seconds (candidate-dependent values).
Walkthrough
This part is about performing the timing correctly. For each disc you note the clock reading the moment the disc is dropped in (start time) and the moment it reaches the surface (end time). The time taken is the difference between them, converted to seconds if you used a clock face. You repeat with three fresh discs because a single reading could be unrepresentative — one disc might be slightly thicker or have more catalase. The mark scheme gives one mark for recording all three end times and one mark for all three times taken being correctly calculated from them, so arithmetic slips (e.g. forgetting to convert minutes to seconds) lose the second mark.
Key Takeaways
- Time taken = end time − start time, always in the unit the table asks for (seconds).
- Replicates are recorded individually, not just averaged.
Common Mistakes
- Recording only the mean and not all three individual times.
- Mixing units — writing some times in minutes and seconds and some in seconds only; the mark scheme for (a)(ii) explicitly rejects data entered as minutes.
- Stopping the watch at the wrong moment (when bubbles first appear rather than when the disc actually reaches the surface).
Things to Be Careful About
- Convert clock times to seconds consistently before subtracting.
- Use a FRESH disc each time — a used disc has had its surface altered and may behave differently.
Enter the times taken for the discs to reach the surface and the mean time in the table below.
| percentage concentration of hydrogen peroxide solution | time taken for potato disc to reach the surface of the hydrogen peroxide solution / seconds: disc 1 | time taken for potato disc to reach the surface of the hydrogen peroxide solution / seconds: disc 2 | time taken for potato disc to reach the surface of the hydrogen peroxide solution / seconds: disc 3 | time taken for potato disc to reach the surface of the hydrogen peroxide solution / seconds: mean |
|---|---|---|---|---|
| 1 | ||||
| 2 | ||||
| 3 |
-
Repeat this full procedure with three freshly cut discs of potato in hydrogen peroxide solution, recording your results and the mean in the table.
-
Repeat this full procedure with three freshly cut discs of potato in hydrogen peroxide solution, recording your results and the mean in the table.
Answer
| percentage concentration of hydrogen peroxide solution | disc 1 / seconds | disc 2 / seconds | disc 3 / seconds | mean / seconds |
|---|---|---|---|---|
| 1 | (candidate) | (candidate) | (candidate) | mean of the three |
| 2 | (candidate) | (candidate) | (candidate) | mean of the three |
| 3 | (candidate) | (candidate) | (candidate) | mean of the three |
All values entered in seconds only, all three discs per concentration recorded, and each mean correctly calculated as the sum of the three times divided by 3. The mean time for 3% should be less than the mean time for 1%.
Table completed with 9 individual times in seconds and 3 correctly calculated means, with the 3% mean shorter than the 1% mean (candidate-dependent values).
Walkthrough
The table is the record of the whole experiment. Four things earn the marks: (1) all nine individual times are entered — three discs at each of the three concentrations; (2) every value is in seconds, not minutes — the mark scheme explicitly rejects minutes; (3) each mean is correctly calculated; (4) the pattern makes sense — higher hydrogen peroxide concentration means more substrate, so oxygen is made faster and the disc floats sooner, so the 3% mean must be smaller than the 1% mean. If your means do not show this, check your arithmetic or your timing before moving on.
Key Takeaways
- A results table needs every replicate, not just the mean.
- Means are calculated from raw data and should be consistent with the expected trend.
Common Mistakes
- Entering times as '1 min 20 s' style mixed units — rejected.
- Averaging only two of the three discs.
- Leaving a concentration row blank.
Things to Be Careful About
- The unit is already in the column heading ('/ seconds'), so the cells contain numbers only.
- Calculate each mean to a consistent number of decimal places (or whole seconds) across the table.
Describe the effect of increasing the concentration of hydrogen peroxide solution on the time taken for the potato discs to reach the surface.
______
Answer
As the concentration of hydrogen peroxide solution increases, the time taken for the discs to reach the surface decreases (the reaction speeds up).
Time taken decreases as hydrogen peroxide concentration increases.
Walkthrough
This is a one-mark 'describe' — you only state what the data show, with no explanation. More concentrated hydrogen peroxide means more substrate molecules, so catalase produces oxygen faster, bubbles form sooner and the disc floats in less time. The mark scheme accepts any wording meaning 'time decreases / takes less time / speeds up'.
Key Takeaways
- 'Describe' = state the trend; 'explain' = add the reason. Here only the trend is needed.
Common Mistakes
- Adding an explanation about enzyme activity — unnecessary here, and it belongs in an 'explain' question.
- Saying 'the rate decreases' when it is the TIME that decreases (the rate increases).
Things to Be Careful About
- Keep the direction right: more concentration → less time.
Explain what you would do to make the mean results more reliable.
______
Answer
Use more discs at each concentration (repeat the readings more times) and calculate a new mean / average.
Use more discs / more repeats and calculate a mean.
Walkthrough
Reliability means the result would be similar if repeated. The standard way to improve it is to take more readings and average them, because random errors in individual timings partly cancel out. The mark scheme accepts 'use more discs / repeat + mean / average' — one mark for the whole idea.
Key Takeaways
- More repeats + a mean = more reliable results.
Common Mistakes
- Saying 'be more careful' or 'avoid human error' — vague answers that score nothing.
- Confusing reliability with accuracy (using more precise apparatus would address accuracy).
Things to Be Careful About
- Pair the improvement with what it achieves: more discs AND a mean, not just one of them.
Suggest two possible sources of error in the method used in this experiment. Explain why each could have affected the results.
source of error 1 = ______
explanation = ______
source of error 2 = ______
explanation = ______
Answer
Source of error 1: the discs are not all cut to exactly the same thickness / size / mass.
Explanation: a larger disc contains more catalase, so it produces oxygen faster, and a heavier disc needs more gas to lift it — so the floating times are not comparable.
Source of error 2: it is difficult to judge exactly when the disc reaches the surface / to stop the timer at the right moment.
Explanation: the end point is not clear, so the recorded times are not reliable.
(Other creditable pairs: temperature not controlled — rate of the enzyme reaction varies; discs cut from different parts of the tuber — enzyme content varies; hydrogen peroxide used up by earlier discs — concentration differs between replicates.)
Any two error–explanation pairs, e.g. discs not the same size (different amount of enzyme) and difficulty judging the end point (unreliable times).
Walkthrough
The mark scheme gives one mark per suggestion and one mark per matching explanation, and insists the two are related. Good pairs from the scheme's table:
- Discs not the same size/thickness/mass → different amount of enzyme, or a different mass needing a different volume of gas to float.
- Timing the end point is hard → times not reliable because the end point is not clear.
- Temperature not controlled → enzyme reaction rate varies with temperature.
- Discs from different parts of the tuber → enzyme content may vary.
- Hydrogen peroxide used up → concentration not the same for replicate discs.
Pick the two you can explain best. Each explanation must say HOW the error changes the result, not just that it 'affects accuracy'.
Key Takeaways
- A source of error is a specific feature of the method, not 'human error'.
- Every error must be paired with a mechanism linking it to the result.
Common Mistakes
- Writing 'human error' or 'to avoid mistakes' — explicitly rejected.
- Giving an error with no explanation, or an explanation that does not match the error named.
- Naming the same idea twice (e.g. 'discs different size' and 'discs different thickness' as two separate errors).
Things to Be Careful About
- The question asks for exactly two sources of error — give two, each with its explanation.
- Make the link explicit: error → mechanism → effect on the time recorded.
Observe the potato disc in the test-tube labelled .
start time ______
end time ______
Calculate how long the potato disc has been in the solution.
______
State and explain the position of the potato disc in the test-tube.
position = ______
explanation = ______
Answer
(calculated from the recorded clock times, in minutes)
Position: the disc stays at the bottom of the test-tube / does not move.
Explanation: there is no hydrogen peroxide (substrate) in the distilled water, so catalase has nothing to break down, no oxygen / bubbles are produced, and the disc cannot float.
Time = end time − start time in minutes; position = stays at the bottom; explanation = no hydrogen peroxide substrate, so no oxygen/bubbles produced.
Walkthrough
The 0% tube is the control of this experiment: it contains everything except the hydrogen peroxide. Subtracting the start time (noted at the beginning of the experiment) from the end time gives how long the disc has been in the water, converted to minutes. The disc stays on the bottom because floating depends on oxygen bubbles sticking to it; with no substrate there is no reaction, so no gas is made. This control proves it is the reaction between catalase and hydrogen peroxide — not the water or the potato alone — that makes discs float.
Key Takeaways
- A control omits the factor being tested (here the substrate) to show what happens without it.
- Bubbles of oxygen provide the lift; no reaction means no floating.
Common Mistakes
- Saying the disc floats slowly — it does not float at all.
- Explaining 'the water is not concentrated enough' — there is no hydrogen peroxide at all in 0%.
- Forgetting to convert the elapsed time into minutes as asked.
Things to Be Careful About
- The mark scheme joins the observation and its cause with '+': 'no H₂O₂ present + no bubbles/O₂ produced' — both halves are needed for the explanation mark.
- Give the elapsed time in minutes with the unit.
Describe in detail how you could show that it was an enzyme that caused bubbles to be produced when the potato discs were dropped into hydrogen peroxide solution.
Answer
- Boil a potato disc (or use boiled potato tissue) and place it in hydrogen peroxide solution of the same concentration and volume.
- Boiling denatures the enzyme (catalase), making it inactive.
- Use a fresh (unboiled) disc of the same size / thickness / surface area / mass in the same concentration and volume of hydrogen peroxide solution as a comparison.
- If no bubbles / no oxygen are produced with the boiled disc (while bubbles form with the fresh disc), the bubbling must have been caused by the enzyme.
Compare a boiled disc (denatured enzyme, no bubbles) with a fresh disc of the same size in the same hydrogen peroxide; absence of bubbling with the boiled disc shows the bubbles were caused by the enzyme.
Walkthrough
To show the bubbles are caused by an enzyme, you remove the enzyme's activity while keeping everything else the same, and show the bubbles disappear. Heating denatures catalase — the heat changes the shape of its active sites so it can no longer catalyse the breakdown of hydrogen peroxide. So: boil one disc, keep a fresh disc of identical size as the comparison, use the same concentration and volume of hydrogen peroxide in both, and observe. Bubbles with the fresh disc but none with the boiled disc shows the reaction depends on the active enzyme — therefore an enzyme caused the bubbling. The mark scheme lists five creditable points for three marks, so any three linked points score.
Key Takeaways
- Denaturing by boiling is the standard way to 'switch off' an enzyme in a control.
- A fair comparison needs the same disc size and the same substrate concentration and volume.
- The conclusion follows from the difference between test and control.
Common Mistakes
- Saying boiling 'kills' the potato — the point is that the enzyme is denatured.
- Forgetting to control disc size or hydrogen peroxide concentration — then the comparison is not fair.
- Describing only the boiled disc and never stating the expected result (no bubbles).
Things to Be Careful About
- The mark scheme's points are: boiled discs; enzyme denatured; same size/mass of discs; same concentration/volume of H₂O₂; no bubbles with the boiled disc. Cover at least three of these clearly.
A group of students decided to investigate the effect of increasing the concentration of catalase on the rate of oxygen production. They altered the concentration of the enzyme by using different numbers of thick potato discs.
They used the apparatus in the diagram below to collect the oxygen produced by different numbers of potato discs in of hydrogen peroxide solution. They recorded how long it took to produce of oxygen with each number of discs.
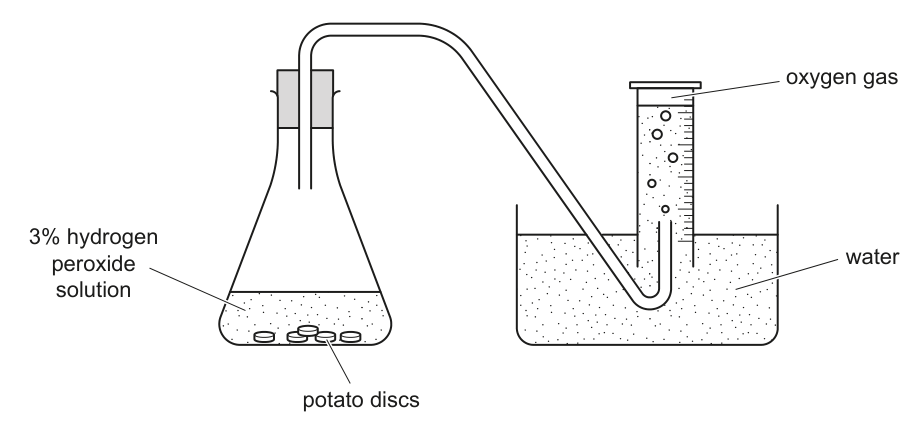
Their results are shown in the table below.
| number of potato discs | time to produce of oxygen / seconds |
|---|---|
| 1 | 110 |
| 2 | 46 |
| 3 | 32 |
| 4 | 30 |
| 5 | 30 |
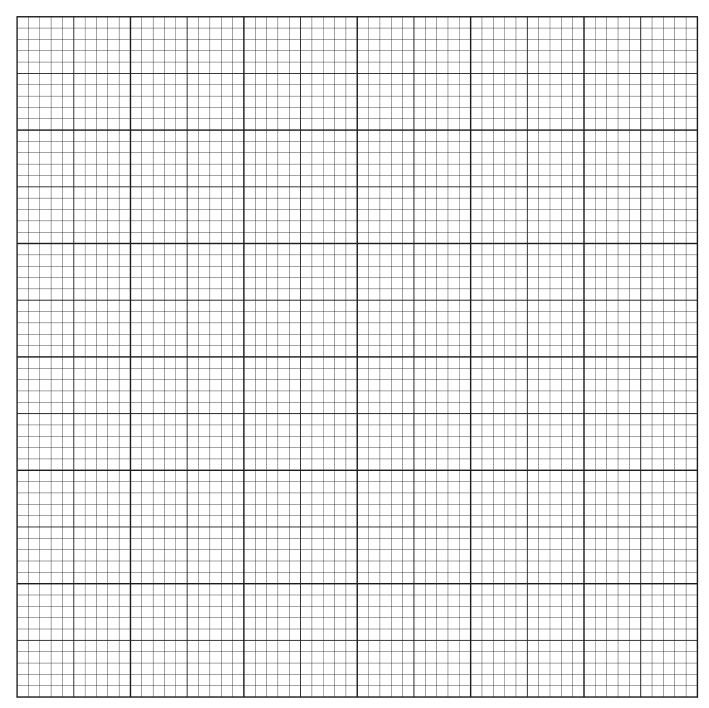
Construct a line graph of the data in the table on the grid below. Draw a smooth curve through your points.
Answer
- x-axis: number of potato discs (1–5); y-axis: time to produce of oxygen / seconds.
- Both axes fully labelled with the quantity and its unit.
- Continuous linear scales starting at 0, using more than half the grid in both directions (e.g. y-axis 0–120 seconds).
- All five points plotted accurately: (1, 110), (2, 46), (3, 32), (4, 30), (5, 30).
- A single smooth curve drawn through all the points, not extrapolated beyond them.
Line graph: number of discs on the x-axis, time / seconds on the y-axis, linear scales from 0 using over half the grid, five points accurately plotted, smooth curve through the points with no extrapolation.
Walkthrough
Graph construction is marked point by point. The independent variable (number of discs, what the students changed) goes on the x-axis; the dependent variable (time to produce of oxygen) goes on the y-axis — this alone is one mark, and full labelling with units is another. Scales must be linear and continuous (equal steps, no breaks) with a value at the origin, and must stretch over half the grid: with a maximum of 110 seconds, a y-axis to 120 in steps of 20 works well. Plot each of the five points to within half a small square. Finally join them with one smooth curve — the data fall steeply then level off, so a smooth falling curve fits; do not use a ruler point-to-point, and do not extend the curve past the last plotted point.
Key Takeaways
- Independent variable on x, dependent variable on y, both labelled with units.
- Linear scales from 0, using over half the grid.
- Smooth curve through the points; never extrapolate beyond the data.
Common Mistakes
- Swapping the axes.
- Omitting units ('seconds', 'number of discs') from the axis labels.
- Using an awkward scale (e.g. steps of 3) that makes plotting inaccurate.
- Joining points with a ruler or extending the line beyond 5 discs.
Things to Be Careful About
- The point (1, 110) is far from the others — make sure the scale accommodates it.
- The curve should flatten between 4 and 5 discs, not keep falling.
Describe the effect of increasing enzyme concentration on the rate of the reaction.
Answer
As the number of discs (enzyme concentration) increases, the time taken to produce of oxygen decreases — the rate of reaction increases / speeds up. From 4 to 5 discs the time stays constant — the rate levels off.
Rate increases (time decreases) as enzyme concentration increases, then levels off at 4–5 discs.
Walkthrough
Two marks: first the trend — more enzyme means the reaction goes faster, so less time is needed to collect of oxygen; second, the detail that between 4 and 5 discs the time does not change, so the rate has become constant. Remember that time and rate are inverses here: a shorter time means a faster rate.
Key Takeaways
- More enzyme → faster reaction, up to a point.
- A constant time means a constant (maximum) rate.
Common Mistakes
- Saying 'the rate decreases' because the numbers in the table get smaller — the numbers are TIMES, so the rate increases.
- Omitting the levelling-off, which is the second mark.
Things to Be Careful About
- The mark scheme accepts either 'time decreases' or 'rate increases' for the first mark — but not a confused mixture.
Suggest an explanation for the shape of the line between 4 and 5 discs of potato.
Answer
The enzyme is working as fast as it can (all the enzyme is being used) — the hydrogen peroxide is now the limiting factor, so adding more discs does not increase the rate.
The enzyme is working at its maximum; hydrogen peroxide is the limiting factor.
Walkthrough
Between 4 and 5 discs the line is flat: adding more catalase does not make the reaction faster. That happens when every enzyme active site is already working flat out — the enzyme is at its maximum rate — because there is not enough hydrogen peroxide (substrate) to go round. The substrate has become the limiting factor: it is the thing in shortest supply that caps the rate. This is the standard 5090 explanation of a plateau on an enzyme concentration graph.
Key Takeaways
- A plateau on an enzyme-concentration graph means substrate is limiting.
- The limiting factor is the variable that, if increased, would raise the rate.
Common Mistakes
- Saying 'the enzyme is used up' — enzymes are not consumed by the reaction.
- Saying 'the enzyme denatured' — nothing here changes temperature or pH.
Things to Be Careful About
- The mark scheme accepts either 'enzyme working as fast as it can / maximum' or 'hydrogen peroxide is limiting factor' — give the version that links the flat line to the substrate supply.
The rest of this paper
1 more questions- Q2Experimental Contexts · Microscopy and Biological Drawing14M