Biology 5090/31 — October/November 2019
Cambridge O-Level · Practical Test · worked solutions for every part, with the mark scheme
Topics Observations and Measurements · Experimental Contexts · Analysis, Conclusions and Evaluation · Use of Techniques, Apparatus and Materials · Planning Experiments and Investigations · Microscopy and Biological Drawing
Aquatic plants live in water and exchange gases with the water around them.
When water absorbs carbon dioxide it becomes more acidic.
Hydrogencarbonate indicator (bicarbonate indicator) can be used to detect changes in the amount of carbon dioxide dissolved in water. It changes colour as follows:
| high concentration of carbon dioxide | atmospheric concentration of carbon dioxide | low concentration of carbon dioxide |
|---|---|---|
| yellow | red | purple |
You will be investigating gas exchange by two pieces of an aquatic plant using hydrogencarbonate indicator.
Air has been bubbled through the indicator so that it has the same level of dissolved carbon dioxide as the atmosphere.
- Place one piece of plant in a test-tube and carefully push it down so that one end touches the bottom of the test-tube as shown in the diagram below.
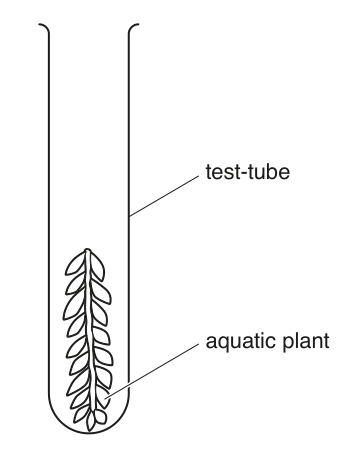
- Label this test-tube A.
- Use a measuring cylinder to add hydrogencarbonate indicator so that the plant is just covered by the indicator.
Record the volume of indicator that you added.
______
- Place the second piece of plant in another test-tube and carefully push it down so that one end touches the bottom of the test-tube.
- Label this test-tube B.
- Add the same volume of indicator that you added to test-tube A, ensuring that it covers the plant.
- Place a bung in the top of both test-tubes.
- Wrap aluminium foil around test-tube B to prevent any light entering.
- Place both test-tubes together in a well-lit position and note the time.
time ______
Leave the test-tubes for 35 minutes.
During this time continue with question 1(a)(ii), 1(b) and questions 2 and 3.
Answer questions 1(a)(iii), (iv) and (v) after 35 minutes.
Label three test-tubes C, D and E.
- Add of hydrogencarbonate indicator to each test-tube.
- Add one drop of dilute hydrochloric acid () to the test-tube labelled C.
- Add one drop of dilute sodium hydroxide () to the test-tube labelled E.
- Do not add anything to the test-tube labelled D.
Record the colour of the indicator in the table below.
| colour of hydrogencarbonate indicator | ||
|---|---|---|
| test-tube C | test-tube D | test-tube E |
Answer the remaining parts of 1(a) after test-tubes A and B have been in a well-lit position for 35 minutes.
- After 35 minutes remove the foil from test-tube B and answer questions (a)(iii), (iv) and (v) below.
Record the colour of the indicator in each test-tube.
| colour of hydrogencarbonate indicator | |
|---|---|
| test-tube A | |
| test-tube B |
Describe what has happened to the concentration of carbon dioxide in test-tubes A and B.
test-tube A = ______
test-tube B = ______
Suggest an explanation for the colour changes observed.
test-tube A = ______
test-tube B = ______
Some students investigated the effect of light intensity on the rate of photosynthesis. A piece of the stem of the aquatic plant was placed in a beaker with the cut end uppermost and covered with water.
In a dark room, a lamp was used to shine light on it.
Bubbles of gas were seen coming out of the cut end of the stem as the plant photosynthesised.
The apparatus is shown in the diagram below.
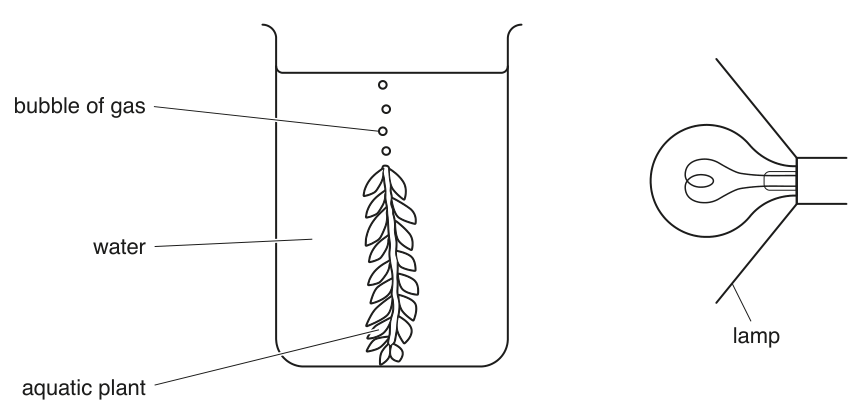
They left the plant for five minutes. After five minutes they counted the number of bubbles of gas given off in one minute.
They varied the light intensity by moving the lamp to different distances from the plant, and repeated the process.
State one factor that the students should control in this investigation. Explain how the students could control this factor.
factor = ______
explanation = ______
Explain how the students could ensure that the result for each light intensity was reliable.
______
The results of the students' investigation are shown in the table below.
| light intensity / arbitrary units | rate of photosynthesis / bubbles per minute |
|---|---|
| 4 | 6 |
| 7 | 10 |
| 11 | 14 |
| 16 | 16 |
| 28 | 18 |
| 50 | 19 |
Construct a line graph of the data in the table on the grid below. Join your plotted points with a smooth curve.

Use your graph to find the rate of photosynthesis at a light intensity of 20 arbitrary units.
Show your working on your graph.
______ bubbles per minute
Describe the effect of increasing light intensity on the rate of photosynthesis in this investigation.
______
Suggest an explanation for the shape of the graph above a light intensity of 28 arbitrary units.
______
The rest of this paper
2 more questions- Q2Microscopy and Biological Drawing · Experimental Contexts · Observations and Measurements9M
- Q3Analysis, Conclusions and Evaluation · Observations and Measurements · Experimental Contexts6M