Biology 5090/61 — May/June 2019
Cambridge O-Level · Alternative to Practical · worked solutions for every part, with the mark scheme
Topics Experimental Contexts · Planning Experiments and Investigations · Analysis, Conclusions and Evaluation · Use of Techniques, Apparatus and Materials · Observations and Measurements · Microscopy and Biological Drawing
A student wanted to investigate the digestion of fat in the human alimentary canal.
He used some white milk as the source of fat, an enzyme solution, an indicator solution, some bile salt solution and water.
The indicator he used is pink in alkaline conditions and colourless in acidic conditions.
The enzyme digests the fat in the milk to give fatty acids and glycerol.
Suggest which enzyme he used in this investigation.
______
He set up 3 test-tubes, A, B, and C.
He added of milk and 5 drops of indicator solution to each test-tube.
He placed the 3 test-tubes in a water bath for 5 minutes.
After 5 minutes, of enzyme solution was added to each of test-tubes A and B. of water was added to test-tube C.
bile salt solution was added to test-tube B and water to each of test-tubes A and C.
The diagram shows the contents of each test-tube.
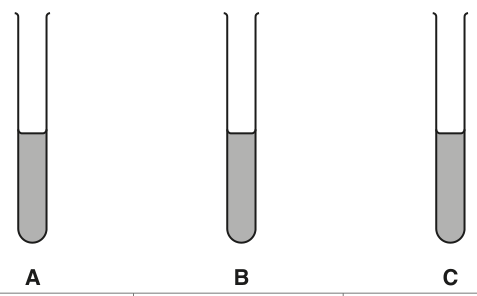
| A | B | C |
|---|---|---|
| milk | milk | milk |
| indicator | indicator | indicator |
| enzyme | enzyme | water |
| water | bile salts | water |
He then placed the 3 test-tubes in the same water bath again and observed them every minute for 5 minutes.
Name a suitable piece of apparatus for the student to use to measure the milk.
______
Name a suitable piece of apparatus for the student to use to add the indicator solution.
______
Suggest a suitable temperature for the water bath ______
Suggest why the test-tubes containing milk and indicator solution were placed in a water bath for 5 minutes before any other contents were added.
______
Explain why water was added to test-tubes A and C.
______
When the indicator solution was first added, the contents of all three test-tubes turned pink.
At 3 minutes, the contents of test-tube B had turned white.
At 5 minutes, the contents of test-tube A had turned white.
At 5 minutes, the contents of test-tube C were still pink.
Complete the table below, including the column heading, to show these results.
| ______ | colour observed: test-tube A | colour observed: test-tube B | colour observed: test-tube C |
|---|---|---|---|
| 0 | pink | ||
| 1 | pink | ||
| 2 | pink | ||
| 3 | pink | ||
| 4 | pink | ||
| 5 | pink |
Suggest what caused the indicator solution to change colour in test-tubes A and B.
______
Describe and explain what the student could conclude about the digestion of fat in each test-tube.
A ______
B ______
C ______
Design an investigation based on the contents of test-tube A to find the effect of pH on the action of this enzyme.
State and explain one safety precaution that should be taken when carrying out this investigation.
safety precaution = ______
explanation = ______
The rest of this paper
1 more questions- Q2Microscopy and Biological Drawing · Experimental Contexts · Analysis, Conclusions and Evaluation · Planning Experiments and Investigations17M