Biology 5090/61 — October/November 2017
Cambridge O-Level · Alternative to Practical · worked solutions for every part, with the mark scheme
Topics Experimental Contexts · Observations and Measurements · Planning Experiments and Investigations · Use of Techniques, Apparatus and Materials · Analysis, Conclusions and Evaluation · Microscopy and Biological Drawing
Dried yeast may be activated by adding it to a solution containing a sugar. When yeast is active, bubbles are produced which form froth on the surface of the mixture. The greater the activity of the yeast, the more froth is produced.
Some students investigated whether yeast is active in solutions of different sugars.
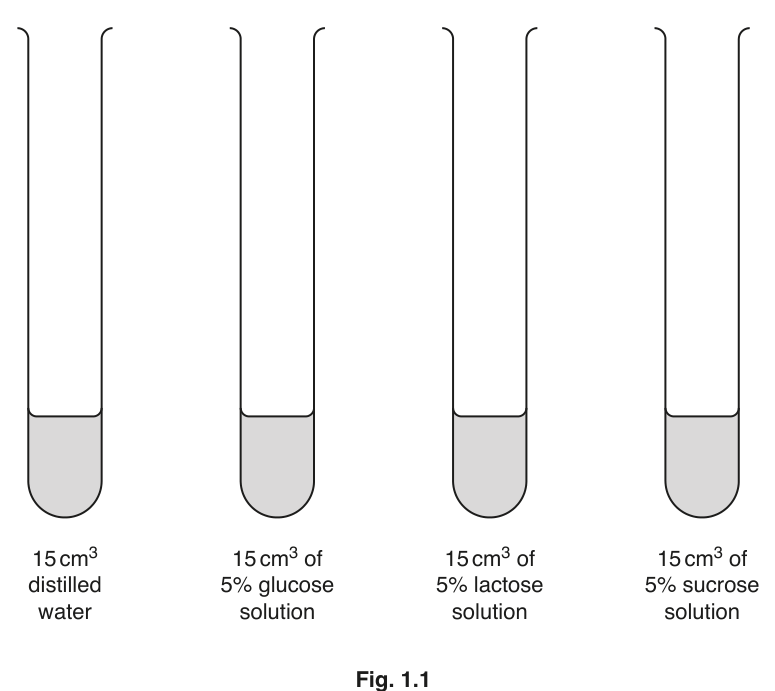
Four test-tubes were set up as shown in Fig. 1.1.
- A large beaker was set up as a water bath with the water at . This temperature was maintained throughout the investigation.
- The four labelled test-tubes as in Fig. 1.1 were placed in the water bath and left for 5 minutes.
- of dried yeast was then added to each test-tube and the mixtures were stirred vigorously. The test-tubes were left in the water bath.
- Five minutes after adding the yeast, the height of the froth produced above the yeast mixture in each test-tube was measured and recorded in Table 1.1.
- The test-tubes were left in the water bath for another 5 minutes. Fig. 1.2 shows their appearance 10 minutes after adding the yeast.
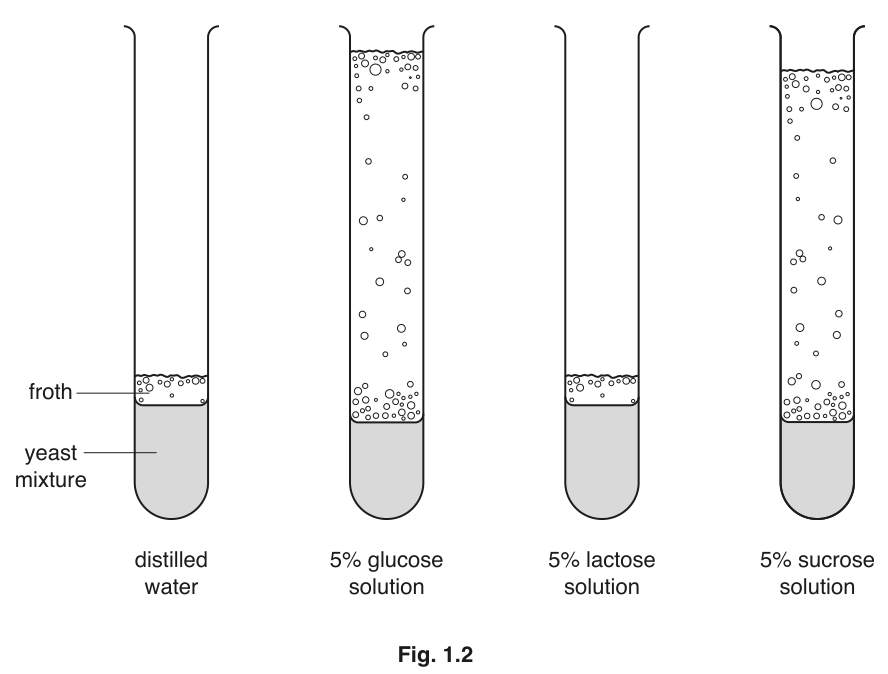
On Fig. 1.2 measure the height of the froth in each test-tube and record your results in Table 1.1. The value for glucose has already been entered.
Table 1.1
| Solution | Height of froth / | |
|---|---|---|
| After 5 minutes | After 10 minutes | |
| Distilled water | 5 | ______ |
| 5% glucose solution | 25 | 65 |
| 5% lactose solution | 5 | ______ |
| 5% sucrose solution | 22 | ______ |
Calculate the increase in the height of froth produced using glucose solution between 5 and 10 minutes.
______
Construct a bar chart to show the height of froth produced in each of the 4 test-tubes after 10 minutes.

Describe what you can conclude about the activity of yeast from your results.
State the name of the process taking place when yeast produces bubbles which form froth.
______
State the name of the gas that was produced to make the froth above the yeast mixture.
______
Explain why the test-tubes in Fig. 1.1 were placed in the water bath for 5 minutes before the yeast was added.
Explain how the students could have ensured that the temperature of the water bath remained at during the investigation.
Explain why the test-tube with yeast and distilled water was used in the investigation.
Suggest why yeast is less active with some sugars than with others.
The results of this investigation may not be reliable. Describe what you could do to make them more reliable and explain why the results would be more reliable.
The rest of this paper
2 more questions- Q2Experimental Contexts · Planning Experiments and Investigations10M
- Q3Experimental Contexts · Microscopy and Biological Drawing · Observations and Measurements · Use of Techniques, Apparatus and Materials12M