Biology 5090/62 — May/June 2017
Cambridge O-Level · Alternative to Practical · worked solutions for every part, with the mark scheme
Topics Experimental Contexts · Analysis, Conclusions and Evaluation · Use of Techniques, Apparatus and Materials · Observations and Measurements · Planning Experiments and Investigations · Microscopy and Biological Drawing
Some students investigated the effect of different concentrations of sucrose solution on potato tissue.
Four strips of potato A, B, C and D, were cut. Each strip measured . The mass of each strip was measured and recorded in Table 1.1.
One strip of potato was placed in each of four sucrose solutions of different concentrations:
The same volume of sucrose solution was used for each strip.
The strips were left for 30 minutes. After 30 minutes, the strips were removed from the sucrose solutions and carefully blotted dry. The mass of each strip was then measured again and recorded in Table 1.1.
Table 1.1
| potato strip | concentration of sucrose solution / | mass of potato strip at start / | mass of potato strip after 30 minutes / | change in mass / |
|---|---|---|---|---|
| A | 0.2 | 4.0 | 4.3 | |
| B | 0.4 | 4.0 | 4.1 | |
| C | 0.6 | 4.0 | 3.8 | |
| D | 0.8 | 4.0 | 3.6 |
Complete Table 1.1 by calculating the change in mass for each potato strip.
Answer
| potato strip | change in mass / |
|---|---|
| A | +0.3 |
| B | +0.1 |
| C | |
| D |
A +0.3 g, B +0.1 g, C −0.2 g, D −0.4 g
Walkthrough
The change in mass is the final mass minus the starting mass for each strip. Strip A: 4.3 − 4.0 = +0.3 g. Strip B: 4.1 − 4.0 = +0.1 g. Strip C: 3.8 − 4.0 = −0.2 g. Strip D: 3.6 − 4.0 = −0.4 g. The sign matters: strips C and D lost mass, so the change is negative. The mark scheme gives 2 marks for all four correct values and 1 mark for three correct, and it awards a separate mark for using negative signs (or the word 'decrease') for C and D only — a positive 0.2 for C loses that mark.
Key Takeaways
- Change = final value − initial value, and a decrease must be shown as a negative number.
- Units in the table header mean units are not needed in the cells (the scheme ignores them if included).
Common Mistakes
- Writing 0.2 instead of −0.2 for C and D, losing the sign mark.
- Subtracting the wrong way round (start − final), which flips all the signs.
- Worrying about units in the cells — the scheme says 'Ig units included in table', so they neither gain nor lose a mark.
Things to Be Careful About
- The mark scheme scores arithmetically: 4 correct = 2 marks, 3 correct = 1 mark, 2 or fewer = 0. Check all four subtractions before moving on.
- The negative-sign mark is for C and D ONLY — do not write +0.3 as 'increase' and −0.2 as 'decrease' inconsistently; keep the signs uniform.
Suggest explanations for the results for strip A and strip D.
Answer
- Water moved by osmosis into strip A, because the water potential of the 0.2 mol per dm sucrose solution was higher than that of the potato cells, so the strip gained mass.
- Water moved by osmosis out of strip D, because the water potential of the 0.8 mol per dm sucrose solution was lower than that of the potato cells, so the strip lost mass.
Water enters A and leaves D by osmosis, down the water potential gradient in each case
Walkthrough
The key idea is that water moves through the partially permeable cell membranes by osmosis, from a region of higher water potential to a region of lower water potential. Strip A sat in the most dilute sucrose solution (0.2 mol per dm). Dilute solutions have a high water potential — more free water molecules — so water passed from the solution into the potato cells and the strip gained 0.3 g. Strip D sat in the most concentrated solution (0.8 mol per dm). Concentrated solutions have a low water potential, so water passed out of the potato cells into the solution and the strip lost 0.4 g. The mark scheme wants four points: reference to movement of water; the word osmosis; water into A; water out of D. Each strip needs its own direction of water movement.
Key Takeaways
- Osmosis is the movement of water from a higher water potential to a lower water potential through a partially permeable membrane.
- The more concentrated the sucrose solution, the lower its water potential, and the more water leaves the potato.
Common Mistakes
- The scheme says 'Ig diffusion' — mentioning diffusion is ignored, but the credited word is osmosis.
- The scheme says 'R If osmosis and active transport in same answer' — do not mention active transport at all; water moves passively here.
- Explaining only one strip — the question asks for both A and D, and each direction of water movement is a separate mark.
- Saying 'water moves to the more concentrated solution' without naming osmosis or the water movement explicitly.
Things to Be Careful About
- The precise term is osmosis and the direction is stated relative to water potential, not just 'concentration'. Using 'water potential' makes the explanation airtight.
- Give the observation (gained/lost mass) AND the reason (direction of osmosis) for each strip.
Suggest why each strip was blotted dry after being removed from the sucrose solution.
Answer
To remove the surface (excess) sucrose solution, so that only the mass of the potato strip is measured and the excess solution is not included in the mass.
To remove surface solution so only the strip's own mass is measured
Walkthrough
When a strip is lifted out of the beaker, a film of sucrose solution clings to its surface. If that film is weighed along with the strip, the recorded mass includes solution that was never part of the potato tissue. Blotting with filter paper removes this surface liquid so the balance reads only the mass of the strip itself, making the change-in-mass calculation accurate. The mark scheme accepts 'water' as well as 'solution'.
Key Takeaways
- Blotting dry is a standard technique before re-weighing tissue from a liquid.
- The reason is always about not measuring extra liquid, not about the osmosis itself.
Common Mistakes
- Saying 'to stop osmosis' — blotting does not stop osmosis; it removes surface liquid.
- Giving only half the answer: 'to remove solution' without saying why (so the mass measured is only the strip).
Things to Be Careful About
- This is a 1-mark 'suggest' question — one complete sentence covering both the action and its purpose is enough.
Explain why all the strips were cut to the same size () at the start of this investigation.
Answer
- So that the concentration of the sucrose solution is the only variable — size (and surface area in contact with the solution) is controlled.
- This makes the comparison between the strips valid.
To control size/surface area so concentration is the only variable, making the comparison valid
Walkthrough
In a fair test only the independent variable — here the sucrose concentration — may change. If the strips had different sizes, a bigger strip would have more cells and more surface area, so it could take up or lose more water in total regardless of the concentration. Any difference in mass change could then be due to size rather than concentration. Cutting all strips to 80 mm × 4 mm × 4 mm keeps the surface area in contact with the solution the same, so the only factor affecting the mass change is the concentration. That makes the comparison valid.
Key Takeaways
- A valid investigation changes only the independent variable; everything else is controlled.
- Surface area affects the rate and total amount of osmosis, so it must be controlled.
Common Mistakes
- Saying only 'to make it a fair test' without naming what is controlled (size / surface area) or what the variable is (concentration).
- Saying 'so they all have the same mass' — the starting masses were the same, but the reason is about surface area and the single variable, not mass itself.
Things to Be Careful About
- The mark scheme offers three points and needs two: the single-variable point and the validity point are the safest pair; 'same surface area in contact with the solution' can substitute for either.
You are given of a sucrose solution containing .
Describe how you would use this solution to prepare of sucrose solution.
Answer
Add of water to the of sucrose solution, making the volume up to .
Add 50 cm³ of water to the 50 cm³ of 0.8 mol per dm³ solution
Walkthrough
To go from 0.8 mol per dm to 0.4 mol per dm the concentration must be halved. Doubling the volume with water (adding an equal volume, 50 cm) halves the concentration while giving the required final volume of 100 cm. The mark scheme accepts 'add 50 cm water', 'add an equal volume of water' or 'make the volume up to 100 cm with water' — any one of these scores.
Key Takeaways
- Dilution: , so .
- Adding an equal volume of water always halves the concentration.
Common Mistakes
- Adding 100 cm of water (final volume 150 cm, concentration 0.27).
- Adding only a small volume of water and not stating the final volume.
Things to Be Careful About
- The answer must state the volume of water added (50 cm, equal to the starting volume) or the final volume made up to (100 cm) — a vague 'add some water' does not score.
When plant cells lose water, the cytoplasm may shrink and move away from the cell wall. When this happens, the cells are plasmolysed.
Fig. 1.1 represents a group of plant cells, some of which are plasmolysed.
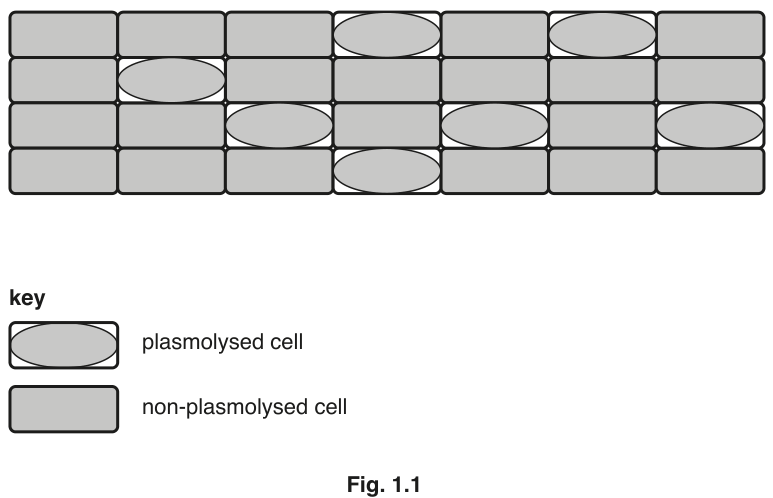
Complete Table 1.2 by counting the number of plasmolysed cells and the number of non-plasmolysed cells.
Table 1.2
| number of plasmolysed cells | number of non-plasmolysed cells |
|---|
Answer
| number of plasmolysed cells | number of non-plasmolysed cells |
|---|---|
| 7 | 21 |
7 plasmolysed, 21 non-plasmolysed
Walkthrough
Using the key, a plasmolysed cell is drawn as a rectangle with a shrunken oval inside it (the cytoplasm pulled away from the cell wall), and a non-plasmolysed cell is a plain shaded rectangle. Counting the oval-containing cells in Fig. 1.1 gives 7; the remaining cells of the 28 total are non-plasmolysed: 28 − 7 = 21.
Key Takeaways
- Always use the printed key to classify before counting.
- The total (28) provides a check: the two counts must add to it.
Common Mistakes
- Misreading the key and counting the plain rectangles as plasmolysed.
- Counting a cell twice or missing one in a row.
Things to Be Careful About
- Check that your two counts add up to the total number of cells in the figure — this catches most counting slips.
Calculate the number of plasmolysed cells as a percentage of the total number of cells.
Show your working.
______ %
Working
Total number of cells = 7 + 21 = 28
Answer
25.0 %
25.0 %
Walkthrough
First find the total number of cells: 7 plasmolysed + 21 non-plasmolysed = 28. Then the percentage of plasmolysed cells is the number plasmolysed divided by the total, multiplied by 100: (7 ÷ 28) × 100 = 25.0%. The mark scheme awards both marks for the correct answer even without working, but if the answer is wrong, one mark is available for correct working — so always show the substitution.
Key Takeaways
- Percentage = (part ÷ whole) × 100.
- Showing working protects a mark even if the arithmetic slips.
Common Mistakes
- Dividing by 21 (the non-plasmolysed count) instead of the total 28.
- Forgetting to multiply by 100, giving 0.25.
Things to Be Careful About
- The question prints the answer blank with a % sign, so the number alone (25.0) is what goes on the line — do not write 25.0% into the blank after the printed % sign.
A student carried out an investigation into the relationship between the concentration of sucrose solution and the number of plant cells which were plasmolysed.
She placed small pieces of plant tissue in sucrose solutions and counted the number of cells that were plasmolysed. She then calculated the percentage of cells that were plasmolysed in each solution.
Her results are shown in Table 1.3.
Table 1.3
| concentration of sucrose solution / | percentage of cells that were plasmolysed |
|---|---|
| 0.0 | 0 |
| 0.2 | 5 |
| 0.4 | 18 |
| 0.6 | 75 |
| 0.8 | 100 |
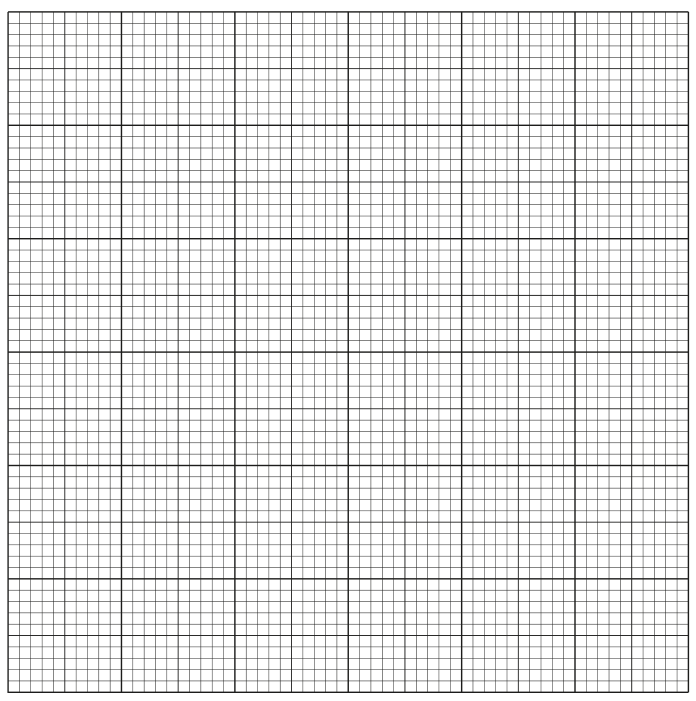
Plot a line graph of the results in Table 1.3. Join the points on your graph with ruled, straight lines.
Answer
- x-axis: 'concentration of sucrose solution / mol per dm'; y-axis: 'percentage of plasmolysed cells'.
- Linear scales with 0 at the origin, using at least half the grid in both directions.
- All five points plotted correctly: (0.0, 0), (0.2, 5), (0.4, 18), (0.6, 75), (0.8, 100).
- Points joined with ruled straight lines; no extrapolation beyond 0.8 / 100.
Line graph with fully labelled axes, linear scales from 0, all five points plotted, joined by ruled straight lines and not extrapolated
Walkthrough
The graph has four mark points. First, both axes must be fully labelled with the quantity AND its unit: 'concentration of sucrose solution / mol per dm' on the x-axis and 'percentage of plasmolysed cells' on the y-axis — the slash-unit format is what 5090 expects. Second, the scales must be linear (equal steps per square), start at 0 at the origin, and use at least half the grid in each direction: concentration 0 to 0.8 and percentage 0 to 100 both fit comfortably. Third, all five points from Table 1.3 must be plotted accurately — within half a small square. Fourth, the points are joined with ruled straight lines (a smooth curve is not asked for here) and the line must STOP at the last point (0.8, 100); extending it beyond the data is extrapolation and loses the mark.
Key Takeaways
- Every graph axis label needs the quantity and its unit in slash form.
- Linear scales, 0 at the origin, at least half the grid used.
- Never extrapolate a line beyond the plotted data.
Common Mistakes
- Omitting the unit 'mol per dm' from the x-axis label.
- Swapping the axes (percentage on x, concentration on y).
- Using a non-linear scale (e.g. 0, 0.2, 0.4, 0.6, 0.8 spaced equally but with unequal gaps between values) or not starting at 0.
- Drawing a smooth curve when ruled straight lines are asked for.
- Extrapolating the line back to below 0 or beyond 0.8.
Things to Be Careful About
- Plot each point to within half a small square of its true position.
- The instruction says 'ruled, straight lines' — use a ruler between consecutive points.
Use your graph to find the concentration of sucrose solution in which 50% of the cells would be plasmolysed. On your graph, show how you obtained this value.
Concentration of sucrose solution in which 50% of the cells would be plasmolysed: = ______
Answer
Draw a horizontal ruled line from 50% on the y-axis to the plotted line, then a vertical ruled line down to the x-axis.
Concentration of sucrose solution in which 50% of the cells would be plasmolysed = 0.5 mol per dm
0.5 mol per dm³ (read from the candidate's own graph, tolerance ± half a small square)
Walkthrough
To find the concentration at which 50% of cells are plasmolysed, start at 50 on the y-axis, draw a horizontal ruled line across to the plotted line, then drop a vertical ruled line from that intersection down to the x-axis and read off the concentration. The plotted line passes through 50% at about 0.5 mol per dm (the line rises from 18% at 0.4 to 75% at 0.6, crossing 50% roughly midway). The mark scheme awards one mark for the construction lines shown on the graph and one mark for the value read correctly from the candidate's own working, with a tolerance of ± half a small square — so the exact value depends on the candidate's graph, and the unit 'mol per dm' must be given.
Key Takeaways
- Interpolation: read between plotted points using ruled construction lines.
- The mark scheme credits a reading from the candidate's own graph, so accurate plotting in (c)(i) protects this mark too.
Common Mistakes
- Reading the value without drawing the construction lines — the working mark is lost.
- Giving the value without the unit.
- Extrapolating instead of interpolating, or reading from the wrong axis.
Things to Be Careful About
- The accepted value has a tolerance of ± half a small square around 0.5 mol per dm, judged against your own plotted line.
- Both construction lines (horizontal from 50%, vertical down to the x-axis) should be ruled and visible.
The rest of this paper
2 more questions- Q2Experimental Contexts · Use of Techniques, Apparatus and Materials · Analysis, Conclusions and Evaluation10M
- Q3Microscopy and Biological Drawing · Experimental Contexts · Analysis, Conclusions and Evaluation10M