Biology 5090/61 — May/June 2017
Cambridge O-Level · Alternative to Practical · worked solutions for every part, with the mark scheme
Topics Experimental Contexts · Analysis, Conclusions and Evaluation · Microscopy and Biological Drawing · Planning Experiments and Investigations · Use of Techniques, Apparatus and Materials
Catalase is an enzyme found in many tissues. Catalase breaks down hydrogen peroxide, forming water and oxygen.
Fig. 1.1 shows the apparatus used by a student to investigate the effect of pH on the activity of catalase. The gas syringe was used to measure the volume of oxygen produced at each pH.
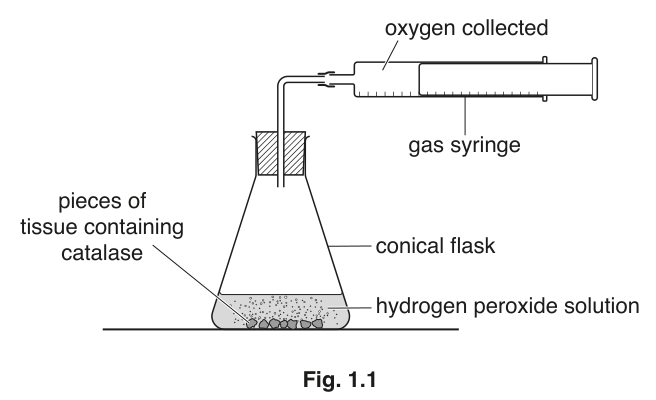
The student carried out the experiment at a pH of 7.0 and measured the volume of oxygen produced during a period of five minutes.
He then mixed fresh samples of tissue containing catalase, and hydrogen peroxide solution at pH values of 5.0, 6.0, 8.0 and 9.0 and measured the volume of oxygen produced during five minutes for each pH.
The results are shown in Table 1.1.
Table 1.1
| pH | volume of oxygen produced during five minutes / |
|---|---|
| 5.0 | 12 |
| 6.0 | 45 |
| 7.0 | 88 |
| 8.0 | 57 |
| 9.0 | 8 |
Using the data in Table 1.1, plot a line graph to show the effect of pH on the activity of catalase.
Join the points on your graph with ruled, straight lines.

Answer
To construct the graph correctly:
- x-axis: Label as
pH. Use a linear scale from 5.0 to 9.0 (e.g., 1 cm represents 1 pH unit). - y-axis: Label as
volume of oxygen produced during five minutes / cm^3. Use a linear scale from 0 to 100 or 120 (e.g., 1 cm represents 10 or 20 cm^3). - Plotting: Plot the five points exactly: (5.0, 12), (6.0, 45), (7.0, 88), (8.0, 57), (9.0, 8).
- Line: Join the plotted points with ruled, straight lines. Do not extrapolate the lines beyond the first and last data points.
Graph of volume of oxygen against pH, peaking at pH 7.0 with 88 cm^3.
Walkthrough
The question asks you to plot a line graph from the provided table and join the points with ruled, straight lines. This tests your ability to present data graphically according to 5090 conventions.
- Axes and labels: The independent variable (pH) goes on the x-axis. The dependent variable (volume of oxygen produced during five minutes) goes on the y-axis. Both must be fully labelled, including units where appropriate. The y-axis label can be shortened to
volume of oxygen / cm^3. - Scales: Both axes must have a linear scale. The x-axis ranges from 5.0 to 9.0 (a range of 4 units). The y-axis ranges from 8 to 88 (a range of 80 units). Choose a scale that uses at least half the grid in both directions. For example, x-axis: 1 major division = 1 pH unit; y-axis: 1 major division = 10 cm^3.
- Plotting: Plot each pair of coordinates carefully. Ensure the points are clearly marked (e.g., with a small cross or dot) and are within half a small square of the correct position.
- Line: The instruction specifically says to join the points with ruled, straight lines. This means draw a straight line from each point to the next. Do not draw a smooth curve, and do not extrapolate the lines beyond the data at pH 5.0 and pH 9.0.
Key Takeaways
- Always place the independent variable on the x-axis and the dependent variable on the y-axis.
- Include units in axis labels (e.g.,
pH,volume of oxygen / cm^3). - When asked for a line graph with "ruled, straight lines", draw straight segments between points; do not smooth the curve and do not extrapolate.
Common Mistakes
- Wrong axis orientation: Putting pH on the y-axis and volume on the x-axis.
- Missing units: Forgetting to include
/ cm^3in the y-axis label. - Non-linear scale: Using a logarithmic or irregular scale.
- Smooth curve: Drawing a smooth curve through the points instead of ruled straight lines, or extrapolating the lines beyond the plotted data.
- Misplotting: Reading the graph axes incorrectly when placing the points.
Things to Be Careful About
- Read the exact instruction: "Join the points on your graph with ruled, straight lines." This explicitly forbids a smooth curve and extrapolation.
- Ensure the scale allows you to plot all values accurately. If the y-axis only goes to 80, you cannot plot the 88 value at pH 7.0.
- Use a sharp pencil for neat plotting.
Using the information in Table 1.1 and your graph, describe the effect of pH on the activity of catalase.
Answer
- The activity of catalase (volume of oxygen produced) increases as the pH increases from 5.0 to 7.0.
- It reaches a peak (optimum) at pH 7.0 (neutral), producing 88 cm^3 of oxygen.
- The activity then decreases as the pH increases from 7.0 to 9.0.
Activity increases to a peak at pH 7.0, then decreases.
Walkthrough
The question asks you to describe the effect of pH on enzyme activity using the table and graph. This is a standard description of an enzyme optimum curve.
- Initial trend: Look at the data from pH 5.0 to 7.0. The volume of oxygen goes from 12 to 45 to 88. State that activity increases as pH increases (or as pH moves towards 7.0).
- Optimum: Identify the highest value. It is 88 cm^3 at pH 7.0. State that it reaches a peak or optimum at pH 7.0. Note that pH 7.0 is neutral.
- Subsequent trend: Look at the data from pH 7.0 to 9.0. The volume drops to 57 then to 8. State that the activity decreases as pH increases beyond 7.0.
Key Takeaways
- When describing an enzyme optimum curve, always mention the direction of change before the optimum, the location of the optimum, and the direction of change after the optimum.
- Use the specific values from the data to support your description (e.g., "peaks at pH 7.0").
Common Mistakes
- Vague description: Saying "it goes up and then down" without specifying the pH values or the direction of change relative to the optimum.
- Missing the peak: Forgetting to state that there is a peak or optimum at pH 7.0.
- Confusing correlation with causation: Saying "pH causes the activity to increase" instead of "activity increases as pH increases".
Things to Be Careful About
- The mark scheme awards marks for "activity / volume of oxygen produced increases", "reaches a peak at pH7", and "then decreases". Ensure all three elements are present.
- "Neutral" is an acceptable alternative for "pH 7.0" in the explanation, but it is safer to use the exact value from the table.
State two variables, other than temperature, that should have been kept constant in this investigation.
- ______
- ______
Answer
- Concentration of hydrogen peroxide
- Mass (or volume / surface area) of tissue
(Any two of: concentration of hydrogen peroxide, volume of hydrogen peroxide, mass of tissue, surface area of tissue)
Concentration of hydrogen peroxide and mass of tissue.
Walkthrough
The investigation is looking at the effect of pH (independent variable) on the rate of catalase activity (dependent variable). To ensure a fair test, all other variables that could affect the rate of reaction must be kept constant (controlled variables).
- Substrate variables: The concentration and volume of hydrogen peroxide must be the same, otherwise the amount of oxygen produced or the rate would change due to substrate availability, not pH.
- Enzyme variables: The amount of catalase must be the same. This can be controlled by using the same mass, volume, or surface area of the tissue. Using fresh samples ensures the enzyme is not denatured or degraded from previous trials.
Key Takeaways
- In enzyme investigations, controlled variables typically include substrate concentration/volume, enzyme amount (mass/volume/surface area), and time allowed for the reaction.
- Temperature is already excluded by the question, so focus on substrate and enzyme quantities.
Common Mistakes
- Naming the independent variable: Stating "pH" as a variable to keep constant (it is the one being changed).
- Naming the dependent variable: Stating "volume of oxygen" (it is being measured).
- Vague answers: Saying "the same conditions" without specifying what those conditions are.
Things to Be Careful About
- The question explicitly says "other than temperature", so do not include temperature.
- "Surface area of tissue" is a valid and precise answer, as cutting the tissue into smaller pieces increases the surface area and thus the rate of reaction.
Giving full experimental details, describe how you could use the apparatus shown in Fig. 1.1 to investigate the effect of temperature on the activity of catalase.
Answer
- Use the same volume and concentration of hydrogen peroxide for each trial.
- Use the same type, mass, and surface area of tissue for each trial.
- Use fresh samples of tissue at each temperature to ensure the enzyme is active.
- Set up a range of different temperatures (e.g., 10, 20, 30, 40, 50, 60 °C).
- Maintain the temperature by placing the conical flask in a water bath at the desired temperature.
- Leave the flask and contents in the water bath for a set time to allow them to reach the target temperature before starting the reaction.
- Add the hydrogen peroxide, close the bung, and measure the volume of oxygen collected in the gas syringe over a fixed time (e.g., 5 minutes).
(Note: Direct heating is rejected; a water bath must be used to maintain a constant temperature.)
See working for a 5-point experimental method.
Walkthrough
The question asks for a full experimental description to investigate the effect of temperature on catalase activity using the given apparatus. This is a 5-mark question, so you need to provide a structured method covering all critical aspects of a fair test.
- Controlled variables (Substrate & Enzyme): You must state that the volume and concentration of hydrogen peroxide are kept constant. You must also state that the mass, volume, or surface area of the tissue is kept constant. This ensures the only variable changing is temperature.
- Fresh samples: Enzymes can degrade or be used up. State that fresh samples of tissue are used for each temperature to ensure consistent enzyme activity.
- Independent variable (Temperature): State that you will use a range of different temperatures (e.g., 10 to 60 °C in 10 °C intervals).
- Temperature control method: You must specify using a water bath to maintain the temperature. Direct heating (e.g., a Bunsen burner) is rejected because it causes uneven heating and makes it difficult to maintain a constant temperature.
- Equilibration time: State that the flask and contents must be left in the water bath for a period before adding the substrate, to allow the temperature to equilibrate.
- Measurement: State that you will measure the volume of oxygen produced in the gas syringe over a fixed, given time (e.g., 5 minutes).
Key Takeaways
- A full experimental method must cover: what is measured, the independent variable range, controlled variables, how the independent variable is maintained, and the timing of measurements.
- Always specify a water bath for temperature control in enzyme experiments; direct heating is a common error.
- Mentioning "fresh samples" shows an understanding that enzyme activity can change over time or with repeated use.
Common Mistakes
- Forgetting the water bath: Saying "heat the flask" or "use a Bunsen burner". Direct heating is rejected because it does not maintain a constant temperature.
- Not mentioning equilibration: Forgetting to state that the contents must reach the target temperature before the reaction starts.
- Vague controlled variables: Saying "keep everything the same" instead of specifying volume, concentration, mass, etc.
- Missing fresh samples: Not mentioning that new tissue is used for each temperature.
Things to Be Careful About
- The mark scheme explicitly rejects "direct heating". You must state "water bath".
- The mark scheme gives credit for "range of suitable temperatures stated". Give a specific range (e.g., 10-60 °C) rather than just "different temperatures".
- Ensure your method is logical and sequential: set up water bath -> equilibrate -> add substrate -> measure time and volume.
State one safety precaution you would take when you carry out this experiment. Explain why this precaution is needed.
Answer
Safety precaution: Wear safety goggles (or wear gloves / avoid skin contact).
Explanation: Hydrogen peroxide is an irritant / can cause skin burns / can bleach skin. Wearing goggles protects the eyes from splashes, and wearing gloves protects the skin from irritation or burns.
(Any valid precaution linked to a valid explanation, e.g., 'Wear gloves because hydrogen peroxide is an irritant to the skin'.)
Wear safety goggles to protect eyes from hydrogen peroxide splashes, as it is an irritant.
Walkthrough
The question asks for one safety precaution and its explanation. The main hazard in this experiment is the hydrogen peroxide solution.
- Identify the hazard: Hydrogen peroxide is a chemical that can be harmful. It is an irritant to the skin and eyes, and can cause burns or bleaching at higher concentrations.
- State the precaution: Wear safety goggles to protect the eyes, or wear gloves to protect the skin.
- Explain why: Link the precaution directly to the hazard. Goggles prevent splashes from reaching the eyes; gloves prevent the chemical from contacting the skin.
Key Takeaways
- Safety answers must have two parts: the precaution AND the explanation. Just stating "wear goggles" is not enough; you must explain why.
- The explanation must be linked to the specific chemical or biological hazard in the experiment.
Common Mistakes
- Vague explanations: Saying "to be safe" or "to avoid injury" without specifying the hazard (hydrogen peroxide is an irritant).
- Unlinked precaution and explanation: Stating "wear goggles" and "hydrogen peroxide is dangerous" as two separate facts rather than a cause-and-effect link.
- Irrelevant precautions: Saying "do not run in the laboratory" which, while true, is not specific to the hazards of this experiment.
Things to Be Careful About
- The mark scheme requires the explanation to be linked to the safety precaution. Ensure your sentence structure shows this link (e.g., "Wear gloves because...").
- Hydrogen peroxide is the primary hazard here. Tissue pieces are not a significant hazard in this context.
The enzyme Savinase® is a protease used in many biological detergents. Biological detergents are used to wash clothes. Fig. 1.2 shows the effect of temperature on the activity of Savinase®.
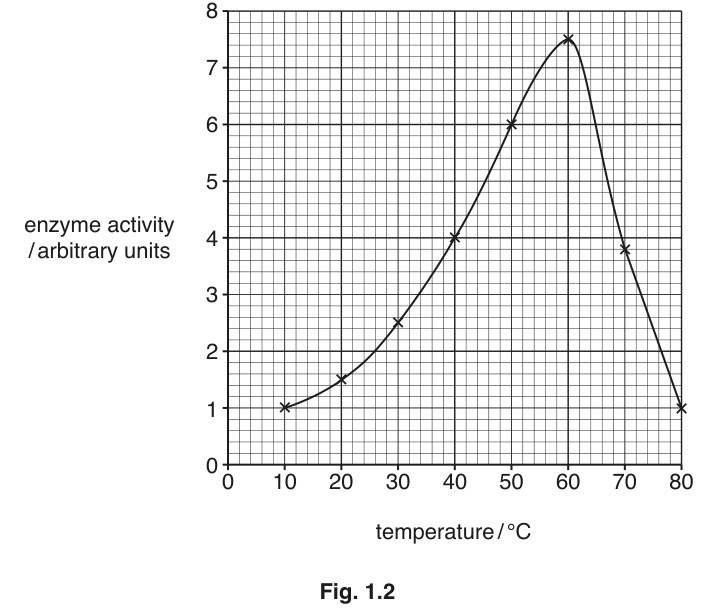
Use Fig. 1.2 to find the optimum temperature for Savinase® activity.
______
Answer
The optimum temperature is the temperature at which enzyme activity is highest. Looking at Fig. 1.2, the peak of the curve is at 60 °C.
60
60
Walkthrough
The question asks for the optimum temperature for Savinase® activity using the provided graph.
- Understand 'optimum': The optimum temperature is the temperature at which the enzyme works fastest, i.e., where the enzyme activity is at its maximum.
- Read the graph: Look at Fig. 1.2. The y-axis shows enzyme activity, and the x-axis shows temperature. Find the highest point on the curve.
- Determine the value: The peak of the curve aligns with 60 on the x-axis (temperature / °C). The activity at this point is approximately 7.5 arbitrary units.
Key Takeaways
- The optimum temperature is always the x-value corresponding to the maximum y-value on an enzyme activity graph.
- Read the graph carefully to the nearest marked division.
Common Mistakes
- Reading the wrong axis: Reading the activity value (7.5) instead of the temperature value (60).
- Misreading the scale: The x-axis has major markings every 10 °C and minor markings every 2 °C. Ensure you read the correct value (60, not 58 or 62).
Things to Be Careful About
- The question asks for the temperature, not the activity. The answer blank has
$^\circ\text{C}$next to it, so just write the number60. - The graph shows a sharp drop after 60 °C, indicating denaturation. The peak is clearly at 60 °C.
Suggest why Savinase® is added to biological detergents.
Answer
- Savinase® is a protease, which means it breaks down protein.
- It is added to biological detergents to break down protein stains on clothes, such as blood, milk, or food stains.
- It remains active in the warm or hot water used for washing, so it is not denatured or deactivated by the washing conditions.
(Any two points: breaks down protein stains; named protein stain; not denatured by hot water.)
Breaks down protein stains (e.g., blood, milk) and is not denatured by hot wash water.
Walkthrough
The question asks why a protease (Savinase®) is added to biological detergents. This requires applying biological knowledge to a real-world application.
- Identify the enzyme type: The question states Savinase® is a protease. Proteases break down proteins into smaller peptides or amino acids.
- Identify the target: What do detergents need to remove? Many common stains (blood, milk, egg, grass) are made of protein. Therefore, the protease breaks down these protein stains, making them easier to wash away.
- Consider the washing conditions: Biological detergents are used in washing machines, which often use warm or hot water. Some enzymes denature at high temperatures, but biological detergents contain enzymes (like Savinase®) that are stable and active at higher temperatures (up to 60 °C or more, as seen in Fig 1.2). This makes them more effective than non-biological detergents in hot washes.
Key Takeaways
- Proteases break down proteins. Link this to protein-based stains (blood, milk, food).
- Biological detergents are designed to work in warm/hot water, so the enzymes must not denature at these temperatures.
Common Mistakes
- Wrong enzyme function: Saying proteases break down fats or carbohydrates (those are lipases and amylases, respectively).
- Vague stain description: Saying "breaks down stains" without specifying that they are protein stains.
- Ignoring temperature stability: Not mentioning that the enzyme is not denatured by hot water, which is a key advantage of biological detergents.
Things to Be Careful About
- The mark scheme requires two points: the function (breaks down protein) and a named example (blood, food, milk), OR the function plus the temperature stability (not denatured by hot water).
- Ensure you use the term "protein" explicitly, as this is the key biological concept being tested.
The rest of this paper
2 more questions- Q2Microscopy and Biological Drawing · Experimental Contexts9M
- Q3Microscopy and Biological Drawing · Analysis, Conclusions and Evaluation · Experimental Contexts12M