Biology 5090/32 — May/June 2017
Cambridge O-Level · Practical Test · worked solutions for every part, with the mark scheme
Topics Experimental Contexts · Analysis, Conclusions and Evaluation · Observations and Measurements · Planning Experiments and Investigations · Microscopy and Biological Drawing · Use of Techniques, Apparatus and Materials
You are going to carry out an experiment to investigate the effect of two different concentrations of sucrose solution on potato tissue.
You are provided with some potato tissue and two solutions of sucrose, labelled S1 and S2.
- Label one Petri dish S1 and the other Petri dish S2.
- Carefully cut two strips of potato tissue without skin, each measuring .
- Place one strip into each Petri dish.
- Pour solution S1 into the dish labelled S1. Pour solution S2 into the dish labelled S2. Make sure that the strips are completely covered by the solutions.
- Leave the strips for 20 minutes. Continue with question 1(b) while you are waiting.
- After 20 minutes, remove the strip from solution S1 and carefully blot it dry.
- Insert a pin near the end of the strip from solution S1 and then attach it to the apparatus as shown in Fig. 1.1. Make sure that this end of the strip is level with the edge of the cork.
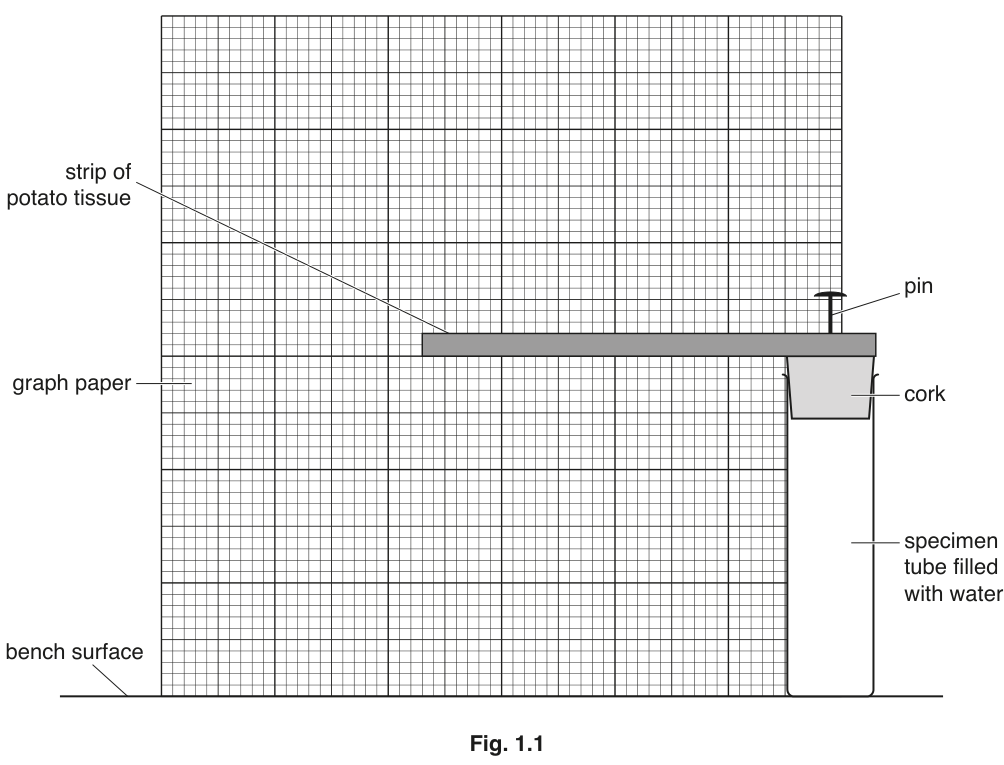
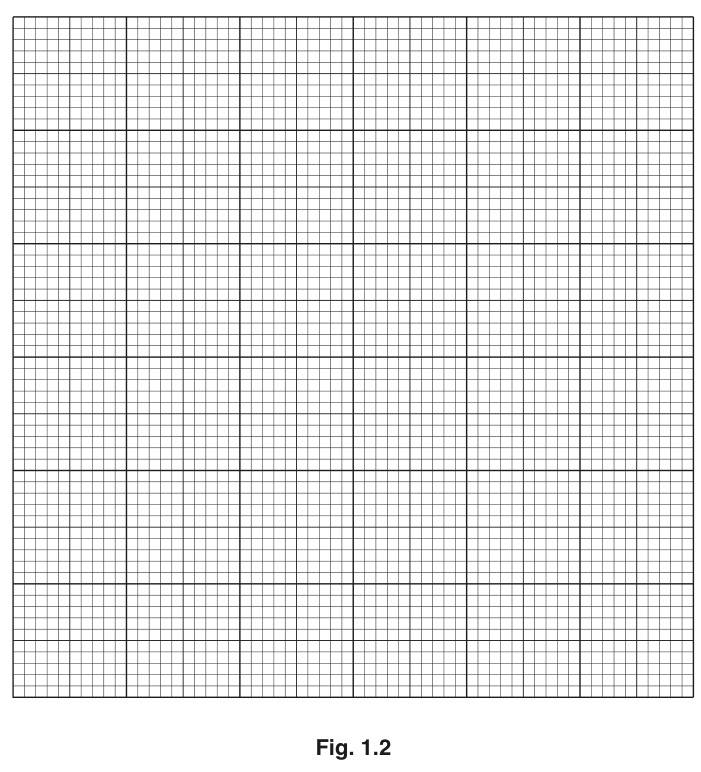
- Record the position of the unpinned end of the strip on the graph paper, and label it S1.
- Repeat this procedure for the strip in solution S2.
Carefully copy your results onto Fig. 1.2. Use a small to show the position of the unpinned end for each strip. Label your results S1 and S2.
Complete Table 1.1 by describing how flexible the strips are, that had been in solution S1 and in solution S2.
Table 1.1
| strip covered in solution | description of strip |
|---|---|
| S1 | |
| S2 |
State two variables which were controlled in this experiment to ensure that the results for S1 and S2 are comparable.
- ______
- ______
Suggest an explanation for your results.
When plant cells lose water, the cytoplasm may shrink and move away from the cell wall. When this happens, the cells are plasmolysed.
Fig. 1.3 represents a group of plant cells, some of which are plasmolysed.
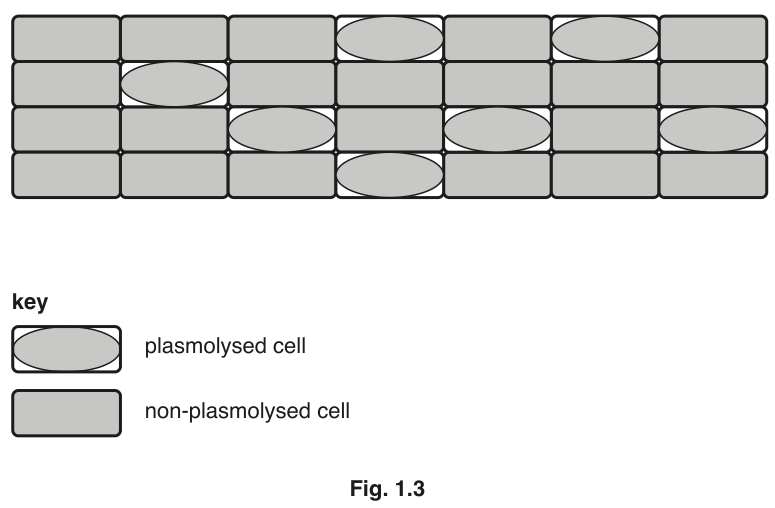
Complete Table 1.2 by counting the number of plasmolysed cells and the number of non-plasmolysed cells.
Table 1.2
| number of plasmolysed cells | number of non-plasmolysed cells |
|---|
Calculate the number of plasmolysed cells as a percentage of the total number of cells.
Show your working.
______ %
A student carried out an investigation into the relationship between the concentration of sucrose solution and the number of plant cells which were plasmolysed.
She placed small pieces of plant tissue in sucrose solutions and counted the number of cells that were plasmolysed. She then calculated the percentage of cells that were plasmolysed in each solution.
Her results are shown in Table 1.3.
Table 1.3
| concentration of sucrose solution / | percentage of cells that were plasmolysed |
|---|---|
| 0.0 | 0 |
| 0.2 | 5 |
| 0.4 | 18 |
| 0.6 | 75 |
| 0.8 | 100 |
Plot a line graph of the results in Table 1.3. Join the points on your graph with ruled, straight lines.

Use your graph to find the concentration of sucrose solution in which 50% of the cells would be plasmolysed. On your graph, show how you obtained this value.
Concentration of sucrose solution in which 50% of the cells would be plasmolysed: ______
The rest of this paper
2 more questions- Q2Microscopy and Biological Drawing · Experimental Contexts10M
- Q3Experimental Contexts · Use of Techniques, Apparatus and Materials · Analysis, Conclusions and Evaluation10M