Biology 5090/31 — May/June 2017
Cambridge O-Level · Practical Test · worked solutions for every part, with the mark scheme
Topics Experimental Contexts · Analysis, Conclusions and Evaluation · Observations and Measurements · Planning Experiments and Investigations · Microscopy and Biological Drawing · Use of Techniques, Apparatus and Materials
You are going to carry out an experiment to investigate the effect of two different concentrations of sucrose solution on potato tissue.
You are provided with some potato tissue and two solutions of sucrose, labelled S1 and S2.
- Label one Petri dish S1 and the other Petri dish S2.
- Carefully cut two strips of potato tissue without skin, each measuring .
- Place one strip into each Petri dish.
- Pour solution S1 into the dish labelled S1. Pour solution S2 into the dish labelled S2. Make sure that the strips are completely covered by the solutions.
- Leave the strips for 20 minutes. Continue with question 1(b) while you are waiting.
- After 20 minutes, remove the strip from solution S1 and carefully blot it dry.
- Insert a pin near the end of the strip from solution S1 and then attach it to the apparatus as shown in Fig. 1.1. Make sure that this end of the strip is level with the edge of the cork.
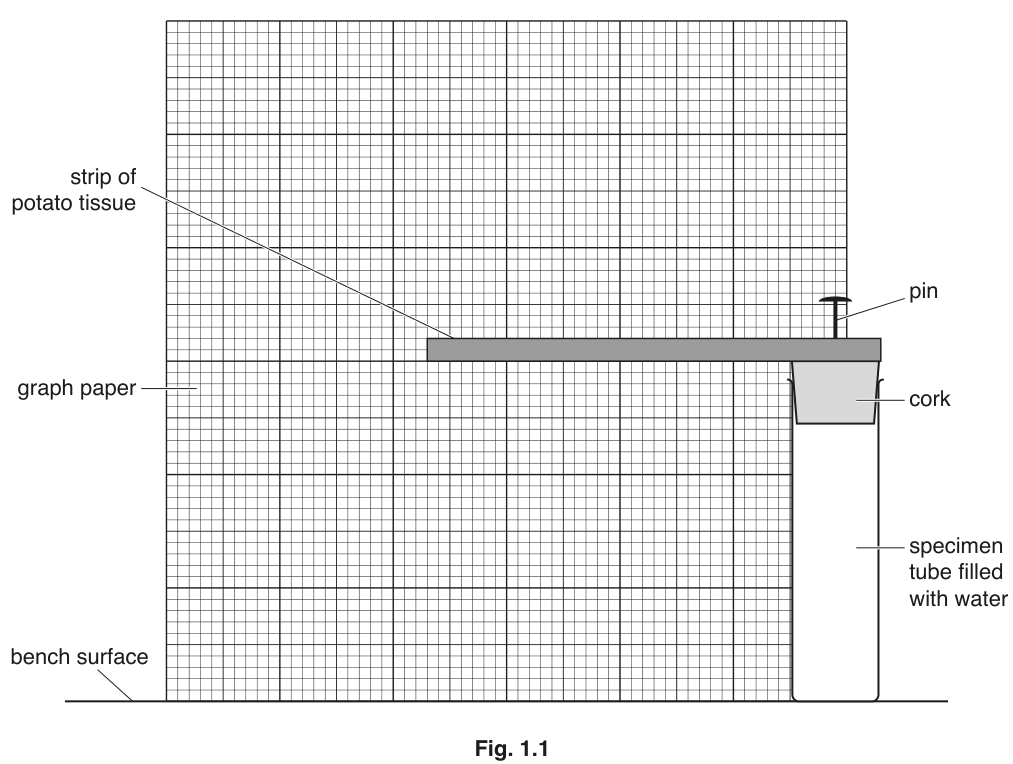
- Record the position of the unpinned end of the strip on the graph paper, and label it S1.
- Repeat this procedure for the strip in solution S2.
Carefully copy your results onto Fig. 1.2. Use a small to show the position of the unpinned end for each strip. Label your results S1 and S2.
Answer
Two small crosses are marked on the grid of Fig. 1.2, each labelled:
- S1 — cross positioned further out along the strip direction (the strip has bent less / extended more)
- S2 — cross positioned closer to the cork (the strip has bent down more)
The S1 cross is placed higher than the S2 cross.
Two labelled crosses on Fig. 1.2, S1 higher than S2
Walkthrough
This part records what you actually observed with your own strips, so there is no single printed answer — the marks are awarded for how you record it. The apparatus in Fig. 1.1 holds the potato strip horizontally with one end pinned level with the cork, and the free end hangs over graph paper. A turgid strip stays stiff and hardly bends, so its unpinned end sits far out and high on the paper. A flaccid strip is soft and flops downwards, so its unpinned end sits lower and nearer the cork.
To score all three marks you must: (1) draw a small × for EACH strip — two crosses in total; (2) label them clearly S1 and S2 so the examiner knows which is which; (3) place the S1 cross HIGHER than the S2 cross, because S1 (the solution that made cells turgid) leaves the strip firmer and less bent. The crosses must be small and sit at the actual position of the unpinned end of your own strip.
Key Takeaways
- Recording observations on a printed figure must be done neatly and labelled — an unlabelled cross cannot be credited.
- Strip flexibility links directly to water movement: turgid = firm = high position; flaccid = floppy = low position.
Common Mistakes
- Drawing only one cross, or drawing large blobs instead of small × symbols.
- Forgetting the labels S1 and S2 — this loses a whole mark.
- Putting S2 higher than S1, which contradicts the biology (S2 cells lose water and go flaccid).
Things to Be Careful About
The mark scheme reads 'S1 mark higher than S2' as a required point — the relative height IS a marking point, not just good practice. Use a sharp pencil and keep the crosses small.
Complete Table 1.1 by describing how flexible the strips are, that had been in solution S1 and in solution S2.
Table 1.1
| strip covered in solution | description of strip |
|---|---|
| S1 | |
| S2 |
Answer
| strip covered in solution | description of strip |
|---|---|
| S1 | firm / turgid / hard / less flexible |
| S2 | soft / flaccid / more flexible |
S1: firm/turgid; S2: soft/flaccid
Walkthrough
After 20 minutes in their solutions, the two strips feel different when you bend them gently. Solution S1 has a water potential such that water enters the potato cells by osmosis, so the cells become turgid — the strip feels firm, hard and stiff. Solution S2 causes water to leave the cells, so they become flaccid — the strip feels soft and bends easily.
You need exactly one description per row. Any wording meaning 'stiff' scores for S1 ('less flexible', 'firm', 'turgid', 'hard'), and any wording meaning 'bendy' scores for S2 ('more flexible', 'soft', 'flaccid').
Key Takeaways
- Turgid cells push against the cell wall, making tissue rigid; flaccid cells do not, so tissue is limp.
- Flexibility is a quick, observable indicator of whether cells have gained or lost water.
Common Mistakes
- Writing vague answers like 'it changed' or 'it was different' — no credit without a comparative descriptor.
- Reversing the rows: S1 makes cells turgid, not flaccid.
- Describing colour or length when the question asks specifically about FLEXIBILITY.
Things to Be Careful About
The mark scheme accepts AW (alternative wording) here, so precise synonyms are fine — but each entry must describe flexibility/stiffness, not some other property.
State two variables which were controlled in this experiment to ensure that the results for S1 and S2 are comparable.
- ______
- ______
Answer
- Strips cut to the same size / dimensions ()
- Both strips left for the same time (20 minutes)
(Other acceptable answers: strips fully covered by the solutions; same blotting procedure; attached to the cork in the same way; strips cut from the same potato.)
Same size/dimensions of strips; same time left in solutions (any two)
Walkthrough
A controlled variable is anything (other than the independent variable — the sucrose concentration) kept the same for both strips so that any difference in the results is due to the solutions alone. Read back through the method in part (a): every 'same' instruction is a controlled variable.
The scheme lists six possibilities and asks for any two:
- strips cut to the same size/dimensions/surface area/volume;
- strips fully submerged/covered by the solutions;
- left for the same time (20 minutes);
- standard blotting procedure;
- aligned on the cork the same way;
- strips cut from the same potato.
Any two of these earn the two marks. The safest choices are the ones most obviously stated in the method: identical dimensions and identical time.
Key Takeaways
- Controlled variables come straight from the 'keep everything else the same' instructions in a method.
- Comparability means the ONLY difference between the two set-ups is the concentration of sucrose solution.
Common Mistakes
- Naming the sucrose concentration itself — that is the INDEPENDENT variable, not a controlled one.
- Naming the flexibility of the strips — that is the dependent variable (what is measured).
- Giving generic answers like 'temperature' when the method never mentions controlling temperature.
Things to Be Careful About
Give exactly two variables — extra ones gain nothing, and a wrong one (like the independent variable) may cost the mark if it replaces a correct one.
Suggest an explanation for your results.
Answer
Water moves by osmosis across the partially permeable cell membranes of the potato cells.
- In S1, water moves into the cells (from the solution into the strip); the extra water makes the cells turgid, so the strip becomes firmer.
- In S2, water moves out of the cells into the solution; the loss of water makes the cells flaccid, so the strip becomes softer.
Osmosis: water enters cells in S1 making the strip firmer; water leaves cells in S2 making it softer
Walkthrough
This is the explanation behind everything observed in (a)(i) and (a)(ii). Osmosis is the diffusion of water molecules from a region of higher water potential (dilute solution) to a region of lower water potential (concentrated solution), through a partially permeable membrane. Every potato cell is surrounded by a partially permeable cell membrane, so water can pass in or out depending on the relative water potentials of the cell contents and the surrounding solution.
Solution S1 must be more dilute than the cell sap (higher water potential than the cytoplasm), so water flows INTO the cells. The vacuoles swell, the cytoplasm presses on the cell wall, and the cells become turgid — the strip stiffens and bends less.
Solution S2 must be more concentrated than the cell sap (lower water potential), so water flows OUT of the cells into the solution. The cells lose water, become flaccid, and the strip goes soft and floppy.
The four marks map onto four points: (1) mention movement of water; (2) name osmosis; (3) water INTO S1's cells → firmer; (4) water OUT OF S2's cells → softer.
Key Takeaways
- Always name osmosis explicitly — describing water movement alone does not earn the osmosis mark.
- Direction of water movement depends on comparing water potentials: water moves from higher to lower water potential.
- Turgor pressure against the inelastic cell wall is why turgid tissue is firm.
Common Mistakes
- The mark scheme states 'Ig diffusion' — saying 'diffusion' instead of osmosis gains nothing for the osmosis point.
- 'R if osmosis and active transport in the same answer' — never suggest active transport here; water moves passively by osmosis.
- Explaining only one strip — both directions (in for S1, out for S2) are needed for full marks.
- Saying water moves 'to equalise concentrations' without naming osmosis or the membrane.
Things to Be Careful About
Use the exact word osmosis. Link each direction of water movement to the observed change in flexibility — the '+' structure of the mark scheme means the water movement AND its effect are needed together.
When plant cells lose water, the cytoplasm may shrink and move away from the cell wall. When this happens, the cells are plasmolysed.
Fig. 1.3 represents a group of plant cells, some of which are plasmolysed.
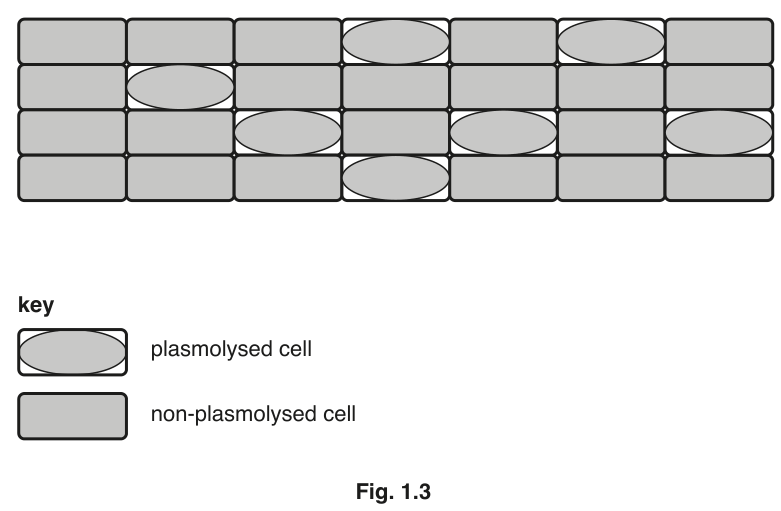
Complete Table 1.2 by counting the number of plasmolysed cells and the number of non-plasmolysed cells.
Table 1.2
| number of plasmolysed cells | number of non-plasmolysed cells |
|---|---|
Answer
| number of plasmolysed cells | number of non-plasmolysed cells |
|---|---|
| 7 | 21 |
7 plasmolysed; 21 non-plasmolysed
Walkthrough
Use the key under Fig. 1.3: a plasmolysed cell shows a shrunken oval of cytoplasm inside the cell boundary, while a non-plasmolysed cell is filled solid grey. Work through the grid systematically — row by row, left to right — ticking off each cell so none is counted twice or missed. There are 7 cells with the shrunken oval (plasmolysed) and 21 filled grey (non-plasmolysed), giving 28 cells in total.
Key Takeaways
- Always use the printed key to decide what counts as each category.
- Systematic counting (row by row) avoids double-counting in a grid of cells.
Common Mistakes
- Misreading the key and counting the oval cells as non-plasmolysed.
- Skipping cells or counting boundary cells twice — check the total adds up to 28.
Things to Be Careful About
Both numbers must be correct for the single mark; the pair 7 and 21 is credited together.
Calculate the number of plasmolysed cells as a percentage of the total number of cells.
Show your working.
______ %
Working
Answer
25.0 %
25.0%
Walkthrough
The question asks for the plasmolysed cells as a percentage of the TOTAL number of cells, not of the non-plasmolysed cells. Total = 7 + 21 = 28. Divide 7 by 28 and multiply by 100: 7 ÷ 28 = 0.25, and 0.25 × 100 = 25%. Writing the answer as 25.0% matches the precision shown in the mark scheme.
Note the mark scheme's rule: the correct answer with no working still gains both marks, but if your answer is wrong, one mark is available for correct working — so always show the substitution.
Key Takeaways
- percentage = (part ÷ whole) × 100, where 'whole' is stated in the question — here the total of ALL cells.
- Showing working protects a mark even if arithmetic slips.
Common Mistakes
- Dividing by 21 (the non-plasmolysed count) instead of 28 — this gives 33.3%, which is wrong.
- Forgetting to multiply by 100.
- Not showing working and then making an arithmetic slip, losing both marks.
Things to Be Careful About
Read 'total' carefully — it means plasmolysed + non-plasmolysed. Give the unit (%) as printed on the answer line.
A student carried out an investigation into the relationship between the concentration of sucrose solution and the number of plant cells which were plasmolysed.
She placed small pieces of plant tissue in sucrose solutions and counted the number of cells that were plasmolysed. She then calculated the percentage of cells that were plasmolysed in each solution.
Her results are shown in Table 1.3.
Table 1.3
| concentration of sucrose solution/ | percentage of cells that were plasmolysed |
|---|---|
| 0.0 | 0 |
| 0.2 | 5 |
| 0.4 | 18 |
| 0.6 | 75 |
| 0.8 | 100 |
Plot a line graph of the results in Table 1.3. Join the points on your graph with ruled, straight lines.
Answer
- x-axis: concentration of sucrose solution / mol per , linear scale from 0 to 0.8
- y-axis: percentage of cells that were plasmolysed, linear scale from 0 to 100
- All five points plotted: (0.0, 0), (0.2, 5), (0.4, 18), (0.6, 75), (0.8, 100)
- Points joined with ruled straight lines, stopping at the last plot (no extrapolation beyond 0.8 / 100)
Line graph with labelled axes, five points plotted and joined by ruled lines
Walkthrough
Graph questions on Paper 3 are marked on conventions, and each convention is a separate mark:
- Axes fully labelled — write 'concentration of sucrose solution / mol per ' along the x-axis and 'percentage of cells that were plasmolysed' along the y-axis, units included. An unlabelled axis loses the first mark even if everything else is perfect.
- Correct orientation and scales — the independent variable (concentration) goes on the x-axis and the dependent variable (% plasmolysed) on the y-axis. Both scales must be LINEAR (equal steps per square), start at 0 at the origin, and use at least half the grid in each direction. A scale of 2 squares per 0.1 mol per dm³ and 2 squares per 10% works well on this grid.
- Plotting — all five points must be plotted within half a small square of their true position. Use a sharp pencil and small, neat crosses.
- Joining — the question specifies ruled STRAIGHT lines between consecutive points (not a smooth curve), and the line must STOP at the last point (0.8, 100). Extrapolating beyond the data loses the fourth mark.
Key Takeaways
- Independent variable on x, dependent variable on y, always.
- Linear scales, zero at the origin, at least half the grid used.
- Follow the joining instruction exactly: here ruled straight lines, not a curve.
- Never extend a line beyond the plotted data.
Common Mistakes
- Swapping the axes (putting % on the x-axis).
- Non-linear scales (e.g. 0, 0.2, 0.5, 0.8 equally spaced).
- Using a smooth curve when the question demands ruled straight lines.
- Extrapolating the line past (0.8, 100) towards the top of the grid.
- Missing axis units — '/ mol per dm³' must appear.
Things to Be Careful About
Plot points to within half a small square. Check each point against the table before drawing the line — one misplotted point costs the plotting mark outright.
Use your graph to find the concentration of sucrose solution in which 50% of the cells would be plasmolysed. On your graph, show how you obtained this value.
Concentration of sucrose solution in which 50% of the cells would be plasmolysed: ______
Answer
On the graph, draw a horizontal ruled line from 50% on the y-axis until it meets the plotted line (between 0.4 and 0.6 mol per ), then drop a vertical line from that intersection to the x-axis.
Concentration of sucrose solution in which 50% of the cells would be plasmolysed ≈ 0.55 mol per (accept the value read from the candidate's own construction, ± half a small square)
Approximately 0.55 mol per dm³ (value consistent with candidate's construction lines)
Walkthrough
50% lies between the plotted values 18% (at 0.4) and 75% (at 0.6), so this is interpolation — reading a value BETWEEN plotted points, which is legitimate (unlike extrapolation beyond the data). The method:
- Find 50 on the y-axis and rule a horizontal line across until it meets the straight segment joining (0.4, 18) and (0.6, 75).
- From that meeting point, rule a vertical line down to the x-axis.
- Read the concentration where the vertical line lands. On this segment the line rises 57 percentage points over 0.2 mol per dm³, so 50% falls just over halfway: about 0.55 mol per dm³.
The mark scheme awards one mark for the construction lines being SHOWN on the graph and one for the value read correctly from the candidate's own working, with a tolerance of ± half a small square. This means your answer must be consistent with YOUR OWN lines — a slightly different scale gives a slightly different read-off, and both can score.
Key Takeaways
- Interpolation (between points) is valid; extrapolation (beyond the last point) is not.
- Construction lines must actually be drawn — the examiner marks the working on the graph, not just the final number.
- The accepted value comes from the candidate's own graph, within ± half a small square.
Common Mistakes
- Giving a value without drawing the horizontal and vertical construction lines — this loses the working mark.
- Reading from the wrong segment (e.g. between 0.6 and 0.8).
- Extrapolating instead of interpolating.
- Quoting a value inconsistent with the drawn lines.
Things to Be Careful About
Include the unit 'mol per ' in the answer — the mark scheme requires it. Keep construction lines ruled and light but visible.
The rest of this paper
2 more questions- Q2Microscopy and Biological Drawing · Experimental Contexts10M
- Q3Experimental Contexts · Use of Techniques, Apparatus and Materials · Analysis, Conclusions and Evaluation10M