Biology 5090/61 — October/November 2016
Cambridge O-Level · Alternative to Practical · worked solutions for every part, with the mark scheme
Topics Experimental Contexts · Analysis, Conclusions and Evaluation · Planning Experiments and Investigations · Microscopy and Biological Drawing · Use of Techniques, Apparatus and Materials · Observations and Measurements
In order to stay alive, cells depend on soluble molecules being able to enter and leave them.
Some blocks of agar, a firm jelly, were used to represent living cells.
A student knew that when agar is coloured with a red indicator and then placed in an acid solution, the agar will change colour from red to yellow as the acid diffuses into it.
The student was provided with three pieces of red agar jelly, A, B and C, as shown in Fig. 1.1.
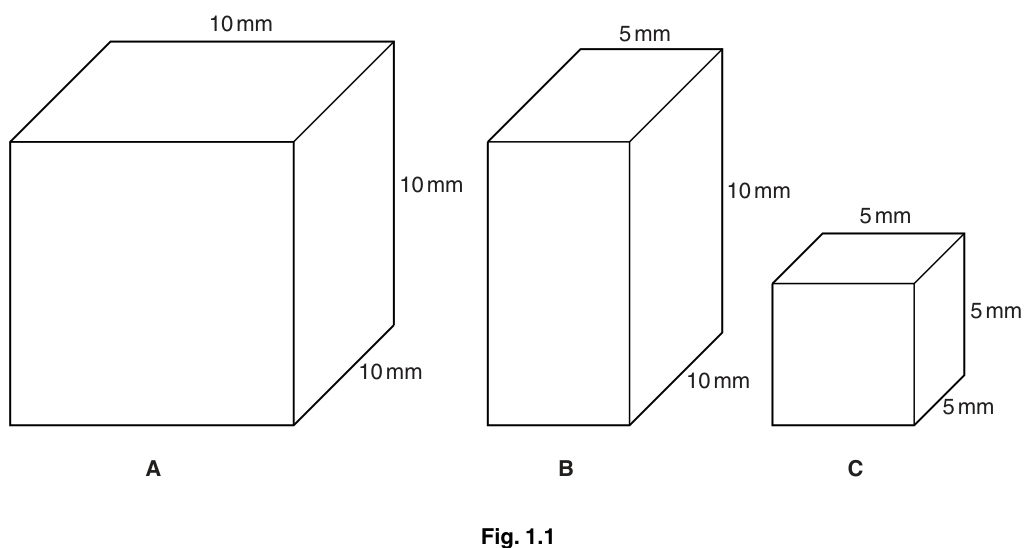
The student placed each piece of jelly in a separate container of the same acid solution at 30 second intervals, and the time was recorded.
The time at which the colour of each piece changed from red to yellow was also recorded.
Table 1.1 shows the results.
Table 1.1
| piece | dimensions / | time when piece placed in acid solution / | time at which colour changed / | time taken for colour change / |
|---|---|---|---|---|
| A | 0 | 480 | 480 | |
| B | 30 | 150 | ||
| C | 60 | 100 |
Calculate the times taken for pieces B and C to change colour.
Write your answers in the spaces in Table 1.1.
Answer
- B:
- C:
B = 120 s; C = 40 s
Walkthrough
The table gives two clock times for each piece: when it went into the acid and when it turned yellow. The 'time taken' column wants the difference between them, not the raw clock time. For B, the piece entered at 30 s and changed at 150 s, so it took seconds. For C, entry at 60 s and change at 100 s gives seconds. A common slip is copying the third column straight across — that records when it happened, not how long it took.
Key Takeaways
- Time taken = finish time − start time; always subtract before writing into a results table.
- Units here are seconds throughout, so no conversion is needed.
Common Mistakes
- Writing 150 and 100 (the clock times) instead of the intervals.
- Forgetting to include the unit / s in the completed table.
Things to Be Careful About
- The table header already says 'time taken ... / s', so give plain numbers in the table but state the unit in your working.
Describe the trend shown by the results in Table 1.1.
Answer
- The largest piece (A) took the longest time to change colour.
- The bigger the piece of agar, the longer the time taken for the colour change (and vice versa).
See working
Walkthrough
Compare the times: A ( mm) took 480 s, B took 120 s and C ( mm) took only 40 s. So as the pieces get smaller, the colour change happens faster — or stated the other way round, the larger the piece, the longer the acid takes to diffuse through it. The mark scheme credits either direction of the statement (ORA), but the key is to express it as a relationship ('the bigger ... the longer'), not just to list the three numbers.
Key Takeaways
- A trend statement links the variables: as one changes, the other changes in a stated direction.
- Diffusion into a block takes longer the further the acid must travel to reach the centre.
Common Mistakes
- Quoting the individual times without stating the relationship.
- Saying 'smaller pieces have more surface area' without linking it to the time taken.
Things to Be Careful About
- Both halves of the second marking point are needed: bigger piece AND longer time. One alone may not score the full mark.
Use these results to suggest why typical animal cells are rarely larger than in diameter.
Answer
- In small cells, movement of substances such as oxygen and carbon dioxide in and out is rapid / fast enough.
- This movement is by diffusion.
Small cells allow rapid diffusion of substances (e.g. oxygen, carbon dioxide) in and out.
Walkthrough
The agar experiment shows that small blocks are penetrated by acid quickly while large blocks take much longer. Living cells face the same problem: they depend on dissolved molecules entering and leaving by diffusion — the net movement of particles from a region of higher concentration to a region of lower concentration. If a cell were large, the centre would be a long way from the surface, so oxygen and glucose would take too long to diffuse in and carbon dioxide and other wastes too long to diffuse out. Small cells keep every part close to the surface, so diffusion is fast enough to supply the cell's needs. That is why typical animal cells stay around 0.1 mm across.
Note the mark scheme accepts named substances such as oxygen, carbon dioxide, waste products, ions, vitamins or hormones — anything small enough to diffuse.
Key Takeaways
- Diffusion rate limits cell size: distance from the surface determines how quickly a cell can be supplied.
- Always name the process (diffusion) and at least one example substance.
Common Mistakes
- Saying 'osmosis' — osmosis is specifically water moving through a partially permeable membrane; the question asks about soluble molecules generally.
- Naming a substance too big to diffuse, or not naming any substance at all.
- Explaining only about surface area without linking to speed of movement of substances.
Things to Be Careful About
- The first marking point needs BOTH the idea of rapid/fast enough movement AND named substances; the second point is the word 'diffusion' itself.
Fig. 1.2 shows two onion epidermal cells as seen with a microscope. Cell E had been placed in water, and cell F shows a similar cell that had been placed in a concentrated salt solution for the same length of time.
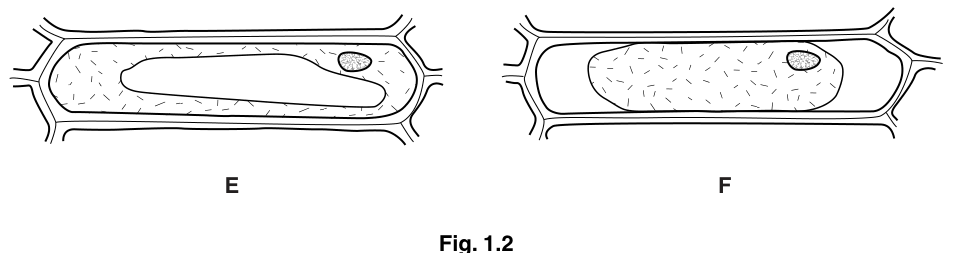
Describe how cell F differs in appearance from cell E.
Answer
- In cell F the cell membrane and contents are pulled away from the cell wall.
- In cell F the cytoplasm has shrunk / is smaller (the vacuole cannot be seen); the cell is plasmolysed.
Cell F is plasmolysed: membrane and contents pulled away from the wall, shrunken cytoplasm.
Walkthrough
Look carefully at Fig. 1.2. Cell E is turgid: its cytoplasm and large vacuole press firmly against the cell wall, filling the whole space inside. Cell F looks different in two ways you can actually see: (1) there is a gap between the cell wall and the contents — the cell membrane with its cytoplasm has shrunk away from the wall; (2) the cytoplasm itself is smaller/shrunken, and the large vacuole seen in E is no longer visible. This condition has a name — the cell is plasmolysed — and using that exact term earns its own credit.
Key Takeaways
- Plasmolysis = the protoplast (membrane + cytoplasm + vacuole) pulling away from the cell wall after water loss.
- Describe what is visible: gap at the edge, shrunken contents, vacuole reduced.
Common Mistakes
- Saying the cell wall has shrunk — the rigid wall keeps its shape; it is the contents inside that shrink.
- Confusing this with lysis/bursting, which happens to animal cells in pure water, not plant cells in salt solution.
- Describing only one difference when two marks are available.
Things to Be Careful About
- Any two of the listed points score: membrane/contents pulled away from wall, vacuole not observable, cytoplasm shrunk, or the term 'plasmolysed'. Give at least two distinct observations.
Suggest an explanation for the appearance of cell F.
Answer
- Water moves out of / leaves the cell.
- By osmosis.
- The concentrated salt solution outside has a lower water potential than the cell contents, so there is a water potential gradient.
- Water passes through the partially permeable cell membrane, so the vacuole and cytoplasm shrink and the cell becomes plasmolysed.
Water left the cell by osmosis down a water potential gradient through the partially permeable membrane, causing plasmolysis.
Walkthrough
Build the explanation in the order the marks fall:
- What moved? Water moved — and it moved out of the cell. That is why the contents shrank.
- By what process? Osmosis — the diffusion of water from a region of higher water potential to a region of lower water potential through a partially permeable membrane.
- Why that direction? The cell was placed in a concentrated salt solution. Dissolved salt lowers water potential, so the solution outside has a lower water potential than the cell sap inside. Water therefore moves down the water potential gradient, from inside the cell to outside.
- Through what? The cell membrane is partially permeable — it lets water molecules through but holds back the dissolved solutes.
- Result: as water leaves, the vacuole shrinks, the cytoplasm pulls away from the rigid cell wall, and the cell is plasmolysed.
Every technical term here is a marking point: osmosis, water potential (gradient), partially permeable membrane, plasmolysis.
Key Takeaways
- Osmosis is defined by water potential, not loosely by 'concentration of water'.
- Concentrated solutions have LOW water potential; dilute solutions have HIGH water potential.
- Plant cells do not burst in pure water because the cell wall resists swelling; in strong salt solution they plasmolyse.
Common Mistakes
- Writing 'water moves from a low concentration to a high concentration' — always frame it as water potential.
- Omitting 'partially permeable membrane' — osmosis is not fully defined without it.
- Saying salt moves into the cell — the salt ions cannot cross the membrane; it is water that moves.
- Using 'semi-permeable' carelessly — the scheme accepts semi/selectively permeable, but 'permeable' alone does not score.
Things to Be Careful About
- Four separate marks means four separate ideas: water moves OUT, by osmosis, down a water potential gradient, through a partially permeable membrane. Write all four explicitly.
Describe an investigation you could carry out to determine the concentration of salt solution that would cause fresh onion epidermal cells to become like cell F.
Answer
- Prepare a range of at least three (e.g. five) salt solutions of different, stated concentrations, e.g. 0.1, 0.2, 0.3, 0.4 and 0.5 mol per dm³.
- Place equal-sized pieces of epidermis from the same onion into each solution for the same length of time, at the same temperature.
- Mount each piece on a slide and examine it with a microscope.
- Count / record the number (or percentage) of plasmolysed cells in each piece.
- The concentration at which about half the cells are plasmolysed (50% plasmolysis) is the concentration that causes fresh onion epidermal cells to become like cell F.
See working
Walkthrough
A planning answer must cover several categories, each worth a mark:
- Varying the independent variable: use a range of different concentrations of salt solution — not just one. Giving actual stated concentrations (or at least saying 'a minimum of three') earns extra detail credit. A sensible range brackets the expected answer, e.g. 0.1 to 0.5 mol per dm³.
- Controlling the other variables: same onion (so the same tissue), same-sized pieces of epidermis, same time in the solution, same temperature. These are the fair-test conditions; naming them specifically scores the double-mark point.
- Making the observation: view each piece under a microscope and record how many cells show plasmolysis like cell F.
- Using the data: find which concentration produces the criterion you set — commonly the concentration causing 50% of the cells to be plasmolysed — and report that as the answer.
This mirrors real practice: the point of incipient plasmolysis is conventionally taken where half the cells are plasmolysed, because individual cells vary slightly.
Key Takeaways
- Every plan needs: what you change, what you keep the same (named), what you measure, and how the measurement answers the question.
- 'A range' means at least three values of the independent variable.
Common Mistakes
- Testing only one concentration — you cannot determine the critical value from a single result.
- Listing vague controls like 'keep everything the same' without naming the variables.
- Forgetting the microscope — plasmolysis can only be judged by looking at the cells.
- Not saying how the results lead to the answer (the recording/handling-of-data point).
Things to Be Careful About
- The mark scheme awards a double mark for the controlled variables, so name at least two specifically (same onion, same time, same temperature, same sized piece).
- State concentrations if you can — 'extra detail' is explicitly credited.
The rest of this paper
2 more questions- Q2Microscopy and Biological Drawing · Experimental Contexts · Use of Techniques, Apparatus and Materials · Planning Experiments and Investigations · Analysis, Conclusions and Evaluation · Observations and Measurements18M
- Q3Experimental Contexts · Analysis, Conclusions and Evaluation6M