Biology 5090/31 — October/November 2016
Cambridge O-Level · Practical Test · worked solutions for every part, with the mark scheme
Topics Observations and Measurements · Experimental Contexts · Analysis, Conclusions and Evaluation · Planning Experiments and Investigations · Microscopy and Biological Drawing · Use of Techniques, Apparatus and Materials
In order to stay alive, cells depend on soluble molecules being able to enter and leave them.
You are going to use pieces of agar, a firm jelly, to represent three cells, A, B and C. The agar is coloured red with an indicator. You will place each piece in an acid solution. When the acid diffuses into the agar, the red indicator will change to a yellow colour.
You will measure the time it takes for each piece to completely change colour.
Complete the column headings in Table 1.1 ready to record your results.
Include:
- the time at which the agar pieces were placed in the acid solution
- the time at which the red colour had completely changed to yellow
- the time taken for the colour to change.
Table 1.1
| piece | dimensions / | |||
|---|---|---|---|---|
| A | ||||
| B | ||||
| C |
Answer
| piece | dimensions / | time agar pieces added to acid | time colour completely changed to yellow | time taken for colour to change |
|---|---|---|---|---|
| A | ||||
| B | ||||
| C |
Three column headings with units: time agar pieces added, time colour completely changed to yellow, time taken for colour to change.
Walkthrough
Before starting any practical, you must have a table ready to receive your readings. The question tells you exactly what must be recorded: when each piece went into the acid, when it had fully turned yellow, and how long the change took. Each column heading must name the quantity AND give its unit — 'time agar pieces added / minutes' or 'time agar pieces added (clock time)' as appropriate. A heading without a unit loses the mark.
Key Takeaways
- Table headings must state the variable and its unit.
- Plan the table before the experiment so readings can be entered immediately.
Common Mistakes
- Writing 'time' alone with no unit — the mark scheme requires 'suitable column headings with units'.
- Merging 'time colour changed' and 'time taken to change' into one column; they are two different quantities.
Things to Be Careful About
- 'Time taken' is a duration (difference between the two times), not a clock reading — keep it as a separate column.
You are provided with one block of red-coloured agar, measuring .
You are also provided with three beakers, labelled A, B, and C, containing equal volumes of the same acid solution.
Read through the following instructions and then carry them out.
- Remove the agar block from the Petri dish and place it on the white tile.
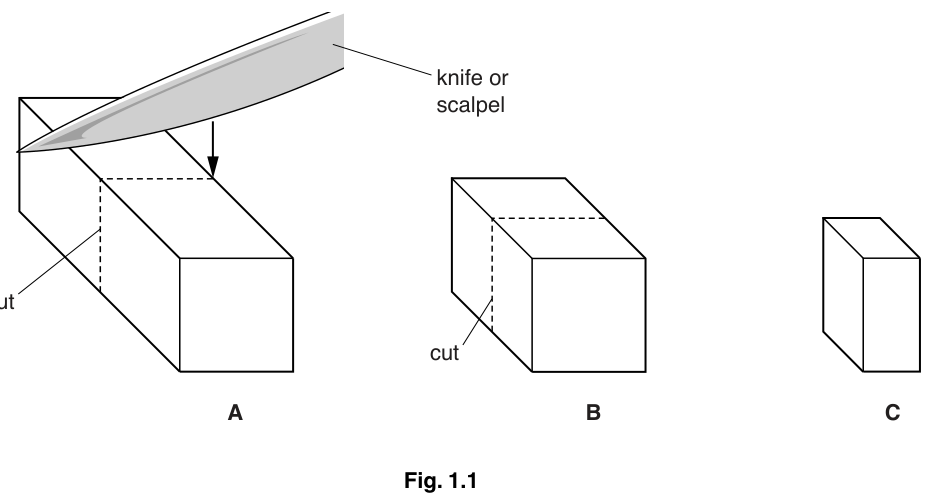
- Use the sharp knife or scalpel provided to cut the agar block into two equally sized pieces, as shown in Fig. 1.1.
- Put one piece aside as cell A.
Record the dimensions of piece A in Table 1.1.
Answer
Dimensions of piece A: (recorded in Table 1.1).
mm
Walkthrough
The original block is mm. Fig. 1.1 shows the first cut made halfway along the 20 mm length, so each half measures mm — a cube. Piece A is one of these halves, so its dimensions are mm. Measure the piece with a ruler to confirm, then write the three numbers in the dimensions column against row A.
Key Takeaways
- Cutting a mm block in half along its length gives two mm cubes.
- The three pieces A, B and C get progressively smaller, which is the whole point of the investigation.
Common Mistakes
- Recording (the original block) instead of the cut piece.
- Omitting the unit mm in the table entry.
Things to Be Careful About
- The dimensions column already carries the unit / mm, so only the three numbers are needed in the cell.
- Cut the remaining piece into two equally sized pieces, measuring .
- Put one of these pieces aside as cell B.
- Cut the remaining piece into two equally sized pieces, measuring .
- Put one of these pieces aside as cell C. The remaining piece is not required.
- Place the piece A in the beaker labelled A and record the time in Table 1.1.
- Place the piece B in the beaker labelled B and record the time in Table 1.1.
- Place the piece C in the beaker labelled C and record the time in Table 1.1.
- Observe the agar pieces and record in Table 1.1 the time at which the red colour for each piece has completely changed to yellow.
Record 'no change' if the colour has not changed within 15 minutes.
Complete Table 1.1.
Answer
Complete Table 1.1 with candidate readings, e.g.:
| piece | dimensions / | time added to acid | time colour completely changed | time taken to change |
|---|---|---|---|---|
| A | e.g. 0:00 | e.g. 12:30 | 12.5 min | |
| B | e.g. 0:30 | e.g. 10:00 | 9.5 min | |
| C | e.g. 1:00 | e.g. 6:00 | 5.0 min |
- Times recorded using one consistent system (e.g. clock time or stopwatch time) for all three pieces.
- Every box completed; 'no change' recorded if a piece has not fully turned yellow within 15 minutes.
- Time taken = time colour completely changed − time piece added to acid, calculated correctly for each piece.
See working — completed Table 1.1 with consistent times, all boxes filled and time taken correctly calculated.
Walkthrough
This is the data-collection core of the practical. Each piece goes into its own beaker of acid; you note the clock time (or stopwatch time) when it goes in, watch it, and note when the last trace of red disappears. The 'time taken' column is then the difference between those two readings. Three mark points: (1) use ONE consistent timing system for all three pieces — mixing clock times and stopwatch times makes the subtraction meaningless; (2) no box may be left empty — if a piece never fully changes, write 'no change' after 15 minutes, which is itself a valid observation; (3) the subtraction must be arithmetically correct.
Key Takeaways
- Consistent timing, complete recording and correct processing are separately credited.
- 'No change' within 15 minutes is a recordable result, not a failure.
Common Mistakes
- Leaving the 'time taken' box blank or copying the end time into it instead of subtracting.
- Recording times for different pieces in different formats (some as clock times, some as minutes elapsed).
Things to Be Careful About
- The colour must have changed COMPLETELY to yellow before you record the end time — a partly changed piece is not finished.
Describe the trend shown by your results.
______
Answer
- Piece A, the largest piece, took the longest time for the colour to change.
- The bigger the piece of agar, the longer the time taken for the colour change (the smaller the piece, the shorter the time).
The larger the agar piece, the longer the time taken for the colour to change completely.
Walkthrough
A trend is a pattern across all the data, not just one result. Your table shows A (largest) slowest and C (smallest) fastest, so two statements earn the two marks: first name the extreme (A took longest), then generalise — as piece size increases, time taken increases. The reverse statement (smaller = faster) scores equally (ORA).
Key Takeaways
- Describe trends by naming the direction of the relationship, ideally with the extreme values as evidence.
- The acid must diffuse through the whole piece, so a larger piece takes longer.
Common Mistakes
- Giving only one result ('A took longest') without the general relationship — that is one mark, not two.
- Saying 'bigger pieces have a bigger surface area so change faster' — the data show the opposite.
Things to Be Careful About
- The trend is about TIME TAKEN, not about amount of colour change; keep the wording tied to time.
Use your results to suggest why typical animal cells are rarely larger than in diameter.
______
Answer
- In small cells, movement of substances (e.g. oxygen, carbon dioxide, waste products) in and out is rapid / fast enough to meet the cell's needs.
- This movement is by diffusion.
Small cells allow rapid diffusion of substances such as oxygen and carbon dioxide in and out; large cells could not be supplied fast enough.
Walkthrough
The agar models a cell: the acid is a substance diffusing in from outside. Your results showed that the bigger the 'cell', the slower the centre is reached. Apply that to real cells: a cell larger than about 0.1 mm across could not get oxygen in, or carbon dioxide and waste out, quickly enough by diffusion to stay alive — the middle of the cell would be starved or poisoned. So cells stay small so that diffusion distances are short and exchange is fast. Both halves are needed: the rapid movement in small cells AND the word 'diffusion'.
Key Takeaways
- Diffusion rate limits cell size; small size keeps diffusion distances short.
- Named substances that diffuse: oxygen, carbon dioxide, waste products, ions, hormones.
Common Mistakes
- Omitting the word 'diffusion' — the mark scheme underlines it, so a vague 'movement of substances' alone loses the mark.
- Saying substances are 'pumped in' (active transport) — the question is about the size limit set by diffusion.
Things to Be Careful About
- Name at least one substance (oxygen or carbon dioxide) to make the answer concrete; the scheme accepts any small diffusible molecule.
Fig. 1.2 shows two onion epidermal cells as seen with a microscope. Cell E had been placed in water, and cell F shows a similar cell that had been placed in a concentrated salt solution for the same length of time.
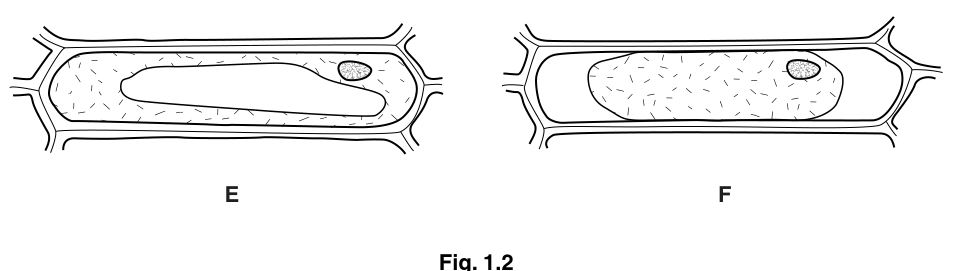
Describe how cell F differs in appearance from cell E.
______
Answer
- In cell F the cell membrane and cytoplasmic contents are pulled away from the cell wall.
- The cytoplasm has shrunk / is smaller, and the vacuole can no longer be seen (the cell is plasmolysed).
In cell F the membrane and contents have shrunk away from the cell wall; the vacuole is not visible and the cytoplasm is smaller (plasmolysed).
Walkthrough
Compare the two drawings point by point. Cell E is turgid: the cytoplasm and its large vacuole press against the cell wall. Cell F has clearly pulled inwards — there is a gap between the cell wall and the shrunken contents. Two descriptive marks: contents/membrane pulled away from the wall, and the shrunken cytoplasm / vacuole no longer visible. The word 'plasmolysed' is accepted but describing the appearance is what is asked.
Key Takeaways
- Plasmolysis is seen as the contents shrinking away from a wall that does not shrink.
- Describe what is visible, not the mechanism, for a 'describe' question.
Common Mistakes
- Saying 'the cell wall has shrunk' — the wall is rigid and keeps its shape; it is the contents that shrink.
- Explaining osmosis here — explanation belongs in (c)(ii), not the description.
Things to Be Careful About
- Give two distinct observations; repeating the same point in different words earns only one mark.
Suggest an explanation for the appearance of cell F.
______
Answer
- Water moves out of / exits the cell.
- By osmosis.
- The salt solution outside has a lower water potential (more concentrated) than the cell contents, so there is a water potential gradient.
- The cell membrane is partially permeable.
- Loss of water causes the vacuole and cytoplasm to shrink and pull away from the wall — plasmolysis.
Water leaves the cell by osmosis, down the water potential gradient from the cell (higher water potential) to the concentrated salt solution (lower water potential), through the partially permeable membrane, so the contents shrink away from the wall (plasmolysis).
Walkthrough
Build the explanation in the order the marks sit. The salt solution is concentrated, so it has a LOWER water potential than the cell sap. Water always moves by osmosis from higher to lower water potential, across the partially permeable membrane — so water leaves the cell. As the vacuole loses water it shrinks, the cytoplasm follows it, and because the cellulose cell wall is rigid it does not shrink, so the contents pull away from it: plasmolysis. Every technical term — osmosis, water potential, partially permeable — is a marking point.
Key Takeaways
- Osmosis: water moves from higher to lower water potential through a partially permeable membrane.
- A concentrated solution has a lower water potential than a dilute one.
- Plasmolysis = shrinkage of protoplast away from a rigid cell wall after water loss.
Common Mistakes
- Saying water moves from a 'low concentration of water' or 'strong solution to weak solution' — the required term is water potential.
- Writing 'the salt moves into the cell' — salt ions do not cause the change; water leaves.
- Confusing osmosis with diffusion of solute or with active transport.
Things to Be Careful About
- The mark scheme caps this at 4 (max 4), so four well-chosen linked points are enough; the gradient statement needs the direction (lower water potential outside).
Describe an investigation you could carry out to determine the concentration of salt solution that causes fresh onion epidermal cells to become like cell F.
______
Answer
- Prepare a range of at least three (e.g. five) salt solutions of different, stated concentrations (e.g. 0.1, 0.2, 0.3, 0.4, 0.5 mol per dm).
- Place equal-sized pieces of epidermis from the same fresh onion into each solution for the same length of time, at the same temperature.
- Mount each piece on a slide and examine it with a microscope.
- Count the number (or percentage) of plasmolysed cells in each piece.
- The concentration at which cells first become plasmolysed (e.g. where 50% of cells are plasmolysed, read from a graph of percentage plasmolysis against concentration) is the concentration required.
See working — plan using a range of salt concentrations, controlled variables, microscope observation and counting plasmolysed cells to find the concentration that causes plasmolysis.
Walkthrough
A planning answer is marked against categories, so hit each one. (1) Independent variable: a RANGE of at least three different salt concentrations, with actual values stated for extra credit. (2) Controlled variables: same onion, same-sized epidermis pieces, same immersion time, same temperature — the scheme gives two marks for these, so name at least two. (3) Method of observation: use a microscope to look at the cells. (4) Data handling: count how many cells are plasmolysed in each concentration, and use the results — e.g. plot percentage plasmolysed against concentration and read off the concentration giving 50% plasmolysis — to identify the threshold concentration.
Key Takeaways
- A good plan names the independent variable with a range, the controls, the measuring method and how the data answer the question.
- Counting the percentage of plasmolysed cells is more reliable than judging a single cell.
Common Mistakes
- Using only one concentration — no range means no comparison and marks are lost.
- Forgetting to state how the result identifies the concentration (the 'handling of data' mark).
- Not controlling time or temperature, so differences could have other causes.
Things to Be Careful About
- The scheme awards two marks for controlled variables stated together ('same onion / same time / same temperature / same sized piece'), so list at least two explicitly.
The rest of this paper
1 more questions- Q2Microscopy and Biological Drawing · Experimental Contexts · Use of Techniques, Apparatus and Materials · Observations and Measurements · Analysis, Conclusions and Evaluation21M