Biology 5090/32 — October/November 2015
Cambridge O-Level · Practical Test · worked solutions for every part, with the mark scheme
Topics Experimental Contexts · Use of Techniques, Apparatus and Materials · Observations and Measurements · Microscopy and Biological Drawing · Analysis, Conclusions and Evaluation
You are going to investigate the effect of fruit juice on potato. Fruit juice contains a lot of sugar.
You are provided with four solutions of fruit juice, A, B, D and E. Each solution contains fruit juice in the quantities shown in Table 1.1.
Pieces of potato tissue were cut from fresh potatoes to measure and placed in each of these solutions.
Complete Table 1.1 to include the volumes of concentrated fruit juice and water that you will need to prepare of solution C.
Table 1.1
| solution | volume of fruit juice / | volume of water / | percentage fruit juice in solution |
|---|---|---|---|
| A | 0 | 100 | 0 |
| B | 25 | 75 | 25 |
| C | 50 | ||
| D | 75 | 25 | 75 |
| E | 100 | 0 | 100 |
- Prepare of solution C in container C.
You have been provided with a piece of fresh potato covered by plastic film.
- Remove the plastic film and place the piece of potato on the white tile.
- Use the sharp knife provided to cut a strip of potato tissue measuring .
- Add this piece to solution C and leave for 20 minutes.
Record the time that the piece was added to the solution.
______
Answer
| solution | volume of fruit juice / | volume of water / | percentage fruit juice in solution |
|---|---|---|---|
| C | 50 | 50 | 50 |
50 cm3 fruit juice and 50 cm3 water (50 : 50)
Walkthrough
The table shows a dilution series in which the percentages of fruit juice are 0, 25, 50, 75 and 100, and every solution is made up to a total of 100 cm. For solution C the percentage fruit juice is 50, so half of the 100 cm must be juice and half must be water: 50 cm of each. Check the pattern: solution B is 25 + 75 = 100, solution D is 75 + 25 = 100, so C must be 50 + 50 = 100.
Key Takeaways
- In a dilution series the volumes of the two components always add up to the total volume.
- The percentage of one component equals its volume divided by the total volume, multiplied by 100.
Common Mistakes
- Writing 50 cm of juice but forgetting the water column, or writing 100 cm of water.
- Misreading the percentage column and giving 25 cm of each (that is solution B's pattern).
Things to Be Careful About
- The mark scheme wants the answer written into Table 1.1 — both cells, juice and water, each worth part of the single mark.
- Keep the units as printed in the column headers; do not repeat units inside the cells.
- Remove the piece of potato from solution A and dry carefully with a paper towel.
Measure the length of the piece of potato and record this in Table 1.2.
Put the piece of potato back into solution A.
- Repeat this procedure for the pieces of potato in solutions B, D and E.
Table 1.2
| solution | percentage fruit juice in solution | final length of potato tissue / | change in length of potato tissue / |
|---|---|---|---|
| A | 0 | ||
| B | 25 | ||
| C | 50 | ||
| D | 75 | ||
| E | 100 |
When the 20 minutes have passed, repeat this procedure with the piece of potato in solution C. Record your result in Table 1.2.
Answer
Record the final length of each potato strip (measured to the nearest mm) in the 'final length of potato tissue / ' column of Table 1.2 for solutions A, B, C, D and E. Values will depend on the candidate's own measurements; strips in dilute juice (A, B) are expected to be longer than 60 mm and strips in concentrated juice (D, E) shorter than 60 mm.
Candidate's own measured final lengths for all five solutions, recorded in mm in Table 1.2
Walkthrough
This is a candidate-dependent measurement task: you remove each strip, blot it dry with a paper towel (so surface liquid does not affect the reading), measure its length with a ruler to the nearest millimetre, and write the value in Table 1.2. The mark scheme awards the marks for all five measurements being present and for the units being correct — the actual values depend on your own experiment. The expected pattern is that strips in water or dilute juice gain length (water enters by osmosis) and strips in concentrated juice lose length (water leaves by osmosis).
Key Takeaways
- Always dry a specimen before measuring it, so the reading reflects the tissue and not adhering liquid.
- Record every reading, even if a result looks unexpected — missing data loses marks.
Common Mistakes
- Omitting one of the five measurements (the scheme caps at 1 mark if units are wrong, and completeness is what is scored).
- Recording length in cm when the table header says / .
- Not drying the strip first, giving an inconsistent reading.
Things to Be Careful About
- The table header already carries the unit (/ ), so write numbers only in the cells.
- Measure along the original 60 mm dimension, not the width or thickness.
Calculate the changes in length to complete Table 1.2.
Working
For each solution:
Answer
Subtract the original 60 mm from each final length and record the result in the 'change in length' column, using a minus sign for a decrease (e.g. final length 64 mm gives ; final length 55 mm gives ). Values depend on the candidate's measurements in (b)(i).
Change in length = final length − 60 mm, with minus signs for decreases, for all five solutions
Walkthrough
The original length of every strip was 60 mm, so the change is simply the final length minus 60. If the strip got longer, the change is positive; if it got shorter, the change is negative and the minus sign must be written. The mark scheme gives 2 marks for all five correct calculations and 1 mark for four correct, plus a separate mark for using minus signs where appropriate — so the sign is worth real marks, not just style.
Key Takeaways
- 'Change' = final value − original value, and the sign carries biological meaning (gain or loss of water).
- A negative change here means water has left the potato tissue by osmosis.
Common Mistakes
- Calculating 60 − final length instead, which reverses all the signs.
- Omitting minus signs for decreases — the scheme awards a specific mark for them.
- Writing 'decrease of 5 mm' instead of the signed number −5.
Things to Be Careful About
- Use the candidate's own final lengths from (b)(i); an error carried forward from a wrong measurement still earns the calculation mark.
- Keep the unit consistent — the column header already says / .
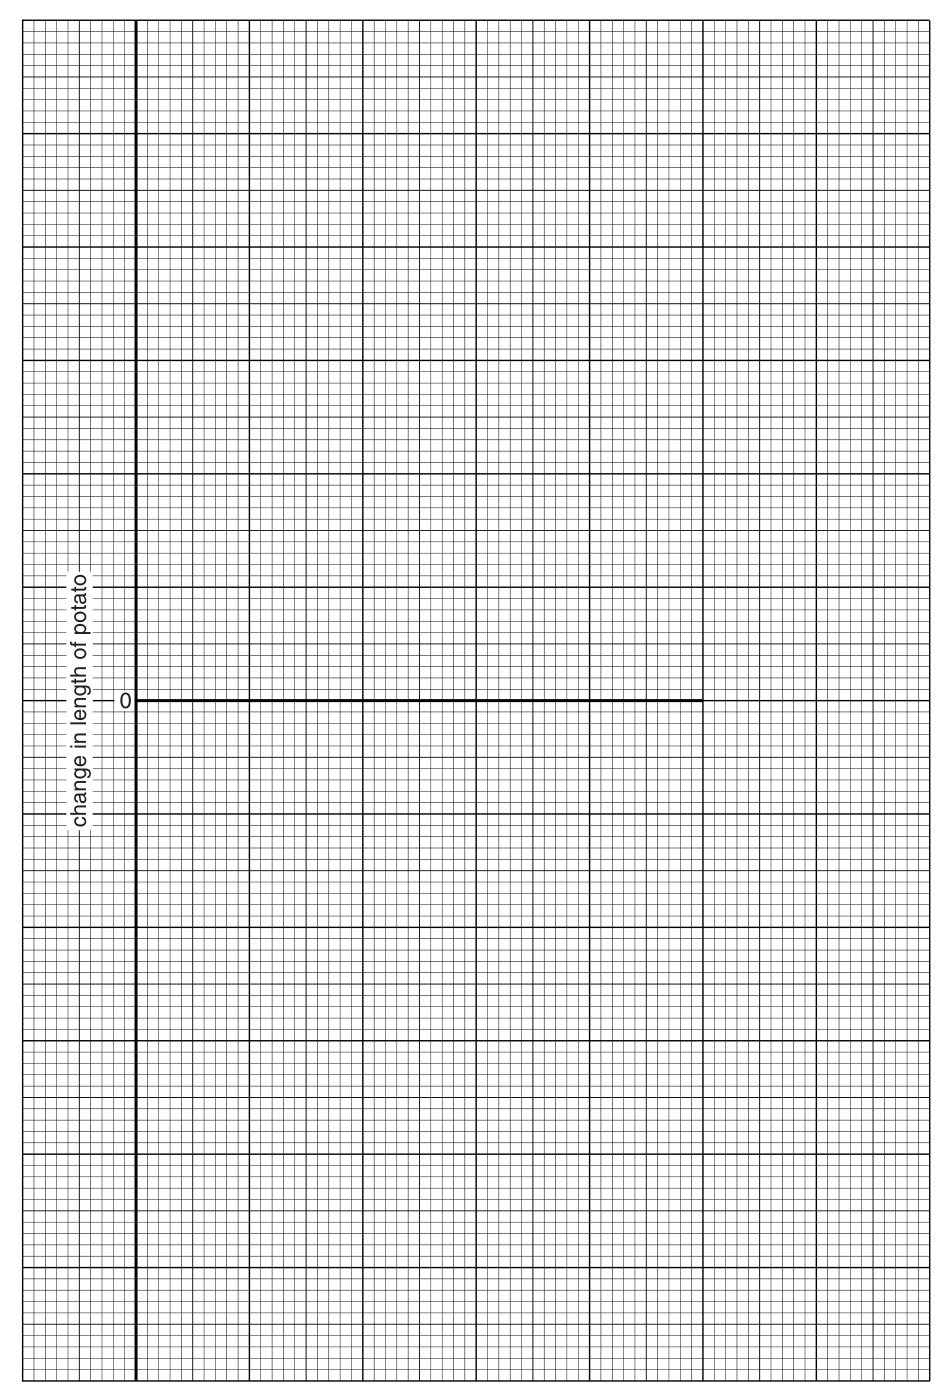
Construct a graph to show the effect of fruit juice concentration on change in length of the potato tissue.
Complete the labelling of the axes.
Answer
- x-axis: label 'concentration of fruit juice / %' with a linear scale 0–100 using at least half the grid.
- y-axis: complete the label to 'change in length of potato / mm' and add negative values below zero, with a linear scale using at least half the grid in both directions.
- Plot all five points (0, 25, 50, 75, 100 %) accurately and make them clearly visible.
- Join the plots with ruled straight lines (or draw a smooth curve through all plotted points); do not extrapolate beyond the plotted points.
Completed line graph: x-axis 'concentration of fruit juice / %', y-axis 'change in length of potato / mm' with negative values, five correct plots joined by ruled lines or a smooth curve
Walkthrough
The printed grid already gives you the y-axis label 'change in length of potato' and a zero on that axis. Your jobs are: (1) finish the y-axis label with its unit, / mm, and label the x-axis 'concentration of fruit juice / %'; (2) choose linear scales — equal steps per square — with numbers written at regular intervals, and because change in length can be negative (strips shrink in strong juice), the y-axis must show negative values below zero; (3) make the plotted line use at least half of the grid in both directions so the trend is easy to read; (4) plot all five points precisely and visibly; (5) join them with ruled straight lines or one smooth curve. 5090 accepts either joining style but never extrapolation past the last point.
Key Takeaways
- Every axis label needs the quantity AND its unit in slash form: 'concentration of fruit juice / %'.
- Data that can be negative needs negative values on the axis.
- Scales must be linear (never 0, 10, 30, 60) and the plot must fill at least half the grid.
Common Mistakes
- Forgetting the '/' unit on either axis label — a whole mark point.
- Omitting negative values on the y-axis, so shrinking strips cannot be plotted.
- Using an awkward non-linear scale or cramming the plot into a corner of the grid.
- Joining the points with a jagged freehand line instead of ruled lines or a smooth curve.
- Extrapolating the line beyond 0% or 100%.
Things to Be Careful About
- The scheme lists five separate marks — check each one off before moving on.
- Plots must sit within half a small square of the true position.
- Points must be visible — small neat crosses or dots that are not smudged.
Suggest what has happened to the potato tissue in the different solutions that has resulted in the changes in length.
Answer
- Water moves into or out of the potato tissue by osmosis, through the partially permeable cell membranes.
- In solutions A and B (0% and 25% fruit juice) the solution has a higher water potential than the potato cells, so water is taken up and the strips increase in length.
- In solutions D and E (75% and 100% fruit juice) the solution has a lower water potential than the potato cells (the sugar lowers the water potential), so water is lost and the strips decrease in length.
- In solution C (50%) the water potential inside and outside the cells is about equal, so there is no net movement of water and no change in length.
Water moves by osmosis through partially permeable membranes; uptake of water in dilute juice (A, B) increases length, loss of water in concentrated juice (D, E) decreases length, no net movement at about 50%
Walkthrough
Potato cells have cell membranes that are partially permeable, and the cell sap inside them contains dissolved solutes. Fruit juice contains a lot of sugar, which lowers the water potential of a solution. Water always moves by osmosis from a higher water potential to a lower water potential across a partially permeable membrane.
- In water and dilute juice (A, B) the outside solution has the higher water potential, so water enters the cells; the cells become turgid and the strips lengthen.
- In concentrated juice (D, E) the sugar makes the outside water potential lower than the cell sap, so water leaves; the cells lose turgor and the strips shorten.
- Around 50% the two water potentials are roughly equal, so there is no net water movement and no change in length — this is the point where the graph crosses zero.
The mark scheme insists the uptake and loss of water are 'qualified against results' — you must tie each statement to the actual changes in length you measured, not just state the theory.
Key Takeaways
- Osmosis is the movement of water from a region of higher water potential to a region of lower water potential through a partially permeable membrane.
- Dissolved sugar lowers water potential, so the more concentrated the juice, the more water leaves the potato.
- The concentration at which the graph crosses zero is where the solution's water potential equals that of the potato cell sap.
Common Mistakes
- Writing 'water moves from a dilute to a concentrated solution' without naming osmosis or the partially permeable membrane — the scheme awards separate marks for 'movement of water', 'osmosis' and 'partially permeable membrane'.
- Saying water moves to 'the stronger solution' without linking it to water potential or to the results.
- Describing diffusion of sugar into the potato instead of movement of water.
- Giving theory with no reference to which solutions gained or lost length ('qualified against results' is required).
Things to Be Careful About
- Use the exact terms: osmosis, partially permeable membrane, water potential.
- Every direction statement must name the solutions and what happened to their lengths.
- 'No change' scores only when explained as no net water movement at equal water potential.
Suggest three improvements you could make to the method used to improve the reliability of this investigation.
- ______
- ______
- ______
Answer
Any three of:
- Leave the potato strips in the solutions for longer than 20 minutes (and for the same length of time in each solution).
- Repeat the investigation with several strips in each solution and calculate a mean.
- Take all strips from the same type of potato.
- Cut all strips to the same thickness / surface area / cross-sectional area.
- Use smaller increments of fruit juice concentration between 0% and 100%.
Any three: longer/equal immersion time; repeats with a mean; same type of potato; same strip dimensions; smaller concentration increments
Walkthrough
Reliability means the results are repeatable and the trend is trustworthy. Each improvement must target a specific weakness of the method:
- Longer, equal immersion time — 20 minutes may not be enough for osmosis to reach a measurable equilibrium, and unequal times would make the comparison unfair.
- Repeats and a mean — a single strip per solution could be anomalous; averaging several strips smooths out biological variation.
- Same type of potato — different potatoes have different cell sap concentrations, so results would not be comparable.
- Same strip dimensions — a thicker or wider strip has different surface-area-to-volume characteristics and gives a different length change.
- Smaller concentration increments — more points on the graph locate the zero-change concentration more precisely.
Key Takeaways
- A valid improvement names what is changed AND why it helps; vague answers like 'be more careful' or 'avoid human error' score nothing.
- Reliability is about repeats and consistency; accuracy is about measuring correctly.
Common Mistakes
- Writing 'repeat the experiment' without adding 'and calculate a mean' — the scheme links the two with a '+' so both halves are needed.
- Vague answers rejected by the scheme's spirit: 'to avoid mistakes', 'be more accurate'.
- Suggesting improvements that change the investigation rather than improve it (e.g. using a different vegetable).
Things to Be Careful About
- Give exactly three improvements — the scheme allows max 3.
- Each point must be a distinct idea; repeating the same idea in different words does not earn a second mark.
The rest of this paper
2 more questions- Q2Microscopy and Biological Drawing · Experimental Contexts · Use of Techniques, Apparatus and Materials · Observations and Measurements14M
- Q3Microscopy and Biological Drawing · Experimental Contexts7M