Biology 5090/31 — October/November 2015
Cambridge O-Level · Practical Test · worked solutions for every part, with the mark scheme
Topics Observations and Measurements · Analysis, Conclusions and Evaluation · Microscopy and Biological Drawing · Experimental Contexts · Planning Experiments and Investigations · Use of Techniques, Apparatus and Materials
You are going to investigate the effect of adding an enzyme to crushed fruit.
In each container, labelled W1 and W2, there is of crushed fruit.
- Carefully pour the contents of the test-tube labelled 'water' into the container labelled W1. Stir with the spoon provided.
- Carefully pour the contents of the test-tube labelled 'enzyme' into the container labelled W2. Stir with the other spoon provided.
Leave W1 and W2 to stand for 10 minutes.
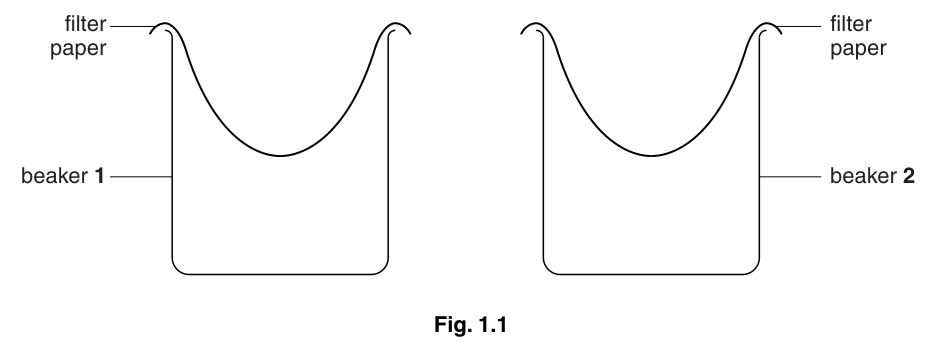
While waiting, set up the filters as shown in Fig. 1.1, using the beakers labelled 1 and 2 and the filter paper provided. If time allows, continue with part (b) of this question.
After 10 minutes
- Pour the contents of container W1 into the filter paper supported in beaker 1.
- Pour the contents of container W2 into the filter paper supported in beaker 2.
Note the time ______
Leave the crushed fruit to filter for five minutes.
After five minutes, remove the filter papers and their contents and discard in containers W1 and W2.
Complete Table 1.1 by measuring and recording the volumes of the juices you have collected, and noting their appearance.
Table 1.1
| sample of juice | volume / | appearance |
|---|---|---|
| W1 | ||
| W2 |
The enzyme is used in the production of fruit juice on a large scale.
Use your results to suggest a reason why the enzyme is used.
______
Suggest why water was added to W1.
______
Explain why the contents of the beakers were stirred.
______
State three variables that need to be kept constant during this investigation.
- ______
- ______
- ______
Suggest three ways in which you could extend and improve this investigation.
- ______
- ______
- ______
Fig. 1.2 shows half of a fresh apricot.
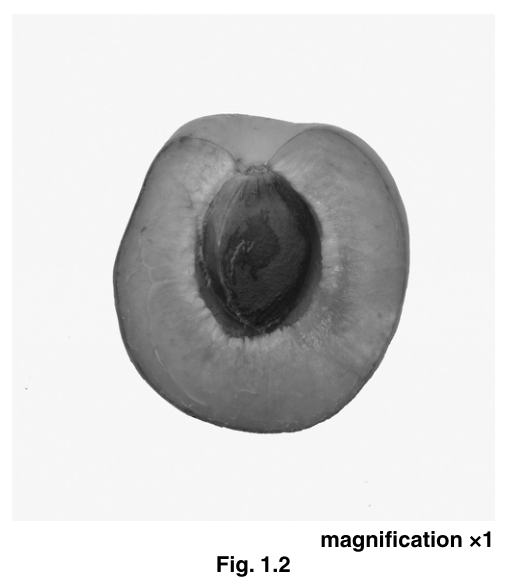
Make a drawing of this fruit, twice the size of the actual fruit.
On your drawing, indicate where the fruit was attached to the parent plant using the letter P.
Ripe fruits contain reducing sugars.
Describe how you could test a sample of fruit to show that it contains reducing sugars. Include one safety feature in your method.
Describe how you could use this test to compare the reducing sugar content of your juice, W1, and the juice of an apricot.
Fruits, such as apricots, can be preserved by drying them in the sun.
Some students investigated the changes in mass of some fruits as they were left to dry over five days. The results are shown in Table 1.2.
Table 1.2
| time / days | mass / | total loss in mass / |
|---|---|---|
| 0 | 30.0 | 0.0 |
| 1 | 22.5 | 7.5 |
| 2 | 17.0 | 13.0 |
| 3 | 12.0 | 18.0 |
| 4 | 8.5 | |
| 5 | 7.0 |
Calculate the total loss in mass / for days 4 and 5 and complete Table 1.2.
Construct a graph to show the total loss in mass of the fruits with time.

Suggest why drying fruit helps to preserve it.
______
The rest of this paper
1 more questions- Q2Microscopy and Biological Drawing · Observations and Measurements · Analysis, Conclusions and Evaluation8M