Biology 5090/61 — October/November 2014
Cambridge O-Level · Alternative to Practical · worked solutions for every part, with the mark scheme
Topics Experimental Contexts · Planning Experiments and Investigations · Observations and Measurements · Analysis, Conclusions and Evaluation · Use of Techniques, Apparatus and Materials · Microscopy and Biological Drawing
Some students investigated the effect of two solutions, ethanol and sucrose, on the respiration of yeast.
Yeast, a type of fungus, can respire anaerobically. This is called fermentation and results in the formation of ethanol (alcohol) and carbon dioxide.
glucose ethanol + carbon dioxide
Three beakers, labelled A, B and C, were used. Each beaker contained of active yeast mixture (a mixture of yeast in glucose solution). A different solution was then added to each beaker, as shown in Fig. 1.1.
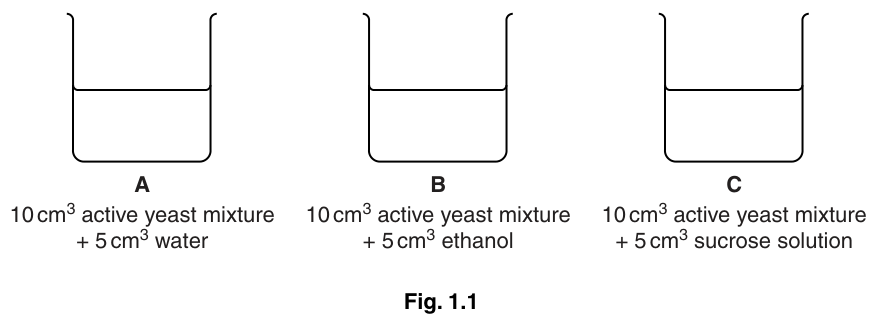
A syringe labelled A was filled with of mixture from beaker A.
A syringe labelled B was filled with of mixture from beaker B.
A syringe labelled C was filled with of mixture from beaker C.
A narrow glass tube, with an ink mark close to one end, was attached to each syringe (using a small piece of flexible tubing) as shown in Fig. 1.2.
The plunger of each syringe, A, B, and C, was pressed to bring the meniscus of the mixture to the level of the ink mark on the narrow tube, as shown in Fig. 1.2.
The time was noted. This was the start time, .
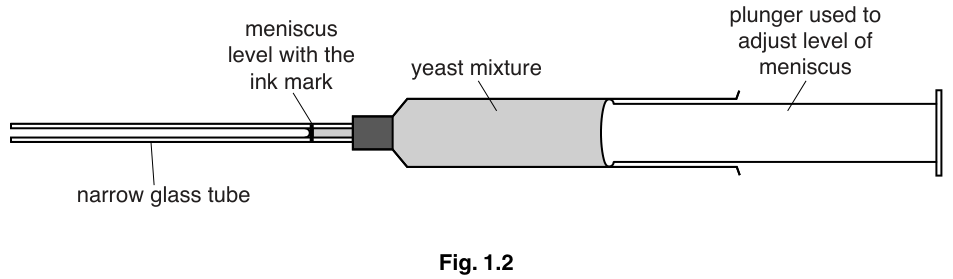
As the actively respiring yeast released carbon dioxide, the volume of the mixture increased and the meniscus moved along the narrow glass tube to the left.
After , and , the distance moved by the meniscus was measured, in , and recorded for each tube.
Table 1.1 was drawn to record the results of the investigation.
Table 1.1
| distance meniscus moved / | |||
|---|---|---|---|
| B | |||
| 0 | |||
| 10 | |||
| 15 | |||
| 20 |
Complete the headings of Table 1.1.
Answer
| distance meniscus moved / | |||
|---|---|---|---|
| tube | A | B | C |
| time / min |
The two missing headings are: the first column heading time / min, and a heading row naming tubes A, B and C.
Headings completed: 'A, B, C' for the three columns of meniscus movement, and 'time / min' for the first column.
Walkthrough
Table 1.1 as printed has an empty first column (which will hold the times 0, 10, 15, 20) and three empty columns for the readings from tubes A, B and C. A well-constructed table must say what is in each column, so the first column needs the heading 'time / min' — note that 5090 insists on the unit written after a slash, and rejects abbreviations like 'm'. The three result columns need to be identified by which syringe they came from, so they are headed A, B and C.
Key Takeaways
Every results table needs a heading for each column or row stating the quantity AND its unit, written in slash form (e.g. time / min). Never use 'm' for minutes.
Common Mistakes
Writing 'm' instead of 'min' — the mark scheme explicitly rejects this ('R m'). Writing 'time' without the unit also loses the mark.
Things to Be Careful About
The unit goes after a slash in the heading itself; do not write units inside every cell of the table.
The following results were recorded by the students.
In the tube attached to syringe A, the meniscus had moved after , by a further after , and a further after .
In the tube attached to syringe B, the meniscus had moved after , did not move any further between and , and then moved a further after .
In the tube attached to syringe C, the meniscus had moved after , moved to after and to after .
Complete Table 1.1 using this information.
Answer
| time / min | A | B | C |
|---|---|---|---|
| 0 | 0 | 0 | 0 |
| 10 | 8 | 1 | 10 |
| 15 | 10 | 1 | 15 |
| 20 | 12 | 2 | 22 |
See working
Walkthrough
The zero row is 0 everywhere because at the start time the meniscus was set level with the ink mark. For tube A the students reported the movement 'a further 2 mm' each time, so the values are cumulative: 8, then 8 + 2 = 10, then 10 + 2 = 12. Tube B moved 1 mm, then not at all, then a further 1 mm: 1, 1, 2. Tube C was described as moving TO 15 mm and TO 22 mm, so those are already totals: 10, 15, 22.
Key Takeaways
Read carefully whether data are given as increments ('a further ...') or as running totals ('moved to ...'), and record them consistently in the table.
Common Mistakes
Entering A's values as 8, 2, 2 instead of adding them up cumulatively; entering C's values as 10, 5, 7 by subtracting instead of using the totals given.
Things to Be Careful About
The wording differs between tubes deliberately — 'a further' means add on, 'moved to' means it is already the total.
Describe the effect of ethanol on the movement of the meniscus in tube B and suggest an explanation for this effect.
description = ______
explanation = ______
Answer
description = very little / almost no movement of the meniscus in tube B.
explanation = the ethanol inhibited or killed the yeast, so little or no anaerobic respiration occurred and little or no was produced.
description = no/very slight movement of the meniscus; explanation = ethanol inhibits/kills the yeast so little/no CO2 is produced.
Walkthrough
Tube B contained yeast plus ethanol. Its meniscus moved only 1 mm in 20 minutes, compared with 12 mm in tube A — so the description is 'very little or no movement'. The explanation uses fermentation biology: the volume only rises because respiring yeast releases carbon dioxide gas. Ethanol is toxic to yeast at this concentration, so it inhibits or kills the cells; respiration slows or stops, little carbon dioxide is made, and the meniscus barely moves.
Key Takeaways
In this apparatus, meniscus movement is a direct measure of carbon dioxide production, which is a measure of the rate of anaerobic respiration (fermentation).
Common Mistakes
Describing without explaining, or explaining vaguely ('the yeast didn't work'). The mark scheme wants the link: ethanol → yeast inhibited/killed → respiration decreases/stops → little/no CO₂.
Things to Be Careful About
Both halves — description AND explanation — are needed; each carries one mark.
Describe the effect of sucrose solution on the movement of the meniscus in tube C and suggest an explanation for this effect.
description = ______
explanation = ______
Answer
description = the meniscus moved further / faster than in tube A (22 mm in 20 minutes).
explanation = the sucrose provided more sugar substrate for respiration, so respiration (fermentation) increased and more was produced.
description = movement increases/most movement; explanation = more substrate/sugar for respiration, so more CO2 produced.
Walkthrough
Tube C's meniscus travelled 22 mm in 20 minutes — nearly twice tube A's 12 mm — so sucrose increased the rate of movement. The explanation: sucrose is a sugar, so it supplies extra substrate for anaerobic respiration. With more glucose available (after sucrose is broken down), the yeast ferments faster and releases more carbon dioxide, pushing the meniscus further along the narrow tube.
Key Takeaways
Adding sugar substrate increases the rate of fermentation because substrate concentration limits the reaction rate when enzyme (yeast) supply is constant.
Common Mistakes
Saying 'sucrose gives energy' without linking it to respiration rate and CO₂ production; describing the trend without any explanation.
Things to Be Careful About
The accepted explanations include 'more substrate', 'increases respiration/fermentation' or 'more CO₂ produced' — any one scores, but it must be a reason, not a restatement.
Explain why syringe A was included in this investigation.
______
Answer
Syringe A acted as a control, providing a comparison to show the effect of adding ethanol or sucrose (against water).
As a control, for comparison.
Walkthrough
Beaker A had only water added, so nothing extra was supplied to the yeast. This makes it the control: the normal rate of fermentation with just glucose. Comparing B and C against A shows whether ethanol slowed respiration (B moved less than A) and whether sucrose sped it up (C moved more than A). Without A you could not tell how much of the movement in B or C was due to the added solution rather than the yeast alone.
Key Takeaways
A control provides a baseline under unchanged conditions so the effect of the independent variable can be judged by comparison.
Common Mistakes
Saying 'to make it fair' without saying what it is compared against; confusing a control with controlled variables.
Things to Be Careful About
Two marks: name it as a control, then give the purpose (comparison). Both are needed.
Name two variables that were kept constant during this investigation.
- ______
- ______
Answer
- volume of active yeast mixture ( in each beaker)
- total volume of mixture / volume of added substance ()
(also credited: bore/diameter of the glass tubing; starting position of the meniscus)
Any two of: volume of active yeast; total volume of mixture/volume of added substance; bore/diameter of tubing; meniscus starting point.
Walkthrough
A controlled variable is one kept the same across all tubes so it cannot affect the comparison. From the method: every beaker got 10 cm³ of the same active yeast mixture; every beaker got 5 cm³ of added liquid, making 15 cm³ total; identical narrow glass tubes were used, so their bore was the same; and the plunger set every meniscus to the ink mark, so all started at the same point. Any two of these score. Note the scheme ignores temperature, pH, pressure and light here — they were not mentioned as being controlled in this procedure.
Key Takeaways
Quote variables from the actual method, ideally with the quantities given, rather than listing generic laboratory conditions.
Common Mistakes
Naming temperature or pH — ignored here because the method did not state they were controlled; naming the type of solution added, which was the independent variable, not constant.
Things to Be Careful About
Give exactly two variables; the added substance differed between tubes, but its VOLUME was constant — phrase it as volume, not identity.
Carbon dioxide is released during anaerobic respiration.
Describe a test for carbon dioxide.
______
Answer
Bubble the gas through limewater; the limewater turns from clear to cloudy (milky white), showing carbon dioxide is present.
Limewater turns cloudy/milky.
Walkthrough
The standard test for carbon dioxide is to bubble the gas through limewater (calcium hydroxide solution). If carbon dioxide is present, the clear limewater turns cloudy or milky white. The alternative accepted test is hydrogencarbonate indicator solution, which changes from red to yellow in carbon dioxide. Either reagent with its correct colour change earns both marks.
Key Takeaways
Learn tests as reagent + condition + colour change + conclusion. Limewater: clear → cloudy. Hydrogencarbonate indicator: red → yellow.
Common Mistakes
Naming limewater but omitting the colour change (or vice versa) — both halves carry one mark each; writing 'goes white' without saying the limewater starts clear.
Things to Be Careful About
Describe the change as clear to cloudy; 'milky' is accepted alternative wording.
The rest of this paper
2 more questions- Q2Microscopy and Biological Drawing · Experimental Contexts · Analysis, Conclusions and Evaluation · Observations and Measurements · Planning Experiments and Investigations16M
- Q3Experimental Contexts · Planning Experiments and Investigations9M