Biology 5090/62 — October/November 2013
Cambridge O-Level · Alternative to Practical · worked solutions for every part, with the mark scheme
Topics Experimental Contexts · Analysis, Conclusions and Evaluation · Observations and Measurements · Planning Experiments and Investigations · Use of Techniques, Apparatus and Materials · Microscopy and Biological Drawing
Some students investigated the effect of two sugars on the activity of yeast.
Solution A was of glucose in water.
Solution B was of sucrose in water.
Fig. 1.1 shows the apparatus that was used.
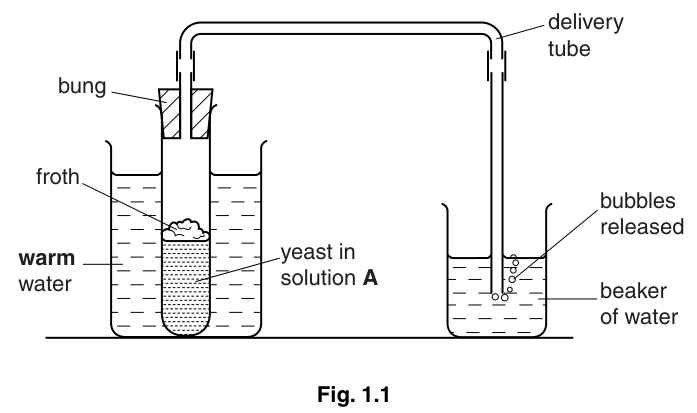
- of dried yeast was added to solution A in a test-tube and shaken, then left standing in a beaker of warm water for five minutes.
- The delivery tube was attached and the number of bubbles released in one minute was counted and recorded as 'first count' in Table 1.1.
- The test-tube containing the mixture was gently shaken again, while still in the beaker of warm water.
- The number of bubbles released was counted again for one minute and recorded as the 'second count' in Table 1.1.
- A third count was taken in the same way.
This whole procedure was repeated using another of dried yeast mixed with solution B.
The results were recorded as shown in Table 1.1.
Table 1.1
| solution | number of bubbles of gas released in one minute: first count | number of bubbles of gas released in one minute: second count | number of bubbles of gas released in one minute: third count |
|---|---|---|---|
| A glucose in water | 13 | 12 | 10 |
| B sucrose in water | 36 | 34 | 32 |
Using data from Table 1.1, describe what these results show about the effect of glucose and sucrose on the activity of yeast.
State the name of the gas that was released to form the bubbles.
______
Describe a simple test for the gas you have named.
State the name of the process that was taking place in the yeast to produce this gas.
______
Suggest why the yeast and sugar solution had to be left for 5 minutes.
Explain why the bubbles were counted three times for each solution.
Suggest why the test-tubes were shaken between the counts.
List the factors that were kept constant during this investigation.
Fig. 1.2 shows a yeast cell dividing.
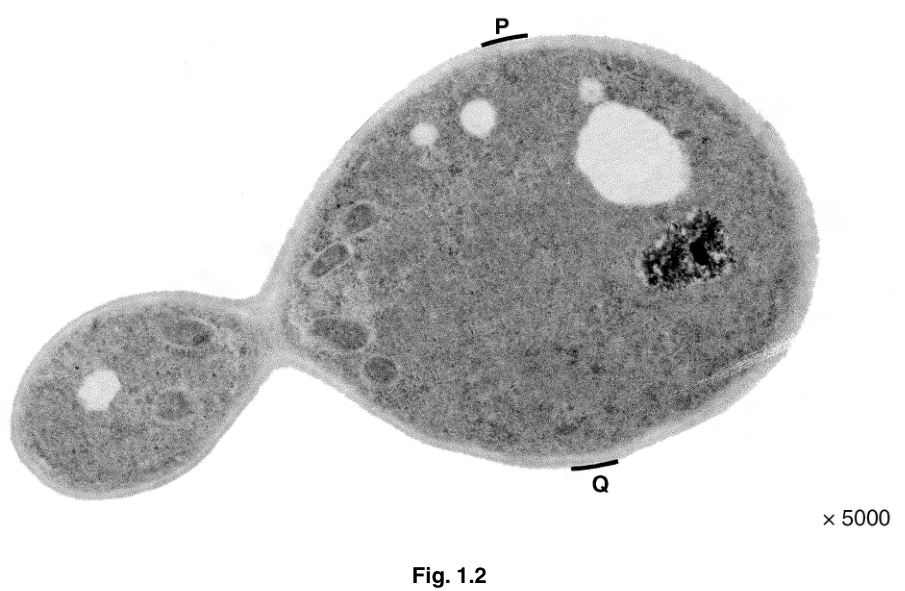
Make a drawing of the yeast cell dividing shown in Fig. 1.2.
On Fig. 1.2, draw a line between the letters P and Q.
Measure and record this length ______
On your drawing, draw a line similar to the line PQ.
Measure and record this length ______
Calculate the magnification of your drawing compared to the actual size of the cell.
Show your working.
magnification ______
The rest of this paper
2 more questions- Q2Observations and Measurements · Experimental Contexts · Use of Techniques, Apparatus and Materials · Planning Experiments and Investigations · Analysis, Conclusions and Evaluation12M
- Q3Observations and Measurements · Experimental Contexts · Analysis, Conclusions and Evaluation · Planning Experiments and Investigations7M