Biology 5090/32 — October/November 2013
Cambridge O-Level · Practical Test · worked solutions for every part, with the mark scheme
Topics Observations and Measurements · Experimental Contexts · Analysis, Conclusions and Evaluation · Planning Experiments and Investigations · Microscopy and Biological Drawing · Use of Techniques, Apparatus and Materials
You are going to investigate the effect of two sugars on the activity of yeast.
Solution A is of 10% glucose in water.
Solution B is of 10% sucrose in water.
The activity of the yeast will be measured by counting the number of bubbles of gas that are released from an open tube placed below the water surface in a beaker of water.
- Take one small packet containing of dried yeast. Empty the contents into the test-tube containing solution A.
- Carefully shake the test-tube and place it into the large beaker of warm water provided.
- After approximately 5 minutes, when the mixture begins to froth, attach the bung with the delivery tube.
- Insert the open end of the delivery tube into the small beaker of water provided.
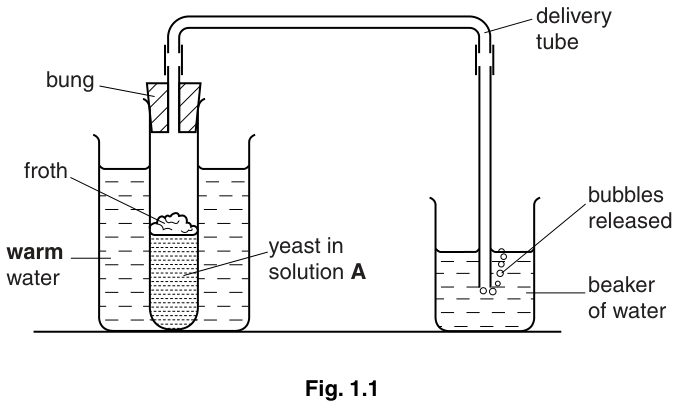
- Count the number of bubbles released from the open end of the tube in one minute, and record your first count in Table 1.1.
- Shake the test-tube containing the active yeast mixture gently, and then count the number of bubbles released for a further minute. Record this second count in Table 1.1.
- Repeat the whole procedure with the second packet of yeast and solution B.
Table 1.1
| solution | number of bubbles of gas released in one minute | |
|---|---|---|
| first count | second count | |
| A glucose in water | ||
| B sucrose in water |
Describe what your results show about the effect of glucose and sucrose on the activity of yeast.
State the name of the gas that was released to form the bubbles.
______
Describe a simple test for the gas you have named.
State the name of the process that was taking place in the yeast to produce this gas.
______
Suggest why the test-tubes were shaken between the two counts for each solution.
List the factors that were kept constant during this investigation.
Fig. 1.2 shows a yeast cell dividing.
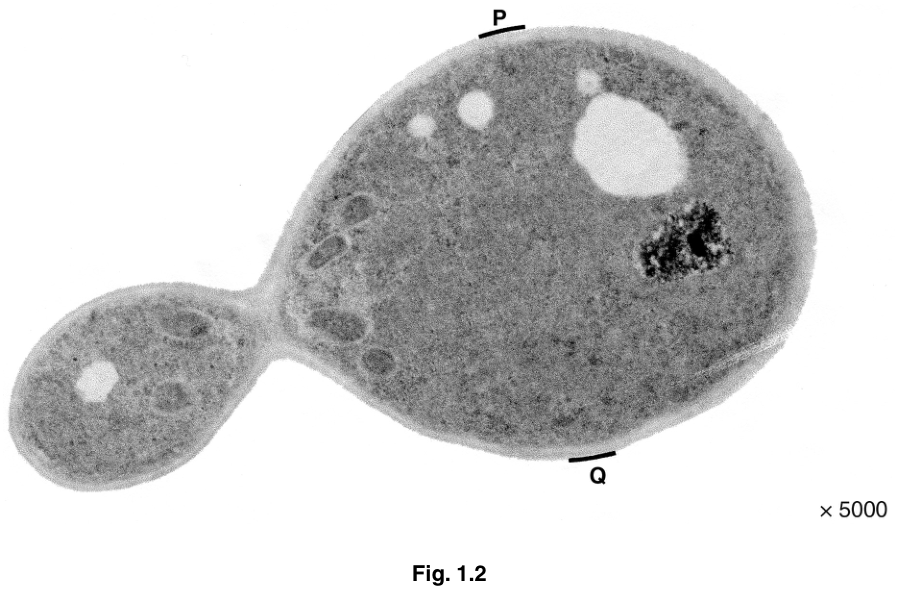
Make a drawing of the yeast cell dividing shown in Fig. 1.2.
On Fig. 1.2, draw a line between the letters P and Q.
Measure and record this length = ______
On your drawing, draw a line similar to the line PQ.
Measure and record this length = ______
Calculate the magnification of your drawing compared to the actual size of the cell.
Show your working.
magnification ______
The rest of this paper
2 more questions- Q2Observations and Measurements · Experimental Contexts · Microscopy and Biological Drawing · Planning Experiments and Investigations · Analysis, Conclusions and Evaluation12M
- Q3Observations and Measurements · Experimental Contexts · Analysis, Conclusions and Evaluation · Planning Experiments and Investigations7M