Biology 5090/62 — October/November 2012
Cambridge O-Level · Alternative to Practical · worked solutions for every part, with the mark scheme
Topics Experimental Contexts · Use of Techniques, Apparatus and Materials · Planning Experiments and Investigations · Analysis, Conclusions and Evaluation · Microscopy and Biological Drawing · Observations and Measurements
Starch is broken down into reducing sugars by the enzyme amylase.
Iodine solution is used to test for the presence of starch. When no starch is present the yellow brown iodine solution does not change colour. If starch is present the iodine solution turns blue-black.
Some students investigated the effect of sodium chloride on the breakdown of starch by amylase.
They used three test-tubes, A, B and C, as shown in Fig. 1.1.
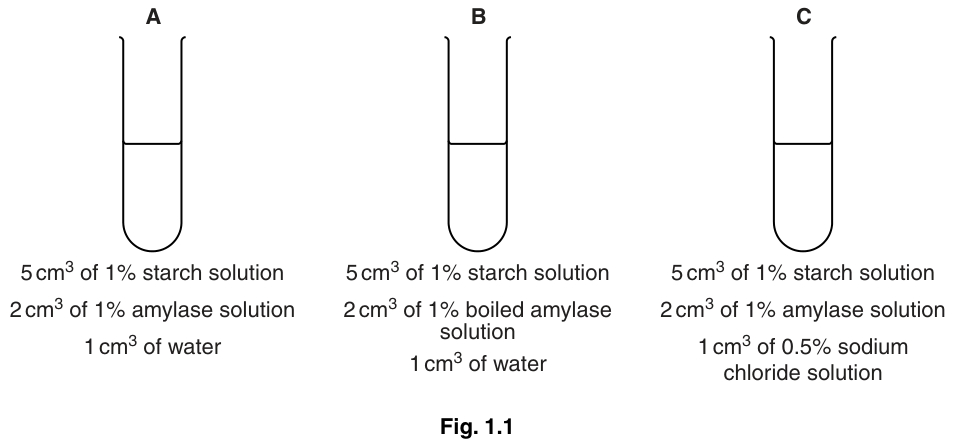
The contents in each test-tube were stirred. A drop of each mixture was taken every minute and added to yellow brown iodine solution placed as drops on a white tile.
The students recorded the colour of the drops in Table 1.1.
Table 1.1
| time / mins | test-tube A | test-tube B | test-tube C |
|---|---|---|---|
| 0 | black | black | black |
| 1 | black | black | dark brown |
| 2 | black | black | dark brown |
| 3 | dark brown | black | lighter brown |
| 4 | dark brown | black | lighter brown |
| 5 | dark brown | black | yellow brown |
| 6 | light brown | black | yellow brown |
| 7 | lighter brown | black | yellow brown |
| 8 | lighter brown | black | yellow brown |
| 9 | lighter brown | black | yellow brown |
| 10 | yellow brown | black | yellow brown |
State how long it took for the starch to be completely broken down in test-tubes A and C.
test-tube A = ______
test-tube C = ______
Describe the effect of sodium chloride on the breakdown of starch by amylase.
Explain why the following procedures were carried out
using a white tile,
stirring the contents of each test-tube,
of water was added to test-tubes A and B.
of 1% starch was added to all of the test-tubes,
using test-tube B.
Some students carried out an investigation on the effect of pH on the activity of amylase. The results are shown in Table 1.2.
Table 1.2
| pH | time taken to break down starch / minutes |
|---|---|
| 3 | 20 |
| 4 | 13 |
| 5 | 3 |
| 6 | 7 |
| 7 | 12 |
| 8 | 22 |
Using the data in Table 1.2 construct a graph to show the effect of pH on the time taken for the breakdown of starch.

State the optimum pH for the activity of this enzyme.
______
Describe and explain the effect of pH on the activity of this enzyme.
The rest of this paper
2 more questions- Q2Microscopy and Biological Drawing · Experimental Contexts · Observations and Measurements · Use of Techniques, Apparatus and Materials · Planning Experiments and Investigations17M
- Q3Experimental Contexts5M